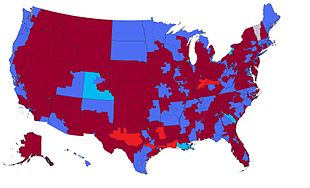
Elected to the United States House of Representatives in 2004

The 2004 election to the United States House of Representatives took place on November 2 of this year, at the end of President George W. Bush's first term in office . The same day the presidential and senate elections and, in some states, gubernatorial elections were held. The Republican Party was able to maintain its good result from 2002. It lost only a minimal share of the vote, was even able to win three more seats at constituency level and thus slightly increase its absolute majority of seats in the House of Representatives. Despite a slight percentage increase in the vote, the Democrats lost two seats due to the majority vote. As the only non-party candidate, Bernie Sanders was again successful in Vermont and was able to maintain his district with 67.4% of the vote.
The previous election campaign was dominated by foreign policy issues. As with the election two years earlier played the war on terrorism ( War on Terror ) a major role. The Iraq war in 2003 with the subsequent occupation of the country was of the greatest importance . The debates over Iraq policy polarized the electorate.
Republican Dennis Hastert of Illinois was Speaker of the House. The MPs Max Burns ( Georgia / R), Phil Crane (Illinois / R), Baron Hill ( Indiana / D), Max Sandlin and Martin Frost (both Texas / D) were voted out .
The election results
| Parties | Seats | be right | ||||||
|---|---|---|---|---|---|---|---|---|
| 2002 1 | 2004 | +/- | Strength | be right | % | modification | ||
| republican | 229 | 232 | +3 | 53.3% | 55,713,412 | 49.2% | −0.4% | |
| Democrats | 204 | 202 | −2 | 46.4% | 52.745.121 | 46.6% | + 1.6% | |
| Independent | 1 | 1 | ± 0 | 0.2% | 674.202 | 0.6% | + 0.2% | |
| Libertarian party | - | - | - | - | 1,040,465 | 0.9% | −0.5% | |
| Green party | - | - | - | - | 331.298 | 0.3% | −0.1% | |
| Independence Party | - | - | - | - | 246.070 | 0.2% | ± 0.0% | |
| Working families party | - | - | - | - | 145.979 | 0.1% | - | |
| Constitution Party | - | - | - | - | 132,613 | 0.1% | ± 0.0% | |
| Reform Party | - | - | - | - | 85,539 | 0.1% | + 0.1% | |
| Other parties | - | - | - | - | 2,063,606 | 1.8% | −0.8% | |
| total | 434 | 435 | +1 | 100.0% | 113.192.286 | 100.0% | - | |
| Source: Election Statistics - Office of the Clerk | ||||||||
1 seat vacant due to the death of Patsy Mink ( D - Hawaii )


