
Weather radar


As weather radar all radars called, used primarily to detect Weather serve data. Weather radar devices are often networked with one another and feed their radar information into a mainframe computer , which calculates a general weather situation from these current observations and enables a weather forecast through simulations and comparisons with weather processes known from the past. A well-known type of weather radar is precipitation radar, which is sometimes called rain radar.
history
The possibility of using radar devices for weather observation was recognized as early as the Second World War. Military homing and air surveillance radar devices showed the contours of bad weather areas as a false echo. This was not wanted in a military context, as these bad weather areas would hide enemy aircraft. These phenomena have been investigated by meteorologists. In 1941, General Electric's John W. Ryde built the first weather radar. He recognized that initially the attenuation of the radar beams when crossing a rainy area enabled a more precise measurement than through backscattering. It wasn't until 1947 that Dr. John Stewart Marshall and his student Walter McK. Palmer experimentally found a relationship between radar intensity and rain rate. The drop size distribution of Marshall and Palmer (1948) is the most widely used function in meteorology to this day.
During the Second World War, working on a weather radar was rather the exception. The civil use of radar for targeted weather observation did not occur until later, from around 1950, especially since radar equipment represented a very expensive investment. Initially, for reasons of cost, the weather radar devices were limited to a pure distance determination with classification of the measured reflectance . It was not until 1980 that the use of weather radar became normal.
A so-called hook echo was first recorded on April 9, 1953 by a radar device at Willard Airport near Champaign (Illinois). Such hook echoes in precipitation radars were recognized as an indication of the presence of a super cell with a risk of tornado .
On July 7, 1957, an X-band radar (9 GHz) was put into operation at the Meteorological Institute of the Free University of Berlin . On the same day it was possible to warn of an approaching storm front.
The use of the Doppler effect to measure wind speeds within the precipitation area was described in 1961 by Roger Lhermitte and David Atlas . These speed measurements were initially aimed at determining the size of the raindrop by measuring the speed at which it fell. However, since the speed of fall could not be distinguished from the local wind speed, this method of determining the drop size was discarded and only one wind speed was measured. Doppler weather radars offered good measuring options for measuring and predicting the direction of movement of tornadoes and hurricanes.
The first weather radar for atmospheric investigations based on continuous wave radar was built in 1969. Continuous wave radars have been used as weather radar and for simultaneous distance and speed measurements since the 1970s. In 1976, continuous wave radar was used for the first time to measure the Doppler frequency of wind speeds.
From the mid-1970s, technological advances in radar and computer technology made it possible to study the dynamics of clouds and the internal structure of the supercells in a thunderstorm. These measurements from a single Doppler radar only give a one-dimensional image of the speed field, but they can be used to determine the position of the updraft or downdraft zones in thunderstorms. An observation with two Doppler radar devices simultaneously from different directions can also generate a three-dimensional image of the speed field. The first radar of the radar network of the German Weather Service was installed in 1987 in Munich. It was not until 1990 that a composite image of the DWD radar network was generated from four radar locations. Networking of the radar devices and their coupling to large data centers for digital processing of a weather forecast was carried out on a large scale up to the turn of the millennium.
From the turn of the millennium, practical testing of polarimetric radar systems began. A direct measurement of the drop size is only possible with this polarimetric radar , as described by Dušan Zrnić in the 1990s. This radar can measure the ratio of the height and width of water droplets, snowflakes, and sleet or hailstones (collectively called hydrometeors ). From this ratio, either the size of the raindrops can be determined or raindrops can be distinguished from hailstones.
Types

The basic principle of distance measurement is the same for all weather radar devices. Differences are in the variation of parameters that can be optimized for a particular expected result. The main difference is in the frequency range used. The choice of the frequency range determines the attenuation of the electromagnetic waves by the atmosphere, even more so by a cloud or precipitation. The working frequency determines the possible depth of penetration of the radar beams into this precipitation area and which objects from this area contribute to a reflection. That means whether only the outer contours of this area can be seen on the weather radar or the inner structure can be recognized depends on this working frequency. In the uppermost (blue) curve, the picture on the right shows the geometric extent of a thunderstorm with a diameter of 20 km with an increasing amount of precipitation up to 100 mm / hr as the cause of damping. The curve below (in purple) shows the level-matched amplitude of the radar echoes from a radar device in the S-band. The next two curves show the same of a radar device in the C-band (ocher) and one in the X-band (light blue). It can be seen that weather radars in the X-band can only be designed for close range. The radar transmission energy in the S-band, on the other hand, is hardly attenuated - this is also a sign that this radar will only show this precipitation area very weakly, as not enough energy is reflected. The necessary energetic conditions must be created for the desired range. Weather radar devices therefore have a wide range of used pulse power from the transmitter, from just a few kilowatts to several megawatts.
| Weather radar | Frequency band | Radar coverage | Cause of reflectivity | Range | comment |
|---|---|---|---|---|---|
|
Precipitation radar (long range) |
S-band (around 3 GHz) | Complete spatial scanning, mostly all-round view with a gradual increase in the elevation angle |
Hydrometeors like raindrops, hail, ice, snow | > 800 km | low frequency enables great penetration depth; is mostly used in subtropical climatic regions with low site density and very heavy rainfall |
| Precipitation radar (short or medium range) |
C-band (around 5.6 GHz) | up to 200 km | higher frequency means shorter range with higher accuracy, suitable for moderate climates and greater density of locations |
||
| Wind Profiler (MST Radar) | HF to UHF (30 to 3000 MHz) |
vertically upwards with a slight variation in direction | Boundary layers between air masses of different densities | 2 to 20 km | so-called clear air Doppler radar |
|
Wind Profiler ( microwave sounder ) |
above K-band (> 40 GHz) | Codensation droplets such as fog and clouds Boundary layers of the air on acoustic longitudinal waves |
up to 15 km | often coupled with the SODAR acoustic system | |
| Cloud Radar Cloud Profiling Radar ( CPR ) | W-band (96 GHz) | from the satellite position vertically downwards ( nadir ) | Humidity (also fog, clouds) | about 500 km | measures the cloud height as the distance to the orbit, uses the high PRF mode , displays results " along track ", ie as a function of the path |
| Cloud radar millimeter-wave cloud radar ( MMCR ) |
K and W band (33 and 96 GHz) |
from the floor vertically upwards | Clouds | about 20 km | Polarimetric radar in both frequency bands, measures the cloud height and cloud structure directly above the radar, displays the results as a function of time |
| Airborne radar | X-band (around 10 GHz) | Sector search ahead in flight direction | Precipitation and clouds, planes and obstacles | about 200 km | If an airborne reconnaissance radar is in an aircraft, weather data is displayed in skin-paint mode, aircraft also as symbols. An anti-collision system usually shows its data on the same display. |
| Microburst radar | X-band (around 10 GHz) | All around search | Boundary layers between air masses of different densities, dust, insects | about 2 km | a modified airborne radar stationary on the airfield, shows dry falling squalls ( downbursts ) before they can be dangerous to the pilot. |
Precipitation radars


Precipitation radars are pulse radars in relatively low frequency ranges. They register hydrometeors ranging in size from around 100 µm to several millimeters. In practice, weather radar devices are used as precipitation radar in the S-band in order to clear up large distances in tropical regions with very intense weather phenomena. For the same task, a C-band radar device can be used in a moderate climate, which can be much more accurate due to the higher frequency and a more effective antenna size. The use of multi-frequency radar devices to differentiate between cloud and precipitation has a special meaning in weather radar: The difference between the two working frequencies must be at least several frequency bands. For example, the MMCR uses the K and W bands with a frequency difference of 1.5 octaves.
To fulfill different tasks, the weather radar devices are equipped as sensors with different properties. The maximum range (and thus the transmission power) as well as the frequency range used is adapted to the results as expected. Due to the divergence of the electromagnetic waves over the distance and the associated spatial expansion of the emitted radar pulse, a weather radar becomes less precise the further away the weather phenomenon to be examined is located. The angular resolution of a radar depends on the distance. The pulse volume in the beam of the far-off radar is considerably larger (in the picture delimited in red) than the pulse volume in the nearby radar (in the picture in blue). This means that the more distant radar has a much poorer resolution and is therefore less precise. For this reason, many smaller weather radars should be given preference over large-scale weather radar. The German Weather Service can cover the entire area of Germany with 17 radar locations with a range of 150 km each.
Cloud radar
Cloud radar (usually called cloud profiling radar ) measures the reflections from the smallest water droplets and their condensation nuclei. These radar devices therefore use frequencies above 30 GHz up to 96 GHz in order to be able to detect the smallest floating droplets with a diameter of 10 to 100 µm. Satellite-based weather radar devices, which are supposed to directly measure the distribution of humidity in the atmosphere, also use frequencies above 94 GHz. The precipitation radar (PR) on board the TRMM satellite ( Tropical Rainfall Measuring Mission ) uses an operating frequency in the range of 14 GHz.
Wind Profiler

Wind Profiler or Wind Profiling Radar refers to a weather radar that is used to measure height profiles of vertical and horizontal winds in the troposphere. In order to be able to measure wind speeds, a reflective object must be used, which hovers in the air and moves with the wind speed. The principle can be based on two different reflective object groups. One group uses suspended particles in the air and therefore uses the highest possible frequencies. Another group uses the different refractive index of air layers for an echo signal.
Microwave Sounders (MWS) radiate directly upwards and measure the height of various layers of air directly above the radar. Often this happens at the same time with a sonar-like technology, which is why the name sounds more like an acoustic device . With their very high working frequency, they cannot penetrate dense clouds; the structure within the cloud remains hidden from them.
Pure wind profilers use a phased array antenna in order to be able to electronically pivot the upward beam slightly. The Doppler frequency is measured in three different directions and, assuming that the wind direction and wind speed are constant in this small sampled height range, the horizontal wind speed and the wind direction over the ground are calculated from the three different measured radial speeds. With the so-called radio acoustic sound system , the temperature in higher layers can also be measured indirectly. Loudspeakers emit a sound at a very high volume upwards. In the rhythm of these longitudinal waves, the air is compressed and traveling waves are formed that travel at the speed of sound. However, the speed of sound varies slightly with air temperature. Therefore the wavelength changes and the distances between the pressure maxima are not constant. The radar measures these distances with the help of interference that arises according to the Bragg condition . The radar echo from a certain distance is at its maximum when the distances between the acoustic wave propagating at the speed of sound are equal to half the wavelength of the radio waves of the UHF radar. By slightly varying the transmission frequencies, the acoustic wavelengths can be measured very precisely. The exact speed of sound can be calculated from these measured wavelengths of an acoustic oscillation with a given frequency and the air temperature can be derived from this.
Clear-Air-Doppler-Radar It receives the irregularities in the refractive index of the air (so-called “ clear-air echoes”, known as “angels” in air surveillance radar) caused by irregularities in the refractive index of the air and measures the Doppler spectrum of the echo signals scattered back to the radar. These devices mostly use the frequency range from 30 to 3000 MHz (VHF and UHF bands), firstly because the energy content of atmospheric turbulence falls rapidly with decreasing vortex size and secondly because the radar here mainly receives echo signals from turbulence with a size that is within the Bragg range , i.e. half the wavelength of the radar. The UHF range is mostly used up to a height of a few thousand meters. This ensures relatively small antennas that can be set up and taken down quickly. These UHF radars are often referred to as boundary layer radars . Since the minimum size of the turbulence increases exponentially with increasing altitude, frequencies below 50 MHz are used for so-called MST radars (for heights in the mesosphere , stratosphere and troposphere ) or ST radars (for heights in the stratosphere and troposphere). This frequency range requires significantly larger antenna dimensions, but has the advantage that these frequencies can easily penetrate even heavy precipitation areas and clouds.
Weather radar on the plane
A weather radar built into an aircraft is known as airborne weather radar . The imprecise German translation on- board weather radar could not establish itself in the linguistic usage. Based on the use of your data, two different device groups can be distinguished. The main application is the early warning of the pilots of dangerous weather phenomena and the display of the radar data directly in the cockpit. Another application is the use of a Doppler radar in a special aircraft for weather research.
.jpg)
Bow radar

_on_Boeing_747-400_(cropped).jpg)
In general, larger aircraft are equipped with a weather radar, which is usually installed in the bow behind a radome (known as a radar nose ). Earlier devices could also be built into the profile nose of a wing. The radar device has special requirements in terms of size and weight. The weather radar in the aircraft mostly works in the X-band (around 10 GHz). This means that the antenna can be kept very small despite its good directivity. It not only locates raindrops, but also aerosols and clouds. The weather information is displayed on a multifunction radar display (MFRD or MFD). The weather radar is always linked via the display device to the secondary radar, which is already required for approval in aircraft (for example aircraft radio transponder and collision warning system ) and can also display its additional information. The latest avionics show the current and future weather on a central cockpit situation display .
The weather in the cockpit is usually displayed in the so-called skin paint mode. That means, as with an analog radar, the surface of the screen is highlighted with a color for the strength of the echo signal. The weather radar is therefore often referred to as skin paint radar . Aircraft in the range of the weather radar are used as synthetic target character ( target shown), either in the plot extractor of the primary radar, or by a query or ADS-B -Message from the secondary radar is generated. The radar signal processing can even classify the primary radar data from models stored in databases. In some military nose radar devices, the characteristic Doppler spectrum of a propeller-driven aircraft and a matching typical size of the effective reflection surface on tanker aircraft can thus be recognized.
Since the relative antenna size, measured against the wavelength used, does not permit very strong bundling, a higher-resolution image is usually generated in this case using the " Doppler Beam Sharpening " process. Its working principle is that every angle deviating from the current course must have a Doppler frequency reduced according to the sine function. Therefore echo signals can be positioned more precisely within the current beam according to the received Doppler frequency. In the area of effective use of Doppler Beam Sharpening , the angle resolution of an antenna with a real opening angle of around 4 ° can be improved to values of around 0.5 °.
Military aircraft (fighter planes) also use nose radar. This radar is a multifunctional radar that is primarily used for target searching and targeting. At the same time, the weather is also shown. Such a distribution of tasks is possible through the digital generation of several antenna diagrams at the same time during the reception time. For this purpose, each individual antenna element of the phased array antenna is equipped with its own receiver and its own analog-digital converter . A phase-correct addition of the individual received signals takes place in the software in a beamforming processor . At the moment of transmission, a very wide antenna pattern must be emitted, which covers all the very narrow reception patterns required. In this case, in the basic radar equation, a separate antenna gain must be used for the transmission moment and for the reception moment to calculate the range.
Side or rear radar
The use of weather radar devices as side or rear radar in a special aircraft has advantages over stationary radar devices. While stationary radars have to wait passively for the approaching storm, the aircraft can fly directly to the action and provide close-ups from a short distance. These close-ups have a very good resolution because the pulse volume of the radar beam is not yet fanned out widely. The influence of any interfering signals is less due to the size of the echo signals from close proximity. On the other hand, the disadvantage is that the antennas to be transported by the aircraft cannot have large geometric dimensions. A compromise must therefore be found for the ratio of antenna size to wavelength. An example of such a special weather radar is the ELDORA / ASTRAIA Doppler weather radar
Weather channel in the reconnaissance radar
A weather channel is often integrated in large air reconnaissance radar devices. Weather data is required to improve the probability of detection of missiles within the filters of the plot extractor. If the air reconnaissance radar is used as an air traffic control radar, then this weather data is required at the same time for flight advice and for the management of a landing approach. It therefore makes sense to present this weather data to the air traffic controller on a separate screen (or screen window). For meteorologists, on the other hand, this weather channel is not very meaningful because it only has a limited resolution. Usually only four different reflectivities are displayed as color codes in this weather channel. This weather image can therefore only be used for a short-term weather warning.
Classification
A classification of weather radar devices can be carried out according to several criteria. Weather radar devices are divided into conventional, Doppler and polarimetric radar devices based on the historical development and the resulting differently developed technical measurement options.
- A conventional weather radar can be defined as a weather radar system without the possibility of measuring the Doppler frequency. It uses a free-swinging self-excited transmitter (usually a magnetron ) and is therefore not coherent . In addition to the transit time, this weather radar only measures the power of the echo signal. This means that only the spatial distribution of the precipitation intensity can be determined. Conventional weather radar devices are a historical stage of development and are practically no longer used.
- The most widely used weather radar system is the Doppler weather radar . These radar devices are at least coherent on the reception path and can therefore also measure the Doppler frequency. In addition to the spatial distribution of the precipitation intensity, the radial velocity of the precipitation is determined on the basis of the Doppler effect . Small-scale changes in the radial speed can be indicators of air circulation in the appropriate weather conditions ( e.g. tornadoes ). Doppler radar is the most widely used weather radar.
- The polarimetric weather radar is a Doppler weather radar, which is able to send and receive impulses with different polarization directions . By using several directions of polarization of electromagnetic waves and evaluating the resulting differences in the received echo signal, additional information about the form and type of precipitation is obtained. Outside of research institutes, polarimetric radars are only used as precipitation radar. Newer devices also offer the STAR mode (of English .: S imultaneous T ransmit A nd R eceive which) here for the simultaneous transmission and reception in two polarization directions is.
Working method
The technical principle of a weather radar is very similar to that of a primary radar and impulse radar for military air reconnaissance. As with any primary radar, high-frequency vibrations are generated by a powerful transmitter. This energy is bundled by an antenna as an electromagnetic wave and radiated in a directional manner. If this wave hits an obstacle, it is partially or completely reflected. This echo signal is received and evaluated again by the weather radar. The decisive difference is that with a radar device for air space reconnaissance a target is only detected (target available: yes / no), only the coordinates of the target location are measured. With a weather radar, however, the intensity of the echo signal is important. This is determined by measuring the power of the echo signal and provides information about the intensity and consistency of reflecting objects in the observation area. Compared to air surveillance radar, interference from unwanted echo signals ( clutter ) is classified in the opposite way. Echo signals from an aircraft are a disturbance in the weather radar and the “weather clutter” called in the air surveillance radar is the target of the measurement.
In contrast to radar devices for air reconnaissance (e.g. air traffic control or air defense), compact point targets are not located, but volume targets, which in turn result in energy differences. With a volume target, the entire pulse volume is filled by reflective objects. The further away the volume target is, the larger the pulse volume and the more reflective objects there can be. For example, the pulse volume for a weather radar with an opening angle of the antenna of less than 1 ° and a pulse duration of 0.4 µs has the dimensions 800 m × 800 m × 80 m at a distance of 50 km. Clouds with a probability of precipitation usually have much larger dimensions. The distribution of the water droplets (either as rain or as a dense cloud) in this volume is assumed to be uniform and thus completely fills this volume in a certain density. A single point target, however, with its distance-independent effective reflection surface is lost in this impulse volume.
This results in different range conditions for both radar applications. If a radar in the S-band as air traffic control radar has a range of 100 km for point targets, then the same radar used as precipitation radar achieves a range of 230 km for volume targets.
Since a weather radar does not have to make time-critical measurements, the antenna can be a sharply focused parabolic antenna that, for example, as a precipitation radar rotates continuously through 360 ° and scans a slightly different elevation angle after each rotation. Due to this spiral spatial scanning, the weather radar is a 3D radar which by default only provides new data every 5 to 15 minutes. A complete volume scan is carried out within 15 minutes by searching up to 18 different elevation angles from + 0.5 ° to + 37 °. In the altitude angles of + 0.5 ° to + 4.5 °, a range of 230 km is usually searched in a so-called intensity mode . In the other elevation angles, the so-called Doppler mode is used with a range of 120 km. Since the values from the lowest range (+ 0.5 ° to + 1.8 °, depending on the coverage angle of the terrain) are of particular importance for the precipitation measurement, the full volume scan is interrupted every 5 minutes to reduce this lowest elevation angle range in a shorter time Search episode.
For very high demands on the accuracy of distance determination, continuous wave radar devices are used instead of pulse radar with a time of flight measurement as a measure of the distance . With the measurement of a frequency difference as a measure for calculating a transit time and subsequently for determining distance, the continuous wave radar method offers significantly more precise measurement options, but the devices then only have a short range. This can be exploited in a targeted manner by using these continuous wave radar devices specifically as microwave sounders to measure the cloud height or the boundary layers between different air masses of different densities. Continuous wave radar devices are very inexpensive compared to pulse radar devices and can therefore be produced and used in large numbers.
Block diagram

A general block diagram of a weather radar device consists of a mostly very large antenna that is mounted on a turntable so that it can be rotated and pivoted, the electronics racks in a technical operating room and one or more system computers with monitors.
antenna
The antenna is usually a symmetrical parabolic antenna with a size in relation to the wavelength used so that a directivity of approximately 1 ° is created. In the S-band (3 GHz) this antenna has a diameter of about 8.5 m, in the C-band (5.6 GHz) of about 4.2 m. A weather radar built into an aircraft can have a maximum diameter of one meter. In line with this diameter, the radar works in the X-band (around 10 GHz). The current mechanical positioning is reported directly to the system computer via encoder .
A transmit / receive switch (or duplexer ) switches the transmitter to the antenna at the moment of transmission . At the same time, it must protect the sensitive receiver from the high power of the transmitter. At the moment of reception, the echo signals must be sent to the receiver and must only be slightly attenuated. It is usually built on the basis of gas discharge tubes.
Wind profilers mostly used a phased array antenna in order to be able to electronically pivot the radar beam. Airborne radars also use a phased array antenna, but no longer for electronic beam swiveling, but to generate a fixed antenna pattern, which is then swiveled mechanically. This mechanical pivoting is stabilized in the horizontal direction by servomotors depending on the flight position.
Transmitter and modulator
A semiconductor-based transmitter (mostly MMIC technology) can be used for very short ranges . Since very high pulse powers are usually required, klystrons are often used as power output stages and traveling wave tubes as driver stages. The modulator ensures that the transmitter tubes are only supplied with the necessary high voltage at the time of transmission.
Time control by clock generator
For an unambiguous distance measurement and an unambiguous Doppler frequency measurement (known under the keyword “ Doppler dilemma ”) compromises have to be made in the timing of the radar. For a clear determination of the distance, the pulse repetition frequency should be as low as possible so that there is sufficient time between the transmission pulses for the reception of echo signals from a great distance with a relatively long transit time. Speed is measured by means of a phase change from pulse period to pulse period. However, this restricts the range of a clear speed measurement by means of the Doppler effect. Since a Doppler frequency is measured based on phase changes of the echo signal from one pulse period to the next, only a Doppler frequency which is smaller than the pulse repetition rate can be uniquely measured. For this measurement the pulse repetition rate should be as high as possible. Weather radar devices in the C-band require a pulse repetition frequency of less than 1 kHz for a clear distance measurement within 150 km. In order to be able to measure the maximum expected peak speeds of a hurricane of up to 300 km / h, a pulse repetition frequency of at least 3 kHz is necessary. Weather radar devices therefore use a variable pulse repetition frequency, with which, for example, a lower pulse repetition frequency is used in a direction close to the ground with the expectation of a long range. If the antenna points at a large angle of elevation and therefore only a shorter range is required, the weather radar uses a higher pulse repetition frequency. At the same time, a lower pulse power is also required in this case, so that the transmitter can constantly output the same continuous wave power despite these differences in timing and a variable pulse power .
It is technically possible to use intrapulse modulation and the pulse compression method as a means of improving the resolution at a distance, but it is not used with pleasure in weather radar. The unavoidable temporal side lobes of the output signal would falsify the measurement results for the neighboring range cells. A calculation out is possible if the size of the side lobes is known, but it means a huge amount of computational effort, since this correction has to be carried out individually for each range cell. Weather radar devices therefore usually use an extremely short transmission pulse, for example in the range of 0.4 - 4.5 µs. If an intrapulse modulation is carried out, this is often phase coding according to a Barker code , since the resulting side lobes are of a known size.
receiver

The receiver converts the high-frequency echo signals into an intermediate frequency that is easier to process. Interference and noise are filtered out as much as possible. This intermediate frequency is digitized. Demodulation only takes place digitally in the system computer.
For the receivers used in a weather radar, special requirements apply to linearity and dynamic range . The smallest echo signals to be processed have a strength of around −120 dBm (this power is in the pico watt range). Beneficiaries are allowed by strong clutter interference is not in the (echo signals from ground obstacles such as vehicles, buildings, trees and terrain elevations) Saturation come. These fixed target interference can be 96 dB (4,000,000,000 times) greater than these weak echo signals. In order to be able to process these differences in performance at all, special measures must be taken in the recipient.
The receivers require very high dynamics, extreme sensitivity and, above all, very good accuracy. Changes in the linearity of the amplification must be known to the radar signal processor in order to be able to restore the information about the exact amplitude of the original in the case of the necessary dynamic compression in the receiver. Therefore, simple STC circuits and logarithmic IF amplifiers with demodulation, as used in air surveillance radar devices, are generally not suitable.
In order to expand this dynamic range of the receiver, several receiver circuits are operated in parallel. A receiver circuit with a logarithmic amplification characteristic is used to obtain a rough overview of the amplitude of the echo signal. Its output signal is used in a downstream analog-digital converter to generate a control signal for a regulated attenuator (attenuator). This signal is sent to the radar signal processor at the same time so that the current status of the attenuator can be taken into account when calculating the amplitude. This analog-to-digital converter has to be extremely fast so that the attenuation can still affect the current echo signal. It will flash ADC circuits used which have a delay in the order of a nanosecond.
The input signal for the linear receiver circuit must be delayed before this attenuator by exactly this internal running time in order to avoid switching peaks. This receiver is usually a double superheterodyne receiver with two different intermediate frequencies . This allows a relatively large bandwidth with a good selection of the receiving frequency at the same time. In spite of this, sometimes only a downward mix can be seen in the circuit diagram, because the second intermediate frequency is often already digitized and the subsequent demodulation is then done by the software.
Viewing devices
Conventional weather radar principally used a cathode ray tube as a panoramic viewing device (English: Plan Position Indicator , PPI) with a map-like display. Modern monitors and screens are mostly only designed as computer displays or in special cases (in the cockpit ) as small LC displays .
The height of the reflective layers could not be easily recognized on the panoramic viewer (or the PPI scope ). A pure PPI image had the disadvantage that it could only show the reflectivities of a very specific elevation angle (usually the lowest). This representation is known as base reflectivity . The echo signals come from clouds or precipitation from a different height, which depends on the distance. The measurement results from close range were therefore underrepresented. An additional viewing device as an RHI scope could display all elevation angles one above the other in a single side angle. To remedy the lack of under-representation of areas, composite reflectivity was introduced. It is a stitched image of reflectivity. Initially, only the elevation angle scan with the strongest reflectivity was displayed in the respective side angle. Different processed reflectivities or local wind speeds can be displayed in the PPI image. It is also possible to show accumulated amounts of rain within a period, but for this purpose other data sources for the radar must be used.
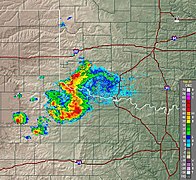
With more advanced signal processing, it was possible to represent the echo signals as a single height section. This viewing device was called the Constant Altitude Plan Position Indicator ( CAPPI ) and is also a version with composite reflectivity . CAPPI is a horizontal two-dimensional representation of radar measured quantities at a certain altitude (or altitude). A CAPPI is calculated and interpolated from several PPI measurements at different elevation angles (elevations). Weather radar images that are published on the Internet are mostly such PPI representations as composite reflectivity in false colors . A color coding of the echo signals can alternatively be selected either as a height display or as a display of the reflectivity.
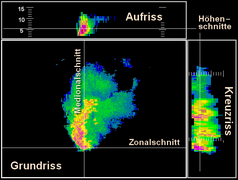
Another display option is called Vol-CAPPI ( Volume Constant Altitude Plan Position Indicator ) and allows a clear echo assignment in all three cracks . In addition to a floor plan, an elevation (the front view; corresponds to a side elevation from east to west) and a cross plan (the side view; corresponds to a side elevation from north to south) are also shown. With the help of a crosshair, the positions of these cuts can be selected as desired.
Maxima of the CAPPI data from different heights are displayed in a MAX-CAPPI. The Max-CAPPI display is generally used to provide an overview of the weather. This is done on the one hand through a vertical maximum projection in an (image) elevation, on the other hand through horizontal maximum projections from south to north or from west to east in side elevations. In the side cracks, the side scale indicates the height in km. Reflectivities are usually displayed in a MAX-CAPPI.
The radar image is composed of the values of individual volumes. It is usually a highly pixelated representation, since the smallest volumes have edge lengths on the order of several hundred meters. For the presentation in the media, the image is rendered and the intermediate values interpolated. These calculations are carried out by special computer programs, for example the radar software "RadVis" on the basis of the radar data provided and stored by the DWD. As a rule, the latest radar image is available around three minutes after every quarter of an hour.
A real volume display shows a 3D calculation of all available information. Despite all the clarity, such a 3D representation is not very useful for a meteorologist, since targeted measurements within partial areas of the supercell of a thunderstorm shown in the picture are not possible.

The first PPI representations could only be saved photographically.
more modern PPI display with base reflectivity

Same picture with composite reflectivity

Range-Height-Indicator (RHI) with a supercell of a thunderstorm

Calculation of a CAPPI from the reflectivities of different distances and elevation angles
Elements of a Vol-CAPPI, a normal projection of weather radar data


Networking
All radar devices of the German Weather Service are networked with mainframes. In this way, the data can be compiled ( composite ) far beyond the individual ranges of the radar devices and the radar data become more consistent . Dual Doppler measurements or dual Doppler analyzes are compilations of the data from two or more neighboring Doppler radar devices. With these radial speeds measured simultaneously from different locations, additional information can be gained when determining the horizontal or the three-dimensional wind field. If the distance between the radar devices is between 30 and 60 km, there is a favorable measurement geometry.

In the USA, where a very dense network of weather radar devices cannot be set up due to the large distances to be covered, many smaller mobile radar devices are used for the special investigation of hurricanes and tornadoes. The complete weather radar is mounted on smaller trucks and is fed by diesel generators. This campaign is called Doppler radars On Wheels ( DOW ) (in German: Doppler radars on wheels). Frequency bands X, K or W are used to ensure that the antenna remains as small as possible despite its high directivity. With these mobile radar devices, you can drive directly to the scene and start measurements there within minutes. This enables measurements up to about 50 m above ground and a large amount of detail in the measured values.
Bistatic radar systems
A bistatic radar device operates the transmitter and receiver at different locations. A bistatic radar system can be built from a monostatic precipitation radar (transmitter and receiver at the same location) by setting up several passive receivers in the vicinity of a monostatic precipitation radar. In this way, additional information is gained. The more antenna diagrams of these passive receivers overlap, the more precise the determination of the three-dimensional wind field becomes. Such bistatic systems are much cheaper than several monostatic radar devices in close proximity. The disadvantage is that the geometry becomes much more complex and prone to errors (for example due to side lobes).
Radar equation for volume targets
The theoretical range of each radar device is assessed using the basic radar equation . The basic radar equation is independent of the type of modulation and independent of whether it is a pulse radar or a continuous wave radar . Therefore it can also be used for weather radar devices. It sets the power in the received echo signal in relation to the transmission power. If a transmission pulse is used, the basic radar equation here initially assumes that the length of the transmitted pulse is identical to the length of the received echo signal. Thus, instead of the energy content of the pulse, power can be considered.
| (1) | Here mean: |
P r = received power |

Since this initial equation was derived for the case of calculating a maximum range of a radar device, the reference σ 0 is also used for the effective reflection surface . This is the effective reflection area of 1 m², caused by a metallic ball with a diameter of 1.4 m. In this case, the range is usually determined as an unknown in this equation by solving the equation for r 4 and using the maximum receiver sensitivity as the received power. In the following case, however, the range is known from the transit time measurement and the relationship between the power of the received echo signal and the variability of the effective reflection surface of a volume target is to be investigated depending on the distance.
For this purpose, all parameters that are structurally specified in a radar and are not variable (for example, transmission power, wavelength, losses ...) are combined into a constant factor β from the general form :
| (2) | Here mean: |
P r = received power |

In the case of a weather radar, the effective reflection surface is not a point-like target, but a volume target. With a volume target, the entire pulse volume V is completely filled by statistically distributed reflective objects. Ideally, these form a medium that is semi-transparent to microwaves. Part of the transmission energy is reflected, part is passed on, slightly attenuated. The sum of all reflective surfaces in a volume unit (1 m³) is referred to here with the temporary variable η and can be seen as the sum of the reflective surfaces of all scattered objects occurring in this volume unit:
| (3) | Here mean: |
η = reflectivity expressed as the effective reflection area per unit volume |

The variable η can also be described as:
| (4) | Here mean: |
N = the number of scattering objects in the volume unit |

We no longer speak of reflective surfaces, but of scattered objects. Mostly there is no homogeneous structure, but a mixture of different objects.
The reflected energy registered by the radar at the end is not only caused by a reflection , but also by diffraction , refraction and the subsequent superposition of the individual components of the scattered energy in a certain direction (here the direction back to the radar antenna). Whether mainly a reflection or mainly diffraction and refraction takes place depends on the size and the electrical properties of the scattered objects.
The relationship between the size of the scattering particles and the wavelength of the weather radar can be examined. Gustav Mie developed a theory about the elastic scattering of a plane electromagnetic wave on spherical objects. This Mie scattering , named after him , partially applies to the scattering behavior in a precipitation area. A directly reflected portion will be superimposed with a portion of the energy that is bent around the circumference of the water drop. This can lead to an amplification in the case of phase equality and to a weakening of the reflected component in the case of opposite phase. The backscattered energy is therefore dependent on the radius a (the otherwise usual letter r is already assigned here for the distance) of the raindrop, the wavelength λ of the weather radar and the complex refractive index m of the drop. The ratio determines whether the object is more diffuse or more reflective. Large droplets can be very large compared to the wavelength and are therefore located in the so-called “optical region”. Smaller droplets can be in resonance if they are of a size in the range of the wavelength. This is the so-called Mie area. If they are much smaller than the wavelength, in the range ≤ λ / 10, then they are in the so-called Rayleigh region .

Precipitation radars use wavelengths from 10 cm (middle S-band ) to 3 cm (X-band). Cloud radar uses frequencies above 40 GHz, which corresponds to a wavelength of less than 8 mm. The expected raindrop size of 0.1 mm to about 5 mm will always be in the Rayleigh region on a precipitation radar. For this region, the following approximation applies to the effective reflection area of a single drop:
| (5) | Here mean: |
| K | 2 = is calculated from the refractive index m according to D i = diameter of the i th drop
|


The expression | K | In the following, 2 is treated as a constant which is about 0.93 for water droplets and about 0.197 for ice. This equation can be plugged into the previous one. The constant factors are extracted from the sum as multipliers. The temporary variable η as the sum of the reflection areas of all scattered objects occurring in a volume unit is calculated with:
(6)

The reflectivity Z can be defined from this equation . It is the same as the expression in this equation with the sum symbol. Their unit of measurement results from the dimension of the diameter of the water droplets in [mm] per volume unit [m 3 ]. Of course, this could be reduced mathematically, but since the droplet diameter is to the power of six and would have to be converted into cubic meters, the result would be a very unwieldy number with powers of ten. Therefore it is customary to keep these given units of measure. The reflectivity Z thus has the fixed unit of measurement [mm 6 / m 3 ].
The second size from the equation (3) is the pulse volume V . It consists of a section of a spherical surface , which is determined by a horizontal angle θ and a vertical angle φ . This is the respective half- width of the main lobe of the antenna. The third coordinate for a volume results from the transmission pulse duration τ and the speed of propagation of the electromagnetic waves, i.e. the speed of light c .
| (7) | Here mean: |
φ = vertical opening angle of the antenna diagram |

These descriptions from the two elements of equation (3) replace the effective reflection area σ in equation (2) :
(8th)


After resolving the parameters of the weather radar summarized in the constant β , the basic radar equation appears in the form:
(9)


When summarizing and shortening, care was taken to ensure that fixed device parameters or constants appear in the front fraction. These parameters and constants can again be combined in a constant that is individual for the radar device (for example β ' ). In addition to this constant, only the variables remain
- Reflectivity Z and
- the inverse proportionality to the square of the distance, 1 / r 2 .
The constant (here β ′ ) is stored for each weather radar device individually (i.e. not just type-specific) in table form, calibrated for different types of precipitation, so that the software can easily access this data. The inverse proportionality to the square of the distance (1 / r 2 ) of the received energy, which is valid for volume targets, is to be seen in contrast to the (1 / r 4 ) -dependence for point targets, which is mentioned in equation (1). If all other parameters are the same or comparable and the reflectivity Z has a comparable size with the effective reflection surface σ 0 used as a reference , then the proportionality 1 / r 2 results in the significantly greater maximum range of weather radar devices compared to airborne reconnaissance radar devices.
When using intrapulse modulation , the radar achieves a range greater by the pulse compression factor. Since the pulse compression factor depends on the bandwidth of the transmitted signal, it can either be incorporated directly into the radar equation as a factor or it can be formulated as a function of the transmitter bandwidth ( time-bandwidth product ).
Weather radar picture gallery

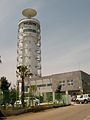
POLDIRAD research radar from the German Aerospace Center

Meteor 1500S in Adelaide (Australia)

Meteor 1500S in Gwangdeok (Korea)
Meteor 1500S in Seongsan-po (Korea)

WSR-88D Doppler radar near New Underwood, South Dakota before the supercell of a thunderstorm


Web links
- Polarimetric research weather radar of the DLR eV (near Munich)
- Weather radar research at ETH Zurich.
Individual evidence
- ↑ Jens Grenzhäuser: Development of novel measurement and evaluation strategies for a scanning cloud radar and their areas of application. KIT Scientific Publishing, 2011, ISBN 978-3-86644-775-2 . ( limited preview in Google Book search)
- ^ A b David Atlas: Radar in meteorology. Battan Memorial and 40th Anniversary Radar Meteorology Conference. Amer Meteorological Society, 1990, ISBN 978-0-933876-86-6 .
- ↑ RM Lhermitte, D. Atlas: Precipitation motion by pulse doppler radar. In: 9th Weather Radar Conf. AMS, Boston 1961.
- ^ RJ Doviak, Dušan S. Zrnić: Doppler radar and weather observations. Academic Pr, 1984, ISBN 0-12-221420-X , p. 260.
- ^ JH Richter: High Resolution Tropospheric Radar Sounding. In: Radio Science. 4, No. 12, 1969, pp. 1261-1268.
- ↑ DE Barrick: FM / CW radar signals and digital processing. NOAA Technical Report ERL 283-WPL 26, 1973.
- ↑ Chadwick, RB, KP Moran, RG Strauch, GE Morrison, WC Campbell: A New Radar for Measuring Winds. In: Bulletin of the American Mathematical Society. 57, No. 9, 1976, pp. 1120-1125.
- ^ RG Strauch: Theory and Applications of the FM-CW Doppler Radar. Ph.D thesis, University of Colorado, 1976.
- ^ Howard B. Bluestein: Severe Convective Storms and Tornadoes. Observations and Dynamics. Springer Verlag, 2012, ISBN 978-3-642-05380-1 , p. 429.
- ↑ DS Zrnić: Weather radar polarimetry: Trends toward operational applications. In: Bulletin of the American Meteorological Society , vol. 77, 1996, pp. 1529-1534.
- ↑ UN Bringi, T. A Seliga, K. Aydin: Hail detection with a differential reflectivity radar. In: Science , vol. 225, 1986, pp. 1145-1147.
- ↑ a b c Merrill Skolnik: Radar Handbook, Third Edition. McGraw-Hill Professional, 2008, ISBN 978-0-07-148547-0 , p. 19.14.
- ↑ Transportation Department, Federal Aviation Administration, Flight Standards Service: Advanced Avionics Handbook, 2009 Government Printing Office, ISBN 978-0-16-086923-5 , pp. 5–9 to 5–11 ( limited preview in Google Book Search)
- ↑ Data sheet of a multifunctional radar display from Honeywell with exemplary displays of TCAS and navigation aids on the radar display
- ↑ John Croft, "NASA Advances Single-Pilot Operations Concepts," in Aviation Week & Space Technology , January 12, 2015 ( online )
- ^ Wikiversity: Radar network of the DWD
- ↑ Vaisala , new signal processing technology for polarimetric weather radar PDF online
- ↑ a b Comparison of the radars ASR-910 and NEXRAD ( NEXRAD data: see Merrill Skolnik: Radar Handbook, Third Edition. McGraw-Hill Professional, 2008, ISBN 978-0-07-148547-0 , p. 19.16.)
- ↑ Weather radar in the DWD - radar locations and measuring principle www.dwd.de
- ↑ The Doppler Dilemma, described in the Radar Tutorial , accessed on October 12, 2019
- ↑ Data sheet of the Meteor 1700C weather radar from Gematronik , Neuss ( online )
- ↑ Interactive Radar Analysis Service (IRAS) from www.skywarn.de
- ↑ Derivation of the basic radar equation on the radar tutorial
- ↑ Mie scatter vs. Rayleigh scattering in radars in the radar tutorial , accessed October 15, 2019