European Parliament constituency: Difference between revisions
m corrected mispelling |
|||
| Line 7: | Line 7: | ||
The population of constituencies varies widely across the union. Currently, the German speaking community of Belgium are the most represented in the EU Parliament with one seat for their 71,000 population, while the people of Sardinia and Sicily are the least represented, with only one seat per 943,000 people. |
The population of constituencies varies widely across the union. Currently, the German speaking community of Belgium are the most represented in the EU Parliament with one seat for their 71,000 population, while the people of Sardinia and Sicily are the least represented, with only one seat per 943,000 people. |
||
The number of seats per constituency varies from 1 in the German speaking community of Belgium, to 23 in the north-west region of Italy. When counting countries without specific |
The number of seats per constituency varies from 1 in the German speaking community of Belgium, to 23 in the north-west region of Italy. When counting countries without specific subdivisions as single constituencies for comparison, Germany has the most seats — 99 seats. |
||
{{TOCleft}} |
{{TOCleft}} |
||
{{-}} |
{{-}} |
||
Revision as of 08:55, 12 October 2007
| This article is part of a series on |
 |
|---|
|
|
European Parliament electoral system is proportional representation.
In five European Union Member States (Belgium, France, Ireland, Italy and the United Kingdom), the national territory is divided into a number of constituencies for European elections. In the remaining 20 Member States the whole country forms a single electoral area. In Germany political parties are entitled to present lists of candidates either at Länder or national level. In Finland they may do so either at electoral district or national level. In Poland they may do so only at a constituency level, but seats are allocated nationally.
The population of constituencies varies widely across the union. Currently, the German speaking community of Belgium are the most represented in the EU Parliament with one seat for their 71,000 population, while the people of Sardinia and Sicily are the least represented, with only one seat per 943,000 people.
The number of seats per constituency varies from 1 in the German speaking community of Belgium, to 23 in the north-west region of Italy. When counting countries without specific subdivisions as single constituencies for comparison, Germany has the most seats — 99 seats.
Belgium
| Constituency | Community | Seats | Pop. | per Seat |
|---|---|---|---|---|
| Dutch-speaking electoral college | Flemish Community | 14 | 6m | 428k |
| French-speaking electoral college | French Community of Belgium | 9 | 4m | 444k |
| German-speaking electoral college | German-speaking community of Belgium | 1 | 71k | 71k |
| Total | 24 | 10.1m | 420k |
France

| Constituency | Region(s) | Seats | Pop. | per Seat |
|---|---|---|---|---|
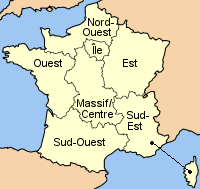
| North-West France | Basse-Normandie, Haute-Normandie, Nord-Pas-de-Calais, Picardie | 12 | 9.15m | 762k |
| West France | Bretagne, Pays-de-la-Loire, Poitou-Charentes | 10 | 8m | 804k |
| East France | Alsace, Bourgogne, Champagne-Ardenne, Franche-Comté, Lorraine | 10 | 8.2m | 820k |
| South-West France | Aquitaine, Languedoc-Roussillon, Midi-Pyrénées | 10 | 8.2m | 819k |
| South-East France | Corsica, Provence-Alpes-Côte d'Azur, Rhône-Alpes | 13 | 10.8m | 833k |
| Loire, Massif Central | Auvergne, Centre, Limousin | 6 | 4.5m | 753k |
| Île-de-France | Île-de-France | 14 | 11.3m | 805k |
| Overseas Territories of France | French overseas departments and territories | 3 | 2.5m | 820k |
| Total | 78 | 62.7m | 803k |
Ireland

| Constituency | Area | Seats | Pop. | per Seat |
|---|---|---|---|---|
| Dublin | Dublin | 4 | 1.2m | 275k |
| East | Leinster less Dublin | 3 | 1.1m | 333k |
| South | Munster less Clare | 3 | 1.1m | 333k |
| North-West | Connacht plus Cavan, Donegal, Monaghan, Clare | 3 | 880k | 270k |
| Total | 13 | 4.2m | 300k |
Italy

| Constituency | Regions | Seats | Pop. | per Seat |
|---|---|---|---|---|
| North-West | Aosta Valley, Liguria, Lombardy, Piedmont | 23 | 15m | 653k |
| North-East | Emilia-Romagna, Friuli-Venezia Giulia, Trentino-Alto Adige/Südtirol, Veneto | 15 | 10.7m | 714k |
| Central | Latium, Marche, Tuscany, Umbria | 16 | 10.9m | 681k |
| Southern | Abruzzo, Apulia, Basilicata, Calabria, Campania, Molise | 17 | 13.8m | 816k |
| Islands | Sardinia, Sicily | 7 | 6.6m | 943k |
| Total | 78 | 57m | 731k |
United Kingdom

| Constituency | Region / Nation | Seats | Pop. | per Seat |
|---|---|---|---|---|
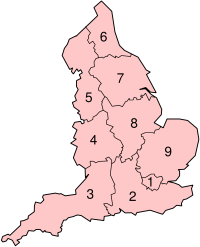
| London | Greater London | 9 | 7.4m | 822k |
| South East England | South East | 10 | 8m | 800k |
| South West England | South West, Gibraltar | 7 | 4.9m | 700k |
| West Midlands | West Midlands | 7 | 5.2m | 740k |
| North West England | North West | 9 | 6.7m | 745k |
| North East England | North East | 3 | 2.5m | 833k |
| Yorkshire and the Humber | Yorkshire and the Humber | 6 | 4.9m | 816k |
| East Midlands | East Midlands | 6 | 4.1m | 683k |
| East of England | Eastern | 7 | 5.4m | 770k |
| Northern Ireland | Northern Ireland | 3 | 1.7m | 566k |
| Scotland | Scotland | 7 | 5m | 714k |
| Wales | Wales | 4 | 2.9m | 725k |
| Total | 78 | 58.7m | 753k |
Comparison with member states with national constituencies

| Member State | Seats | Pop. | per Seat |
|---|---|---|---|
| Germany | 99 | 82m | 828k |
| France | 78 | 62.7m | 803k |
| United Kingdom | 78 | 58.7m | 753k |
| Italy | 78 | 57m | 731k |
| Spain | 54 | 43m | 796k |
| Poland | 54 | 38m | 700k |
| The Netherlands | 27 | 16m | 590k |
| Greece | 24 | 11m | 458k |
| Portugal | 24 | 10.5m | 437k |
| Czech Republic | 24 | 10.2m | 425k |
| Belgium | 24 | 10.1m | 420k |
| Hungary | 24 | 10m | 416k |
| Sweden | 19 | 9m | 473k |
| Austria | 18 | 8.2m | 455k |
| Denmark | 14 | 5.4m | 385k |
| Slovakia | 14 | 5.3m | 378k |
| Finland | 14 | 5.2m | 370k |
| Ireland | 13 | 3.9m | 300k |
| Lithuania | 13 | 3.6m | 277k |
| Latvia | 9 | 2.3m | 255k |
| Slovenia | 7 | 2m | 285k |
| Estonia | 6 | 1.3m | 216k |
| Cyprus | 6 | 780k | 130k |
| Luxembourg | 6 | 440k | 73k |
| Malta | 5 | 400k | 80k |


