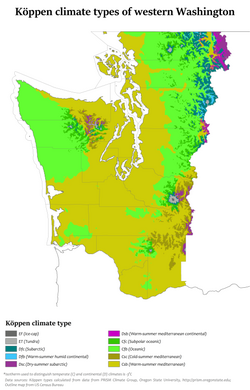
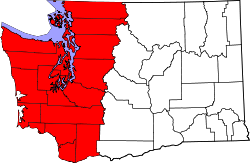
West Washington is a region of the United States defined as the part of Washington state that lies west of the main ridge of the Cascade Range . In this region lies the largest city in the state, Seattle ; most of the state's residents live here. The climate is generally much more humid and temperate than that of eastern Washington .
The region is part of the Pacific Northwest . It borders British Columbia in the north, western Oregon in the south, the Pacific in the west and the Cascade Range or East Washington in the east. The main drainage basins are those of the Columbia River and Puget Sound
climate The region is known for the significantly more humid climate than in the eastern part of the state, which is mainly due to the rain shadow effect of the Cascade Range. The average annual rainfall in East Washington is 468.7 millimeters. In the average location in West Washington, however, the annual rainfall is 1,677.2 millimeters. It rains there 168 days a year. The place with the highest rainfall is Lake Quinault on the Olympic Peninsula with an average annual rainfall of 3,329.2 millimeters. The place with the most precipitation days is the Long Beach Experimental Station
Statistics for locations of Threaded Station Extremes
Olympia. Washington Climate diagram
Climate data for the Olympia Regional Airport. Washington (normal values 1981-2010. Extreme 1948-today)
Jan
Feb
Mar
Apr
May
Jun
Jul
Aug
Sep
Oct
Nov
Dec
Max. Temperature ( ° C )
17.78
22.78
26.11
31.11
35.56
36.67
40.00
40.00
36.67
32.22
23.33
17.78
O
30th
Min. Temperature (° C)
-22.22
-18.33
-12.78
-5.00
-3.89
-1.11
1.67
0.56
-3.89
-10.00
-18.33
-21.67
O
−9.5
Temperature (° C)
4.33
5.03
6.94
9.06
12.33
15.06
17.67
17.83
14.94
10.19
6.28
3.56
O
10.3
Precipitation ( mm )
199.14
133.86
134.37
89.92
59.18
44.70
16.00
23.88
43.43
116.84
219.20
189.48
Σ
1,270
Rainy days ( d )
20th
15th
18th
15th
12
9
4th
4th
7th
14th
20th
19th
Σ
157
T
Jan
Feb
Mar
Apr
May
Jun
Jul
Aug
Sep
Oct
Nov
Dec
N
199.14
133.86
134.37
89.92
59.18
44.70
16.00
23.88
43.43
116.84
219.20
189.48
Jan
Feb
Mar
Apr
May
Jun
Jul
Aug
Sep
Oct
Nov
Dec
Source: NOAA
Portland, Oregon Climate diagram
Portland, Oregon ( PDX ), (normal values 1981-2010, extremes 1940-today)
Jan
Feb
Mar
Apr
May
Jun
Jul
Aug
Sep
Oct
Nov
Dec
Max. Temperature ( ° C )
18.89
21.67
26.67
32.22
37.78
38.89
41.67
41.67
40.56
33.33
22.78
18.33
O
31.3
Min. Temperature (° C)
-18.89
-19.44
-7.22
-1.67
-1.67
3.89
6.11
6.67
1.11
-3.33
-10.56
-14.44
O
−4.9
Temperature (° C)
5.22
6.56
8.97
11.25
14.61
17.53
20.67
20.86
18.03
12.72
8.14
4.67
O
12.5
Precipitation ( mm )
123.95
92.96
93.47
69.34
62.74
43.18
16.51
17.02
37.34
76.20
143.00
139.45
Σ
915.16
Rainy days ( d )
18th
14th
17th
16
13
9
4th
3
6th
12
19th
18th
Σ
149
T
Jan
Feb
Mar
Apr
May
Jun
Jul
Aug
Sep
Oct
Nov
Dec
N
123.95
92.96
93.47
69.34
62.74
43.18
16.51
17.02
37.34
76.20
143.00
139.45
Jan
Feb
Mar
Apr
May
Jun
Jul
Aug
Sep
Oct
Nov
Dec
Source: NOAA
Quillayute Airport, Washington Climate diagram
Quillayute Airport, Washington (normal values 1981-2010, extremes 1966-today)
Jan
Feb
Mar
Apr
May
Jun
Jul
Aug
Sep
Oct
Nov
Dec
Max. Temperature ( ° C )
20.56
22.78
22.78
28.89
33.33
33.33
36.11
37.22
36.11
28.33
20.56
17.78
O
28.2
Min. Temperature (° C)
-13.89
-11.67
-7.22
-5.00
-1.67
0.56
3.33
2.22
-2.22
-5.00
-15.00
-13.89
O
−5.7
Temperature (° C)
5.31
5.64
6.72
8.17
10.72
12.94
14.97
15.31
13.64
10.00
6.78
4.64
O
9.6
Precipitation ( mm )
371.09
262.89
275.08
199.39
129.79
88.90
50.29
63.25
97.03
266.45
394.21
329.95
Σ
2,528.32
Rainy days ( d )
22nd
18th
21st
19th
16
14th
10
8th
10
18th
22nd
22nd
Σ
200
T
Jan
Feb
Mar
Apr
May
Jun
Jul
Aug
Sep
Oct
Nov
Dec
N
371.09
262.89
275.08
199.39
129.79
88.90
50.29
63.25
97.03
266.45
394.21
329.95
Jan
Feb
Mar
Apr
May
Jun
Jul
Aug
Sep
Oct
Nov
Dec
Source: NOAA
Jan
Feb
Mar
Apr
May
Jun
Jul
Aug
Sep
Oct
Nov
Dec
Max. Temperature ( ° C )
19.44
21.11
25.56
31.67
33.89
36.67
39.44
37.22
36.67
31.67
23.33
18.89
O
29.7
Min. Temperature (° C)
-17.78
-17.22
-11.67
-1.67
-2.22
3.33
6.11
6.67
1.67
-2.22
-14.44
-14.44
O
−5.3
Temperature (° C)
5.58
6.33
8.06
10.19
13.33
16.06
18.72
18.94
16.28
11.53
7.47
4.81
O
11.5
Precipitation ( mm )
141.48
88.90
94.49
68.83
49.28
39.88
17.78
22.35
38.10
88.39
166.88
135.89
Σ
952.25
Rainy days ( d )
18th
14th
16
14th
12
9
5
4th
7th
13
18th
17th
Σ
147
T
Jan
Feb
Mar
Apr
May
Jun
Jul
Aug
Sep
Oct
Nov
Dec
N
141.48
88.90
94.49
68.83
49.28
39.88
17.78
22.35
38.10
88.39
166.88
135.89
Jan
Feb
Mar
Apr
May
Jun
Jul
Aug
Sep
Oct
Nov
Dec
Source: NOAA
Demographics As of the 2010 United States Census , West Washington had 5,229,486 residents out of a total of 6,724,540 in the state. The population is comparable to that of Minnesota (5,303,925 inhabitants). With an area of 64,080 km², the population density is 81.61 per square kilometer.
Counties
Most important cities
Individual evidence
↑ a b http://www.wrcc.dri.edu/summary/Climsmwa.html Western Regional Climate Data Center website
↑ a b http://www.wrcc.dri.edu/htmlfiles/wa/wa.01.html Western Regional Climate Data Center, Days of Precipitation
↑ QUINAULT RS, WASHINGTON - Climate Summary dri.edu . Retrieved June 20, 2015.
^ Station name: WA OLYMPIA AP
↑ WMO Climate Normals for OLYMPIA. WA 1961–1990
↑ NowData - NOAA Online Weather Data . National Oceanic and Atmospheric Administration . Retrieved April 11, 2016.
↑ Station Name: OR PORTLAND INTL AP
↑ WMO Climate Normals for PORTLAND OR 1961–1990
↑ NOWData - NOAA Online Weather Data National Oceanic and Atmospheric Administration . Retrieved April 12, 2016.
↑ Station Name: WA Quillayute STATE AP
↑ WMO Climate Normals for QUILLAYUTE STATE AP, WA 1961–1990
↑ NowData - NOAA Online Weather Data National Oceanic and Atmospheric Administration . Retrieved September 5, 2016.
↑ Station Name: WA SEATTLE TACOMA INTL AP
^ WMO Climate Normals for Seattle / Seattle – Tacoma INTL A, WA 1961–1990
^ Washington population by county - Census 2010: Washington - The Spokesman-Review spokesman.com . Retrieved June 20, 2015.
↑ a b See List of States in the United States by Population for the most up-to-date population figures.
^ US Census Bureau for Washington
48 -122 Coordinates: 48 ° 0 ′ N , 122 ° 0 ′ W
<img src="https://de.wikipedia.org//de.wikipedia.org/wiki/Special:CentralAutoLogin/start?type=1x1" alt="" title="" width="1" height="1" style="border: none; position: absolute;">

