Folk election 2015
The 2015 Folketing election was the 68th election to the Danish Folketing Parliament . It was scheduled by Prime Minister Helle Thorning-Schmidt on May 27, 2015 and took place on June 18, 2015. In this case, the red bloc around the minority government of the Social Democrats lost its majority in the Folketing. After the election, Thorning-Schmidt resigned as prime minister and party leader. At the same time, the task of forming a government fell to the blue block around Lars Løkke Rasmussen from the right-wing liberal party Venstre . The fact that the Danish People's Party around Kristian Thulesen Dahl received more votes than Venstre came as a surprise to some media.
Starting position
In the 2011 folk elections , the liberal Venstre around Prime Minister Lars Løkke Rasmussen was able to expand its position as the strongest party. The Social Democrats , up until then the largest opposition party, had to accept the worst result in their history with Helle Thorning-Schmidt as the top candidate. The Danish People's Party (DF), the Socialist People's Party (SF) and the Conservative People's Party also recorded losses. The winners of the election were the Social Liberals (RV), the Red-Green Unity List (EL) and the Liberal Alliance (LA). The Christian Democrats clearly missed entry into parliament. Helle Thorning-Schmidt was able to form a three-party coalition of its social democrats with social liberals and the Socialist People's Party, which was tolerated by the unified list ( Helle Thorning-Schmidt I government ).
On January 30, 2014, the SF left the existing coalition. As a result, Thorning-Schmidt formed a new minority government with the social liberals; this was still tolerated by the red-green unit list and the SF.
In the European elections in Denmark in 2014 , the Danish People's Party gained more than ten percentage points and became the strongest party in a national election for the first time in its history, while Venstre, Social Democrats, Socialists and Conservatives suffered losses. The Folkebevægelsen mod EU , supported by the red-green unity list , the Social Liberals and the Liberal Alliance, in contrast to the Danish People's Party, could only benefit moderately from the losses of the other parties.
Poll results in the election year
Shortly before the election, the polling institutes saw the social democrats at around 25-26 percent, slightly above their last result in the 2011 Folketing election the red-green unit list predicts an improvement in its results. The new alternative party , which split off from the Social Liberal Party at the end of 2013, was predicted to enter parliament with five percent.
The liberal Venstre was predicted to drop from 26.7 to 19-21 percent. In return, the Danish People's Party was only slightly behind the Liberals and thus clearly above its last result. The Liberal Alliance was predicted to gain significantly, while the Conservatives were predicted to undercut the 2011 result by three to four percent. An entry of the Christian Democrats was considered extremely unlikely.
Immediately before the election, the blue alliance of Venstre, People's Party, Liberal Alliance, Conservatives and Christian Democrats was mostly on a par with the red alliance of Social Democrats, Social Liberals, Socialists, Red-Greens and Alternative. In the last polls before the election, both achieved 49–51 percent, whereby a majority in favor of the conservative-liberal bloc seemed somewhat more likely.
Accompanying parties
- Top candidates of the Danish parties for the Folketing election
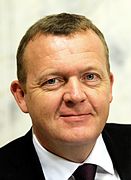
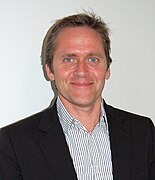
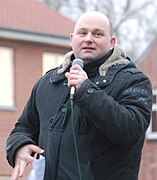
Johanne Schmidt-Nielsen (with election committee) (Ø)
Anders Samuelsen (I)
Uffe Elbæk (Å)
Stig Grenov (K)
For the Danish letter designations, see party letters .
Denmark
- Venstre (V) - Lars Løkke Rasmussen
- Social Democrats (A) - Helle Thorning-Schmidt
- Dansk Folkeparti (O) - Kristian Thulesen Dahl
- Det radical Venstre (B) - Morten Østergaard
- Socialistisk Folkeparti (F) - Pia Olsen Dyhr
- Enhedslisten - de rød-grønne (Ø) - electoral committee
- Liberal Alliance (I) - Anders Samuelsen
- Det Konservative Folkeparti (C) - Søren Pape Poulsen
- Alternative (Å) - Uffe Elbæk
- Kristdemokraterne (K) - Stig Grenov
Faroe Islands
- Sambandsflokkurin (B)
- Javnaðarflokkurin (C)
- Tjóðveldi (E)
- Fólkaflokkurin (A)
- Miðflokkurin (H)
- Sjálvstýrisflokkurin (D)
- Framsókn (F)
Greenland
- Siumut (S)
- Inuit Ataqatigiit (IA)
- Atassut (A)
- Democrats (D)
- Partii Naleraq (PN)
Results
Denmark
The constituencies are divided as follows:
In the three parts of the country (Danish, plural Landsdele ) Zealand-South Denmark ( Sjælland-Syddanmark ), the capital region ( Hovedstaden ) and Central Jutland-North Jutland ( Midtjylland-Nordjylland ) there are a total of ten multi-person constituencies , which are referred to as grand constituencies ( Storkredse ). Initially, 135 constituency mandates ( credit mandates ) are awarded in these . The geographic size of the electoral districts plays a role: the larger an area, the more credit mandates are awarded in it. Thereafter, 40 equalization mandates ( tillægsmandater ) are distributed to the three parts of the country .
The 92 electoral constituencies ( opstillingskredse ) are to be distinguished from the major constituencies . The politicians are on the ballot papers here, but they represent the grand constituencies in the Folketinget . The actual constituencies are therefore the major constituencies, not the electoral constituencies.
Denmark as a whole
Preliminary official result:
| logo | Political party | list | be right | percent | +/-% | Seats | +/- seats |
|---|---|---|---|---|---|---|---|
|
|
Social Democrats Social Democrats |
A. | 924.940 | 26.3 | +1.5 | 47 | +3 |
|
|
Dansk Folkeparti Danish People's Party |
O | 741.746 | 21.1 | +8.8 | 37 | +15 |
|
|
Venstre Liberal Party |
V | 685.188 | 19.5 | −7.2 | 34 | −13 |
|
|
Enhedslisten - de rød-grønne unit list |
O | 274.463 | 7.8 | +1.1 | 14th | +2 |
|
|
Liberal Alliance Liberal Alliance |
I. | 265.129 | 7.5 | +2.5 | 13 | +4 |
|
|
Alternative The alternative |
Å | 168,788 | 4.8 | New | 9 | New |
|
|
Det radical Venstre social liberals |
B. | 161.009 | 4.6 | −4.9 | 8th | −9 |
|
|
Socialistisk Folkeparti Socialist People's Party |
F. | 147,578 | 4.2 | −5.0 | 7th | −9 |
|
|
Det Conservative Folk Party Conservatives |
C. | 118.003 | 3.4 | −1.5 | 6th | −2 |
|
|
Kristendemokraterne Christian |
K | 29,077 | 0.8 | ± 0.0 | 0 | ± 0 |
| Others | 3,066 | 0.1 | 0 | 0 | |||
| Eligible voters | 4,145,321 | ||||||
| Votes cast | 3,560,060 | 85.9 | -1.8 | ||||
| Valid votes or total number | 3,518,987 | 175 | 0 | ||||
Results by region
| A. | Social democrats |
| B. | Radical Venstre |
| C. | Conservative People's Party |
| F. | People's Socialist Party |
| I. | Liberal Alliance |
| K | Christian Democrats |
| O | Danish People's Party |
| V | Venstre |
| O | Red-green unit list |
| Å | alternative |
The following shows the results in the three parts of the country and 10 major electoral districts. What was remarkable about the election was the regionally different voting behavior.
Zealand-Southern Denmark
In Zealand-Southern Denmark, the border region with Germany, the Danish People's Party won a disproportionately high number of votes. With 25.6 percent of the vote, it was only just behind the Social Democrats, who achieved 26.6 percent.
| Greater constituency | Results in percent | ||||||||||
|---|---|---|---|---|---|---|---|---|---|---|---|
| A. | B. | C. | F. | I. | K | O | V | O | Å | Other | |
| South Jutland | 23.5 | 3.1 | 2.2 | 3.0 | 7.5 | 1.1 | 28.4 | 23.5 | 5.1 | 2.6 | 0.0 |
| Funen | 28.9 | 3.4 | 3.5 | 4.4 | 6.5 | 0.4 | 21.8 | 18.2 | 8.5 | 4.5 | 0.0 |
| Zealand | 27.9 | 3.2 | 2.9 | 3.9 | 6.2 | 0.4 | 25.6 | 19.6 | 6.7 | 3.5 | 0.0 |
| Zealand-Southern Denmark | 26.6 | 3.2 | 2.8 | 3.7 | 6.7 | 0.6 | 25.6 | 20.6 | 6.6 | 3.4 | 0.0 |
Central Jutland-North Jutland
In Central and North Jutland, Venstre achieved its best regional result. In West Jutland the party became the locally strongest party with 27.4%.
| Greater constituency | Results in percent | ||||||||||
|---|---|---|---|---|---|---|---|---|---|---|---|
| A. | B. | C. | F. | I. | K | O | V | O | Å | Other | |
| West Jutland | 24.5 | 2.8 | 4.9 | 3.6 | 5.9 | 2.3 | 21.3 | 27.4 | 4.5 | 2.6 | 0.0 |
| North Jutland | 30.0 | 3.1 | 2.7 | 3.3 | 5.9 | 0.9 | 21.9 | 23.2 | 6.1 | 2.8 | 0.0 |
| East Jutland | 27.3 | 4.9 | 2.8 | 4.4 | 8.3 | 1.0 | 18.9 | 18.7 | 7.4 | 6.1 | 0.0 |
| Central Jutland-North Jutland | 26.3 | 4.6 | 3.4 | 4.2 | 7.5 | 0.8 | 21.1 | 19.5 | 7.8 | 4.8 | 0.1 |
Capital region
In the capital region around Copenhagen, red-green and left-wing party groups are traditionally stronger than the national average. The red-green uniform list achieved its national best result in Copenhagen with 16.4% and the Venstre its nationally worst result with 10.3%. The Social Democrats achieved their best result in the country with 33.5% on Bornholm.
| Greater constituency | Results in percent | ||||||||||
|---|---|---|---|---|---|---|---|---|---|---|---|
| A. | B. | C. | F. | I. | K | O | V | O | Å | Other | |
| North Zealand | 22.6 | 6.1 | 5.3 | 3.9 | 11.4 | 0.6 | 18.8 | 20.6 | 6.3 | 4.5 | 0.0 |
| Copenhagen area | 29.1 | 5.4 | 4.5 | 4.7 | 8.4 | 0.4 | 20.1 | 14.8 | 8.2 | 4.4 | 0.0 |
| Copenhagen | 22.3 | 9.4 | 3.1 | 6.5 | 8.8 | 0.4 | 11.4 | 10.3 | 16.4 | 11.2 | 0.0 |
| Bornholm | 33.5 | 1.6 | 1.7 | 2.8 | 4.0 | 2.9 | 19.9 | 20.3 | 8.4 | 5.0 | 0.0 |
| Capital region | 24.6 | 7.1 | 4.1 | 5.2 | 9.2 | 0.5 | 16.2 | 14.7 | 11.0 | 7.2 | 0.1 |
Faroe Islands
| Political party | orientation | list | Overall votes |
percent | +/-% | Seats | +/- seats | Best placed within the list |
Personal voices |
|
|---|---|---|---|---|---|---|---|---|---|---|
|
Tjóðveldi Republican |
secessionist / socialist | E. | 5,730 | 24.5 | +5.2 | 1 | +1 | Høgni Hoydal | 1,477 | |
|
Javnaðarflokkurin Social Democrats |
unionist / social democratic | C. | 5,666 | 24.3 | +3.3 | 1 | ± 0 | Sjúrður Skaale | 2,495 | |
|
Sambandsflokkurin unionists |
unionist / liberal | B. | 5,500 | 23.5 | −7.2 | 0 | −1 | Edmund Joensen | 2,416 | |
|
Fólkaflokkurin People's Party |
secessionist / conservative | A. | 4,368 | 18.7 | −0.3 | 0 | ± 0 | Annika Olsen | 1,754 | |
|
Framsókn progress |
secessionist / liberal | F. | 749 | 3.2 | New | 0 | New | Poul Michelsen | 374 | |
|
Miðflokkurin Center Party |
Christian Democratic | H | 605 | 2.6 | −1.6 | 0 | ± 0 | Jenis av Rana | 258 | |
|
Sjálvstýrisflokkurin self-governing party |
unionist / social liberal | D. | 403 | 1.7 | −0.6 | 0 | ± 0 | Jógvan Skorheim | 297 | |
| Individual applicants | 345 | 1.5 | 0 | ± 0 | Zakarias Wang | 340 | ||||
| Eligible voters | 35,614 | |||||||||
| Votes cast | 23,576 | 65.6 | +6.7 | |||||||
| Valid votes | 23,366 | |||||||||
Source: Faroese Radio . For the division into secessionist and unionist parties, see also Autonomy of the Faroe Islands .
Greenland
| Political party | list | be right | percent | +/-% | Seats | +/- seats | Best placed within the list |
Personal voices |
|---|---|---|---|---|---|---|---|---|
|
Inuit Ataqatigiit Inuit community |
IA | 7,904 | 38.5 | −4.2 | 1 | ± 0 | Aaja Chemnitz Larsen | 2,540 |
|
Siumut forward |
S. | 7,831 | 38.2 | +1.4 | 1 | ± 0 | Aleqa Hammond | 3,745 |
|
Democratic Democrats |
D. | 1,753 | 8.5 | −3.5 | 0 | ± 0 | Randi Vestergaard Evaldsen | 922 |
|
Atassut common sense |
A. | 1,526 | 7.4 | +0.2 | 0 | ± 0 | Steen Lynge | 1,309 |
|
Partii Naleraq Party of the bearing mark |
PN | 962 | 4.7 | New | 0 | New | Per Pilutaq Rosing-Petersen | 869 |
| Eligible voters | 41,048 | |||||||
| Votes cast | 20,514 | 50.0 | -7.4 | |||||
| Valid votes | 19,976 | |||||||
Source: valg.gl / qinersineq.gl
Government formation
The day after the election, Prime Minister Helle Thorning-Schmidt resigned. On June 20, the Queen entrusted the Venstre chairman, Lars Løkke Rasmussen, with forming a government. He initially aimed for a coalition government of all parties in the blue bloc . Since the Danish People's Party, Liberal Alliance and Conservative People's Party did not want to join the government for various reasons, he formed a government that consisted only of members of his Venstre party. The Lars Løkke Rasmussen II government was sworn in on June 28, 2015. In 2017, a so-called "clover leaf government" was formed from Venstre, the Liberal Alliance and the Conservative People's Party, with Løkke remaining Prime Minister.
Individual evidence
- ↑ Officielt: Thorning udskriver valg til June 18 Information, May 27, 2015
- ↑ spiegel.de June 18, 2015: Elections in Denmark: right-wing populists triumph
- ^ Coalition broken - government wants to continue Frankfurter Allgemeine online, January 30, 2014
- ↑ SF forlader regeringen Danmarks Radio, January 30, 2014
- ↑ Polls on the election of people , electograph.com
- ↑ Folketingsvalg torsdag June 18, 2015: Resultater - Valgaften - Hele lands , Danmarks Statistics, June 19, 2015
- ↑ Valg 2015. June 19, 2015, accessed June 20, 2015 (Danish).
- ↑ Fólkatingsval 18 June 2015 ( Memento of 19 June 2015 in the Internet Archive ), Faroese radio, June 19, 2015.
- ↑ Folketingsvalg 2015 , Qinersineq, June 21, 2015.


