
Air pressure
The air pressure at any point in the earth's atmosphere is the hydrostatic pressure of the air that prevails at that location. This pressure is created (illustrated) by the weight of the air column that stands on the earth's surface or on a body . The mean air pressure of the atmosphere (the “atmospheric pressure”) at sea level is, according to the standard, 101 325 Pa = 101.325 kPa = 1 013.25 hPa ≈ 1 bar .


overview
The earth's atmosphere has a mass of around 5 · 10 18 kg, so on every square meter of the earth's surface (around 5 · 10 8 km 2 or 5 · 10 14 m 2 ) there is a load of around 10,000 kg. The pressure (“force per area”) is around 10 5 N / m 2 at sea level . When ascending to higher altitudes you leave part of the air column below you - especially the one with the greater air density , because the density, like the air pressure, decreases with increasing altitude. Thus, the weight of a lower air mass acts, so the air pressure decreases in the way described by the barometric altitude formula .
The mass of the air column (at medium air pressure) corresponds very precisely to that of a ten meter high water column. So if you dive 10 m deep in fresh water at sea level, you cause twice the air pressure in your lungs, i.e. about 2 bar . In this immersion example, the pressure increase is linear, i.e. twice the depth (3 bar) there was twice the water pressure, since water, in contrast to air, is almost incompressible .
Humans have no sense organ to perceive air pressure. Only rapid and sufficiently strong air pressure fluctuations (elevator, cable car, tunnel passage, airplane take-off / landing) can be perceived as a feeling of pressure in the ear if the ventilation channel of the middle ear, the Eustachi tube , remains closed during the pressure change. If there is a pressure difference between the middle ear and its surroundings, this is equalized as soon as the eustachian tube opens (can be provoked, for example, by chewing and swallowing).
The weight of the air that a body displaces causes the static buoyancy , which is why the weighing value deviates from the actual mass. This must be taken into account when precisely determining a mass with the aid of a scale . The weight of the displaced air and thus also the lift depend on the air pressure.
units
The unit used internationally (SI-unit) of the air pressure is the Pascal ( unit symbol Pa) or the legally permissible also in Germany and Austria unit Bar (unit symbol bar, 1 bar = 10 5 Pa). The exact integer decadic ratio of the SI unit pascal and the non-SI unit bar results from the fact that both are defined using SI units. Instead of the inappropriately small unit Pascal, the air pressure is usually given with the SI prefix hecto in hectopascal (hPa), at sea level around 1000 hPa, or with the same numerical value in millibars (mbar).
The barometers used to measure air pressure often show outdated units. In the case of mercury barometers in particular, only a millimeter scale is attached to determine the air pressure in Torr (1 Torr corresponds to 1 mm of mercury). The standard pressure of 1013.25 hPa is equal to 760 Torr.
Another unit in the context of air pressure is the atmosphere, whereby these old units such as physical atmosphere , technical atmosphere : atmosphere absolute pressure, atmosphere positive pressure or atmosphere negative pressure are no longer permissible according to the unit law.
Variability and extreme values
The mean air pressure of the earth's atmosphere at sea level is 1013.25 hPa and is therefore part of normal conditions as well as many standard conditions .
Decrease with height

The air pressure decreases with altitude - at sea level by about 1 hPa every 8 meters. An exact mathematical description of the pressure curve is not possible due to the weather dynamics and other influencing factors. With a standard atmosphere (15 ° C at sea level with p 0 = 101,325 Pa), the air pressure p for the altitude above sea level H and with H 0 = 8435 m can be approximated using the barometric altitude formula . For a density of air at 0 ° C (also at sea level), H 0 = 7990m≈8km. The exponential function

therefore only gives an approximation of the real air pressure conditions. It is based on the (false) assumption that the temperature remains constant when the altitude changes, it does not take into account the decrease in gravitational acceleration with altitude and assumes a constant composition of the air. Nevertheless, barometric altimeters that use this formula allow an altitude indication with an accuracy of ± 10 m within a few hours and over a few hundred meters in stable weather conditions. This simplified formula results in the rule of thumb "decrease by 1% every 80 m or by 10% every 840 m" and the following air pressure:
| height | Air pressure (compared to 0 m height) |
Air pressure |
|---|---|---|
| –425 m Dead Sea |
105.6% | 1070.1 hPa |
| -300 m | 103.9% | 1053.0 hPa |
| -200 m | 102.6% | 1039.6 hPa |
| -100 m | 101.3% | 1026.3 hPa |
| 0 m | 100% | 1013.25 hPa |
| 100 m | 98.7% | 1000.3 hPa |
| 200 m | 97.5% | 987.6 hPa |
| 300 m | 96.2% | 975.0 hPa |
| 400 m | 95.0% | 962.5 hPa |
| 500 m | 93.8% | 950.3 hPa |
| 600 m | 92.6% | 938.1 hPa |
| 700 m | 91.4% | 926.2 hPa |
| 800 m | 90.2% | 914.4 hPa |
| 900 m | 89.1% | 902.7 hPa |
| 1000 m | 88.0% | 891.2 hPa |
| 1500 m | 82.5% | 835.8 hPa |
| 2000 m | 77.4% | 783.8 hPa |
| 2241 m | 75% | 759.9 hPa |
| 2500 m | 72.5% | 735.1 hPa |
| 2962 m Zugspitze |
68.4% | 692.80 hPa |
| 3000 m | 68.0% | 689.4 hPa |
| 3500 m | 63.8% | 646.5 hPa |
| 3798 m Grossglockner |
61.4% | 622.8 hPa |
| 4000 m | 59.8% | 606.3 hPa |
| 4810 m Mont Blanc |
53.9% | 546.52 hPa |
| 5000 m | 52.6% | 533.3 hPa |
| 5400 m | 50% | 506.6 hPa |
| 6000 m | 46.3% | 469.0 hPa |
| 7000 m | 40.7% | 412.5 hPa |
| 8000 m | 35.8% | 362.8 hPa |
| 8848 m Mount Everest |
32.1% | 325.4 hPa |
| 10 km | 27.7% | 280.7 hPa |
| 13 km cruising altitude |
18.9% | 191.0 hPa |
| 17.9 km | 10% | 101.3 hPa |
| 20 km | 7.7% | 77.8 hPa |
| 35.9 km of radiosondes |
1 % | 10.1 hPa |
| 50 km | 0.16% | 165 Pa |
| 100 km limit to space |
0.00027% | 0.27 Pa |
Daily course

The air pressure is subject to a daily recurring period, which has two maximum and two minimum values per day. It is stimulated by the daily fluctuations in air temperature , which results in a stronger 12-hour rhythm (referred to as semicircadian) and a weaker 24-hour rhythm (circadian). The maxima are found around 10 a.m. and 10 p.m., the minima around 4 a.m. and 4 p.m. ( local time ). The amplitudes depend on the degree of latitude . In the vicinity of the equator , the fluctuations are up to 5 hPa. In the middle latitudes, the fluctuations are around 0.5 to 1 hPa , due to the greater Coriolis force (as the restoring force of the oscillation). Knowledge of the local diurnal air pressure increases the informative value a barogram for assessing the weather, especially in tropical areas. As a rule, however, the course of the day cannot be observed directly, as it is overlaid by dynamic air pressure fluctuations. It is only possible to observe these fluctuations undisturbed if the measuring equipment is sufficiently accurate and the high pressure weather conditions are stable .
Annual cycle
The annual course of air pressure averaged over many years shows a small but also comparatively complex fluctuation between the individual months. In Central Europe, there is a minimum in April, responsible for the term April weather , and comparatively high values for May and September ( Indian summer ).
Background noise
In the background noise there are weak superimpositions of the air pressure, with a typically very low frequency around 0.2 Hz and amplitudes less than 1 Pascal. Such microbaromas are the result of weather phenomena or stormy seas. The bursting of a meteor, the bang of a supersonic flight or an (atomic) bomb explosion also cause pressure waves that can still be detected very far away.
Air pressure records
The historical global minimum value of air pressure at sea level is 870 hPa (estimated on October 12, 1979 in Typhoon Tip near Guam on the Northwest Pacific). Another source even speaks of 856 hPa in September 1958 during a typhoon near Okinawa, but the “Digital Typhoon Archive” does not record an air pressure for that month or for the whole of 1958 that comes close to this value.
The greatest drop in air pressure measured to date within 24 hours on the Atlantic was measured in October 2005 in Hurricane Wilma with 98 hPa. The core pressure fell to 882 hPa. At Typhoon Forrest in September 1983 in the northwestern Pacific, a pressure drop of 100 hPa was measured within a good 23 hours.
The highest air pressure values measured so far and reduced to sea level were 1084.8 hPa in Tosontsengel (Mongolia, 1723 m above sea level) on December 19, 2001 for stations above 750 m and 1083.8 hPa on December 31, 1968 at Lake Agata ( Siberia , 66.88 ° N / 93.47 ° E, 262 m above sea level) recorded for stations below 750 m.
The highest air pressure in Germany was measured at 1060.8 hPa on January 23, 1907 in Greifswald , the lowest at 954.4 hPa on November 27, 1983 in Emden .
The mentioned low record value of 870 hPa deviates by 14.1% from the standard pressure of 1013.25 hPa, the maximum of 1084.8 by + 7.1% only half as far.
Experiments and measurement
Otto von Guericke was able to prove the air pressure with the Magdeburg hemispheres in 1663 . These were two half hollow spheres lying close together. As soon as the air between the hollow spheres was evacuated , two teams of horses pulling in opposite directions could no longer separate them.
Another experiment that can also be used for precise measurements is a glass tube that is closed on one side and is more than ten meters long. It is first placed horizontally in a water vessel so that the air can escape. If you set it up with the opening under water and the closed side up, a maximum height is set up to which the water level can be pushed up by the air pressure on the surrounding water surface. This is about ten meters, more at high air pressure and less at low air pressure . In the cavity there is then only water vapor with the vapor pressure of water, at 20 ° C about 23 hPa. This is known as a liquid barometer . Evangelista Torricelli used mercury instead of water , which tears off at a height of 760 mm and also hardly evaporates. Another instrument for measuring air pressure based on this principle is the Goethe barometer .
Today can barometers are mostly used, which contain a so-called Vidie can or a stack of such cans. It is a box-like hollow body made of thin sheet metal, which is connected to a pointer. If the air pressure rises, the can is compressed and the pointer moves. So that the measurement is independent of the temperature , there is a vacuum in the jar, as the air in it would expand when heated. Nevertheless, there are temperature-dependent measurement errors. To keep these small, alloys with a low coefficient of thermal expansion are used.
To measure the unaffected as possible (static) ambient pressure of an aircraft, can be a pitot tube (Prandtlsonde), or - especially for calibration purposes - a of the tip of the tail redrawn trailing cone or a lowered downward drag bomb serve.

Stich Caspar bulkhead to von Guericke hemisphere experiment

Detail of the Luftpumpentaler , the first embossing depicting the attempt at separation
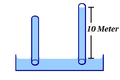
Water column: no more than 10 m high

Principle of the can barometer

.JPG)


meaning
| symbol | description |
|---|---|
|
|
Increasing |
|
|
Rising, then falling slightly |
|
|
Rising, then stable |
|
|
Rising slightly, then falling |
|
|
Stable |
|
|
Falling |
|
|
Falling, then rising slightly |
|
|
Falling then stable |
|
|
Slightly falling or stable, then rising |
meteorology
Regional fluctuations in air pressure play a major role in the development of the weather , which is why air pressure in the form of isobars is also the most important element in weather maps . The air pressure at a firmly defined height in the earth's atmosphere is important for weather forecasting , which is selected so that no disturbances to the pressure from buildings or small-scale terrain are to be expected, i.e. without impairment by friction of the air flow on the ground in the so-called free Atmosphere . A measurement that relates to the height of the earth's surface above sea level (so-called absolute air pressure) would be transferred to the area and reflect the topography of the terrain rather than the actual fluctuations in air pressure. In order to compensate for this and to make the values comparable, a reduction to sea level (so-called relative air pressure) is used. The differences in air pressure there are of particular interest for weather conditions near the ground. They lead to the formation of high and low pressure areas . Due to the air pressure gradient, the wind sets in between them as a compensatory flow .
aviation
Air pressure plays an important role in aviation , since the usual altimeters are basically barometers. The flight altitude of the aircraft is determined by the static air pressure prevailing there using the barometric altitude formula (see air pressure measurement in aviation ). An unexpectedly low local air pressure can simulate an altitude that is too high for the pilot and thus induce a dangerous low flight (motto: "From high to low goes wrong"), therefore the altimeter must read the current air pressure on the ground before and possibly also during a flight can be set.
From a certain transition altitude or transition altitude (s. Main article altitude ) all altimeters be set to the standard pressure of 1013.25 hPa. The display then no longer has a fixed reference to the actual flight altitude, but since the absolute measurement error is the same for all aircraft, the risk of collisions due to different altitude displays is minimized.
The following air pressure specifications are used in aviation:
- QFE : the actual air pressure at the measuring location; an altimeter set to QFE shows the altitude above the measurement location.
- QNH : the recalculated air pressure at sea level and ICAO standard atmosphere (15 ° C, temperature gradient 0.65 ° C / 100 m); an altimeter set to QNH shows the altitude above sea level.
- QFF : the recalculated air pressure at sea level, taking into account the altitude, humidity, temperature and other factors.
The QNH value is predominantly used at airfields, while the QFF value is used in meteorology in order to be able to compare air pressure values at different locations and altitudes.
shipping
Air pressure plays a major role in shipping , as rapid changes in air pressure usually cause rapid changes in weather.
A rapid drop in air pressure means in the majority of cases a risk of strong winds or storms. The importance of the decrease in air pressure per period for a wind forecast, however, depends on the latitude. If the air pressure in moderate latitudes falls by more than 1 to 2 hectopascals in one hour, there is a high probability that strong winds or storms will follow .
Conversely, a strong rise in pressure does not always mean a rapid decrease in wind.
Boiling temperature of water
Since the air pressure decreases with increasing altitude, the boiling point of water also decreases according to the vapor pressure- temperature curve . As a rule of thumb, the boiling point is lowered by about one degree per 300 m. By determining the boiling temperature of pure water, it is possible to estimate the respective altitude above mean sea level . Naturally, the effect is overlaid by the atmospheric pressure that is reduced to sea level. On high mountains, some vegetables cannot be cooked as quickly or at all in boiling pure water - the same applies to boiling eggs, because the proteins have to be exposed to a certain temperature to denature, which may then no longer be reached. The addition of salt can counteract this by significantly increasing the boiling temperature depending on the concentration.
| Air pressure | boiling point |
|---|---|
| 970 hPa | 98.785 ° C |
| 980 hPa | 99.07 ° C |
| 990 hPa | 99.345 ° C |
| 1000 hPa | 99.62 ° C |
| 1010 hPa | 99.895 ° C |
| 1020 hPa | 100.19 ° C |
| 1030 hPa | 100.465 ° C |
| 1040 hPa | 100.76 ° C |
| 1050 hPa | 101.035 ° C |
literature
- Wolfgang Weischet: General climate geography . 3. Edition. de Gruyter, 1980.
- Wilhelm Kuttler: climatology . 2nd Edition. Schöningh, Paderborn 2009.
Web links
Individual evidence
- ↑ Horst Malberg: Meteorology and climatology: An introduction . 5th edition. Springer, Berlin, Heidelberg 2007.
- ↑ Half-day pressure wave in April 2005 - Hamburg weather mast ( Memento from December 18, 2014 in the Internet Archive ).
- ↑ Max Margules : Air movements in a rotating spheroid shell . Imperial and Royal Court and State Printing Office, 1893.
- ↑ a b c d e Weather records publication by the DWD
- ↑ a b Karl Horau: Supertyphoon Forrest (September 1983): The Overlooked Record Holder of Intensification in 24, 36, and 48 h. (PDF) American Meteorological Society, June 2000, accessed January 22, 2010 .
- ↑ a b Katja Bammel, Angelika Fallert-Müller, Ulrich Kilian, Sabine Klonk: The Brockhaus Weather and Climate: Phenomena, Forecast, Climate Change . Brockhaus, Mannheim 2009, ISBN 978-3-7653-3381-1 , p. 200 .
- ↑ Asanobu Kitamotu: Digital Typhoon Typhoon list (1958). National Institute of Informatics NII Japan, accessed January 8, 2016 .
- ^ Wolfgang Weischet: General climate geography . 3. Edition. de Gruyter, 1980.