
Isoline
Isolines (from ancient Greek ἴσος 'equal'), also called isarithms , are lines on which the same value occurs at every point. The best- known example are contour lines ("isohypses") on topographic maps . If you walk along an isoline, the value (for example the height) is neither larger nor smaller, but always remains the same. Isolines are a special case of the level set .
properties
In order to be able to distinguish the lines, a variation of the line shape is used by inserting normal, counting and intermediate lines. This method reaches its limits when it comes to the scale on a map (approx. 1: 1 million as a benchmark). Isodistances (lines connecting points of equal distance), on the other hand, can occur in all scales. The lines are always self-contained or run out towards the edge of the card, with the exception of the lines in between, which are only inserted where they are needed.
The oldest method for obtaining isolines is interpolation. Each isoline indicates a shape. The shape of the object can therefore be reconstructed from the geometry of the family of isolines. When the scale is reduced, the actually continuous surfaces ( continua ) are displayed in fixed steps. For this purpose, the relief is broken down into characteristic steps, whereby interval areas - the area between two isolines - are used.
The representation of isolines and the interval areas between them is carried out by means of professionally proven color signatures. Representation by means of grids is rarely used today, but is and was used more frequently in black and white representations. The low values are often assigned dark, saturated colors or low gray values. The representation of several areas is not possible or only with difficulty due to the resulting overlay.
If the isoline is used to look at the change in a certain quantity according to a parameter, it is given the prefix Isallo . If you want to express the constancy of an averaged value, you use the shortened prefix Is instead of Iso .
Contour diagram

A contour diagram or contour diagram is a two-dimensional representation of a bivariate function with the variables and . The function value at the point is made clear by a contour line or coloring.


The drawing on the right illustrates the one-dimensional process. Above, the function is plotted as a function of . Only the x-axis is drawn below . The function value is indicated by height points with numerical information, whereby the points have been lengthened to vertical lines for better representation. In addition, the value of was coded as a gray value. The steeper the function, the closer the contour lines are.

2D examples:
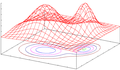
Function f (x, y) drawn in perspective with projection of the contour diagram onto the xy plane
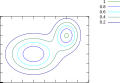
Undistorted contour plot

Contour diagram with highlighted colors to identify the isolines


Pseudo-lines
As Pseudoisolinien refers to the application of Isolinienverfahrens to data that no continua, but Diskreta describe. Discrete are “stepped” surfaces that represent a value, there are no transitions between the values.
In principle, the isoline method is reserved for continuums, since interpolations occur in the construction that do not actually exist in nature, but are nevertheless within the range of the possible range of values, such as the 800 m isohypse, which is not actually visible, but still occurs in nature.
Pseudo-lines make use of this method and apply them to statistical values (surfaces) that are not continuums, but rather discrete ones (e.g. population density, the value is a material-surface relation, i.e. the mean value applies to the entire area ) and therefore, strictly speaking, must not be subjected to any interpolation.
In 1855 the first map with pseudo-lines was created (the term "isoplets" was previously only used for population density), it was heavily criticized and after a short period of euphoria the method was forgotten again. With the advent of modern software packages, it came back into focus and is now the subject of research.
Isolines in space
If you are dealing with data in three-dimensional space, the isolines become isosurfaces , i.e. surfaces that connect neighboring points with the same characteristics or values. In dimensions larger than three, such structures are then referred to as “n-dimensional isosurfaces”. Such structures make no sense in dimensions smaller than two.
Relationship between isopotentials and field lines
Especially in the case of electrical, magnetic and gravitational fields, in addition to the isolines of the potential , the isopotentials, one also considers the field lines that are always perpendicular to them .
Types of isolines
The following alphabetical list of isolines does not claim to be complete.
| Surname | description |
|---|---|
| Groundwater level | Line of the same groundwater level (also called groundwater isohypse). |
| Isakuste | Line of equal sound strength ( seismology ). |
| Isallobars | Lines of equal air pressure tendency . |
| Isallotherm | Lines of equal temperature tendency . |
| Isamplitude | Lines of equal mean temperature differences between minimum and maximum (for example on an annual basis in the context of climatology ). |
| Isanemone | Lines of equal mean wind speed . |
| Isanomal | Lines of equal deviation from the earth's magnetic field . |
| Isapostilbe | Lines of equal average coalification . |
| Isenthalpe | Lines of equal enthalpy . |
| Isentropes | Lines of equal entropy / potential temperature . |
| Isoazimuth line | Same azimuth line ( navigation ) |
| Isobars | Lines of the same pressure or, especially in meteorology, also the same air pressure . |
| Isobase | Line of equal uplift ( tectonics ) |
| Isobath | Line of equal water depth ; In geology, isolines that show the depth of an area (e.g. the base or roof area of a formation ) in the subsurface are called isobaths. |
| Isobronte | Lines that connect all places where the first clap of thunder occurs at the same time . Isobronts are important for recording the development and displacement of a thunderstorm focus . |
| Isocandela | Lines of equal light intensity ( lighting technology ). |
| Isochione | Lines with the same number of days with snowfall , the same snow cover duration or the same height of the snow line . |
| Isochore | Lines of the same volume or specific volume in a thermodynamic state diagram . |
| Isochronous | Lines of the same duration or the same beginning of an event. |
| Isodapane | Lines of equal transport costs for all products in Weber's industrial location model. The critical isodapane is obtained by offsetting isotimes. Outside these lines, production sites are no longer profitable. |
| Isodense | Lines of equal density , especially air density . |
| Isodiabates | Lines equal heat flow . |
| Isodose | Lines of equal absorbed dose . |
| Isodrosotherms | Lines connecting equal dew point temperatures. |
| Isogams | Lines that connect places of equal weight. |
| Isogloss | In linguistics, isoglosses are used to map the boundaries between different pronunciation forms or grammatical forms when moving from one dialect to another. |
| Isogons | In meteorology , isogons are lines of the same wind direction . |
| Isogons | In geophysics , isogons are the lines of equal values of the terrestrial magnetic declination . |
| Isohaline | Lines of equal salinity (ocean). |
| Isohelia | Lines of equal mean sunshine duration . |
| Isohumids | Lines of equal relative humidity . |
| Isohyete | Lines of equal precipitation . |
| Isohygromenes | Lines of equal number of arid or humid months (reference: climatology). |
| Isohypse | Lines of the same geographic height (contour line). In meteorology , this term is used in particular for lines of the same geopotential height (also isopotentials). The geopotential height, like the geographic one, also has the sea level as a reference level. |
| Isocatabase | Lines of equal depression . |
| Isoclinic | Lines of equal inclination ( inclination ): in geophysics the magnetic inclination , in mathematics the slope of a function |
| Isoconce | Lines of equal substance concentration . |
| Isocost line | Lines of equal production costs . |
| Isoluxe | Lines of equal brightness , also isophotes - see Isolux diagram . |
| Isomes | Lines of equal monthly mean air temperature . |
| Isonephe | Lines of equal cloud cover . |
| Isoombre | Lines of equal evaporation . |
| Isopache | Lines of equal thickness in a geological layer . |
| Isophanes | Lines of equal beginning or equal duration of phenological phases . |
| Isophones | Lines of equal noise exposure ( acoustics ). |
| Isophotes | Lines of equal brightness , also Isoluxe. |
| Isoplethe | Lines with the same numerical value of a size that depends on two further parameters. There are, for example, thermoisopleths, i.e. lines of the same temperature in a thermoisopleth diagram , whose ordinate is the time of day and whose abscissa is the month. |
| Isopotentials | Lines of equal potential; often also called equipotential lines . In meteorology, they are often referred to simply as isohypses. |
| Isopykne | Lines of equal density e.g. B. Air tightness , water tightness . |
| Isoquant | Lines equal outputs . |
| Isorrhachia | Lines of simultaneous flood entry . |
| Isoseiste | Lines of equal (location-dependent) intensity of an earthquake . |
| Isosteres | Lines with the same degree of coverage of the adsorbent of an adsorption refrigerator . |
| Isotache | Lines of equal speed (usually wind or flow speed ). |
| Isothere | Lines of equal average summer temperature. |
| isotherm | Lines of equal temperature . |
| Isotime | Lines of equal transport costs for individual products in Weber's industrial location model. |
| Isovapore | Lines of equal saturation vapor pressure . |
| Zero kline | Zero growth isolines in ordinary differential equation , see phase space . |
Web links
- Structure and nature of contour maps . ( Memento from September 30, 2007 in the Internet Archive ) geoWEB Magazin - Institute for Geography and Spatial Research, Graz