
Dhemaji (District)
| Dhemaji District | |
|---|---|

|
|
| State | Assam |
| Administrative headquarters : | Dhemaji |
| Area : | 3237 km² |
| Residents : | 686,133 (2011) |
| Population density : | 212 inhabitants / km² |
| Website : | www.dhemaji.gov.in |

Dhemaji is a district in the east of the Indian state of Assam . The administrative seat is the city of the same name Dhemaji .
location
The district is located in northeast India north of the Brahmaputra . It borders in the north on the Indian state of Arunachal Pradesh , in the east on the district Tinsukia , in the south on the district Dibrugarh and in the west on the district Lakhimpur .
geography
The district belongs to the areas with a temperate climate with temperatures between 8 and 35 degrees. The annual 3000 mm of rain mainly comes from the northeast monsoon. The Brahmaputra is the most important river in the district. It is also responsible for the frequent flooding in the valley area.
history
The area belonged to the Kingdom of Pragjiyotishpur in the 7th and 8th centuries and then to the Kingdom of Pal. Most of the time, dynasties belonging to Hinduism ruled over the next few centuries. The Kingdom of Ahom was the most important of these states and ruled the area from 1228 to 1826. In recent years, however, as a subject of the Burmese. Since 1792 the British East India Company tried to establish itself in the area. With the Treaty of Yandabo after the First British-Burmese War , the area came under British rule in 1826 (until 1947). After that, it shared the fate of the Lakhimpur district. The current district was created in 1989 from parts of the Lakhimpur district.
population
According to the 2011 census, the Dhemaji district has 686,133 inhabitants. With 212 inhabitants per square kilometer, the district is densely populated. The district is still predominantly rural. Of the 686,133 residents, 637,848 people (92.96%) live in rural areas and 48,285 people in urban communities.
The Dhemaji District is one of the areas of India that are populated in large numbers by members of the "tribal population" ( scheduled tribes ). Among them were (2011) 325,560 people (47.45 percent of the district population). There are 44,225 Dalits ( scheduled castes , 6.45 percent of the district population) in the district.
The majority of the population is made up of people who were born in the district. Of the residents, 587,224 people (85.58 percent of residents) were born in the district. A total of 10,107 people were born in other Indian states (including 2,876 people in Bihar, 2,095 people in Arunachal Pradesh, 1,685 people in West Bengal, 999 people in Uttar Pradesh, 891 in Tripura and 463 people in Meghalaya). Of the 1,871 foreign-born people, 1,056 are from Bangladesh, 391 from Nepal and 186 from Pakistan.
Population development
As everywhere in India, the population in the Dhemaji District has been growing rapidly for decades. The increase in the years 2001–2011 was 20 percent (19.97%). In these ten years the population increased by around 114,000 people. The following table illustrates the development:

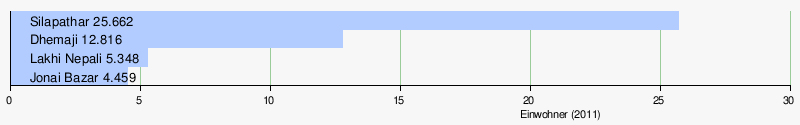
Significant places
In the district there are two places with more than 10,000 inhabitants with the district capital Dhemaji and Silapathar. There are also two other places that are considered cities (notified towns).
District population by gender
As is common in India, the district always had more male than female residents. But until 1971 the male surplus was above average, even by Indian standards. Among the youngest residents (104,247 people under 7 years of age), the proportions are 53,457 men (51.28 percent) to 50,790 people (48.72 percent) women.
| Distribution of the population by gender in Dhemaji District | ||||||||||||||
| 1961 census | 1971 census | 1981 census | 1991 census | 2001 census | 2011 census | |||||||||
| number | proportion of | number | proportion of | number | proportion of | number | proportion of | number | proportion of | number | proportion of | |||
| TOTAL | 113,439 | 100% | 230,762 | 100% | - | - | 478.830 | 100% | 571,944 | 100% | 686.133 | 100% | ||
| Men | 60,240 | 53.10% | 123.119 | 53.35% | - | - | 248.457 | 51.89% | 294,643 | 51.52% | 351.249 | 51.19% | ||
| Women | 53,199 | 46.90% | 107,643 | 46.65% | - | - | 230.373 | 48.11% | 277,301 | 48.48% | 334.884 | 48.81% | ||
District population by language
Various Tibetan Burman languages are spoken among the tribal population . The official language is Assamese , the main language of Assam. The population in Dhemaji District is very linguistically mixed. But around 94 percent of the population use one of the five main languages.
At Zilla Dhakuakhana, 15,827 people (53.51 percent of the population) speak Assami, 11,971 people (40.48 percent of the population) Miri / Mishing and 940 people (3.18 percent of the population) speak Nepali.
At Zilla Dhemaji, 106,774 people (76.31 percent of the population) speak Assami, 21,512 people (15.37 percent of the population) Miri / Mishing and 4,884 people (3.49 percent of the population) speak Bengali.
At Zilla Gogamukh, 44,431 people (44.99 percent of the population) speak Assami, 25,332 people (25.65 percent of the population) Miri / Mishing 9,869 people (9.99 percent of the population) Bodo / Boro, 5,723 people (5.79 percent) of the population) Nepali, 5,191 people (5.26 percent of the population) Bengali, 2,810 people (2.85 percent of the population) Deori, 1,288 people (1.30 percent of the population) Hindi, and 1,146 people (1.16 percent of the population ) Santali.
At Zilla Jonai, 83,499 people (49.15 percent of the population) speak Miri / Mishing, 29,746 people (17.51 percent of the population) Assami, 26,643 people (15.68 percent of the population) Bodo / Boro, 10,113 people (5.95 Percent of the population) Nepali, 8,348 people (4.91 percent of the population) Bengali, 2,601 people (1.53 percent of the population) Hindi, and 2,104 people (1.24 percent of the population) Bhojpuri.
At Zilla Sissibargaon, 75,547 people (32.28 percent of the population) speak Miri / Mishing, 68,767 people (29.38 percent of the population) Assami, 16,574 people (7.08 percent of the population) Nepali, 7,356 people (3.14 percent of the Population) Bodo / Boro and 4,879 people (2.08 percent of the population) Hindi.
At Zilla Subansiri, 5,343 people (38.30 percent of the population) speak Miri / Mishing, 3,275 people (23.48 percent of the population) Assami, 1,765 people (12.65 percent of the population) Haijong / Hajong, 1,314 people (9.42 Percent of the population) Bodo / Boro and 961 people (6.89 percent of the population) Nepali.
The most widely spoken languages are shown in the following table:
| year | Assami | Miri / Mishing | Bengali | Bodo / Boro | Nepali | Hindi | Bhojpuri | Deori | Total | |||||||||
|---|---|---|---|---|---|---|---|---|---|---|---|---|---|---|---|---|---|---|
| number | % | number | % | number | % | number | % | number | % | number | % | number | % | number | % | number | % | |
| 2011 | 268,820 | 39.18 | 223.204 | 32.53 | 67,250 | 9.80 | 47,529 | 6.93 | 36,058 | 5.26 | 10,230 | 1.49 | 6,041 | 0.88 | 5,872 | 0.86 | 686.133 | 100.00% |
| Source: 2011 census result | ||||||||||||||||||
Population of the district by confession
A clear majority of over 95 percent of the population are Hindus. Smaller minorities are the Muslims and the Christians.
The Muslims and Christians are limited to three of the six zillas. At Zilla Gogamukh, 2,071 people (2.10 percent of the population) are Christians and 1,284 people (1.30 percent of the population) are Muslims, at Zilla Jonai 6,770 people (3.98 percent of the population) are Muslims and 3,148 people (1.85 Percent of the population) Christians and in Zilla Sissibargaon 4,618 people (1.97 percent of the population) are Muslims and 2,235 people (0.96 percent of the population) are Christians.
All other religious communities are only very small minorities and often consist of people from other regions of India. The following table shows the exact religious composition of the population:
| year | Buddhists | Christians | Hindus | Jainas | Muslims | Sikhs | Other | not specified | Total | |||||||||
|---|---|---|---|---|---|---|---|---|---|---|---|---|---|---|---|---|---|---|
| number | % | number | % | number | % | number | % | number | % | number | % | number | % | number | % | number | % | |
| 2011 | 911 | 0.13 | 8,711 | 1.27 | 655.052 | 95.47 | 167 | 0.02 | 13,475 | 1.96 | 297 | 0.04 | 6.315 | 0.92 | 1,205 | 0.18 | 686.133 | 100.00% |
| Source: 2011 census result | ||||||||||||||||||
education
Thanks to significant efforts, literacy has risen sharply in recent decades. In urban areas, over 84 percent can read and write. In the countryside, on the other hand, it is only around seven out of ten people. The strong differences between the sexes and the urban / rural population are typical of Indian conditions.
| Literacy in Dhemaji District | ||||||
| unit | 2011 census | |||||
| number | proportion of | |||||
| TOTAL | 423.028 | 72.70% | ||||
| Men | 237.761 | 79.84% | ||||
| Women | 185.267 | 65.21% | ||||
| TOTAL CITY | 35,616 | 84.02% | ||||
| City men | 19,379 | 88.42% | ||||
| City women | 16,237 | 79.31% | ||||
| TOTAL COUNTRY | 387.412 | 71.81% | ||||
| Country men | 218,382 | 79.16% | ||||
| Country women | 169.030 | 64.12% | ||||
| Source: 2011 census result | ||||||
Administrative division
The district was divided into six zillas (circles) at the last census in 2011.
| Population in the Zillas | ||||||||||||||
| Dhakuakhana (Pt) | Dhemaji | Gogamukh | Jonai | Sissibargaon | Subansiri (Pt) | |||||||||
| number | proportion of | number | proportion of | number | proportion of | number | proportion of | number | proportion of | number | proportion of | |||
| TOTAL | 29,575 | 100% | 139.920 | 100% | 98,760 | 100% | 169,898 | 100% | 234.030 | 100% | 13,950 | 100% | ||
| Men | 14,825 | 50.13% | 71.111 | 50.82% | 49,642 | 50.27% | 87,234 | 51.34% | 121.198 | 51.79% | 7,239 | 51.89% | ||
| Women | 14,750 | 49.87% | 68,809 | 49.18% | 49,118 | 49.73% | 82,664 | 48.66% | 112,832 | 48.21% | 6.711 | 48.11% | ||
| city | 0 | 0% | 12,816 | 9.16% | 0 | 0% | 9,807 | 5.77% | 25,662 | 10.97% | 0 | 0% | ||
| country | 29,575 | 100% | 127.104 | 90.84% | 97.760 | 100% | 160.091 | 94.23% | 208,368 | 89.03% | 13,950 | 100% | ||
economy
The agriculture is the predominant source of income for most residents. The main crops are rice, mustard seed, potatoes and legumes. The main farm animals are pigs and goats.
Web links
Individual evidence
- ↑ Dhemaji District: Census 2011 data
- ↑ A - 2 DECADAL VARIATION IN POPULATION SINCE 1901
- ^ Result of the 2011 census on city population
- ^ District Census Handbook for Dhemaji

Baksa | Barpeta | Biswanath | Bongaigaon | Cachar | Chirang | Charaideo | Darrang | Dhemaji | Dhubri | Dibrugarh | Dima Hasao | Goalpara | Golaghat | Hailakandi | Hojai | Jorhat | Kamrup | Kamrup Metropolitan | Karbi Anglong | Karimganj | Kokrajhar | Lakhimpur | Majuli | Marigaon | Nagaon | Nalbari | Sivasagar | Sonitpur | South Salmara-Mankachar | Tinsukia | Udalguri | West Karbi Anglong