Presidential election in the United States 1880
| ‹ 1876 • |
|||||||||||
| 24. Presidential election | |||||||||||
| November 2, 1880 | |||||||||||
|
|
|||||||||||
| Republican Party | |||||||||||
| James Garfield / Chester Arthur | |||||||||||
| electors | 214 | ||||||||||
| be right | 4,446,158 | ||||||||||
|
|
48.3% | ||||||||||
| Democratic Party | |||||||||||
| Winfield Hancock / William English | |||||||||||
| electors | 155 | ||||||||||
| be right | 4,444,260 | ||||||||||
|
|
48.2% | ||||||||||
|
|
|||||||||||
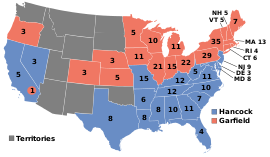
| Election results by state | |||||||||||

|
|||||||||||
|
19 states
Garfield / Arthur |
19 states
Hancock / English |
||||||||||
|
|
|||||||||||
| President of the United States | |||||||||||
The 1880 presidential election in the United States was largely viewed as a referendum on the republican "détente and reconstruction effort" in the southern states.
In order to keep the promise he made during the 1876 campaign, President Rutherford B. Hayes did not stand for re-election. The Republican Party chose James A. Garfield as its candidate; his running mate was Chester A. Arthur . The Democrats nominated Civil War general Winfield Scott Hancock and William Hayden English as the vice-presidential candidate . They missed their goal of winning several northern states and thus gaining a majority. Although Garfield only had 2,000 more votes than Hancock, he was appointed president thanks to his clear lead on the electoral body . To date, apart from the five cases (most recently in 2016 ) in which the elected president received fewer votes, it is the narrowest popular vote victory in American history.
Result

| candidate | Political party | be right | electors | |
|---|---|---|---|---|
| number | percent | |||
| James A. Garfield | republican | 4,446,158 | 48.27% | 214 |
| Winfield S. Hancock | democrat | 4,444,260 | 48.25% | 155 |
| James B. Weaver | Greenback | 305.997 | 3.32% | 0 |
| Neal S. Dow | Prohibitionist | 10.305 | 0.11% | 0 |
| John W. Phelps | Know nothing | 707 | 0.01% | 0 |
| total | 9,211,058 | 100% | 369 | |
Despite the narrow margin of 2,000 votes (0.02 percent), James Garfield managed to get a clear majority in the Electoral College. He achieved this, among other things, by winning in the so-called Swing States : In New York and Connecticut , the gap between Garfield and Winfield S. Hancock was less than two percent. These two states were still able to win the Democrats in the elections in 1876.
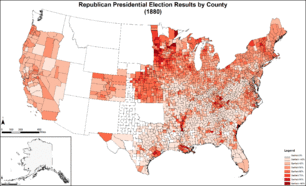
Moreover reached James B. Weaver of the Greenback Party still a relatively good result. He was able to achieve more than ten percent of the votes in Iowa and Texas and also achieved a relative or absolute majority of the votes in some counties. The candidates for the Prohibition Party and the Know-Nothing Party remained basically insignificant and nowhere did they achieve a share of more than 0.4 percent of the vote.
Results in the states
The following table lists the results of the three top-voting candidates (in percent) in each state.
| Country | Garfield | Hancock | Weaver | electors |
|---|---|---|---|---|
| Alabama | 37.1 | 60.0 | 2.9 | 10 |
| Arkansas | 38.7 | 56.1 | 3.8 | 6th |
| Colorado | 51.3 | 46.0 | 2.7 | 3 |
| Connecticut | 50.5 | 48.5 | 0.7 | 6th |
| Delaware | 48.0 | 51.5 | 0.4 | 3 |
| Florida | 45.8 | 54.2 | - | 4th |
| Georgia | 34.6 | 65.4 | - | 11 |
| Illinois | 51.1 | 44.6 | 4.2 | 21st |
| Indiana | 49.3 | 47.9 | 2.8 | 15th |
| Iowa | 57.0 | 32.8 | 10.0 | 11 |
| California | 48.9 | 49.0 | 2.1 | 6th |
| Kansas | 60.4 | 29.7 | 9.9 | 5 |
| Kentucky | 39.9 | 55.7 | 4.3 | 12 |
| Louisiana | 37.3 | 62.3 | 0.4 | 8th |
| Maine | 51.5 | 45.3 | 3.1 | 7th |
| Maryland | 45.6 | 54.4 | - | 8th |
| Massachusetts | 58.5 | 39.6 | - | 13 |
| Michigan | 52.5 | 37.3 | 9.9 | 11 |
| Minnesota | 62.3 | 35.4 | 2.2 | 5 |
| Mississippi | 29.8 | 64.7 | 5.0 | 8th |
| Missouri | 38.7 | 52.5 | 8.8 | 15th |
| Nebraska | 62.9 | 32.6 | 4.5 | 3 |
| Nevada | 47.6 | 57.7 | - | 3 |
| New Hampshire | 51.9 | 47.2 | 0.6 | 5 |
| New Jersey | 49.0 | 49.8 | 1.1 | 9 |
| new York | 50.3 | 48.2 | 1.1 | 35 |
| North Carolina | 48.0 | 51.6 | 0.5 | 10 |
| Ohio | 51.7 | 47.0 | 0.9 | 22nd |
| Oregon | 50.5 | 48.9 | 0.6 | 3 |
| Pennsylvania | 50.8 | 46.6 | 0.4 | 29 |
| Rhode Island | 62.2 | 36.9 | 0.8 | 3 |
| South carolina | 34.1 | 65.5 | 0.3 | 7th |
| Tennessee | 44.3 | 53.3 | 2.5 | 12 |
| Texas | 24.0 | 64.7 | 11.3 | 8th |
| Vermont | 69.8 | 28.2 | 1.9 | 5 |
| Virginia | 39.5 | 60.5 | - | 11 |
| West Virginia | 41.1 | 51.0 | 8.0 | 5 |
| Wisconsin | 54.0 | 42.9 | 3.0 | 10 |
| total | 48.3 | 48.2 | 3.3 | 369 |
- Results of the candidates in the counties
literature
- Donald Richard Deskins, Hanes Walton, Sherman C. Puckett: Presidential Elections, 1789-2008: County, State, and National Mapping of Election Data. University of Michigan, Ann Arbor 2010, ISBN 978-0-472-11697-3 , pp. 219-228 (= Chapter 26: James A. Garfield's Election. ).
Web links
Individual evidence
- ↑ In Electoral College , Hancock received five votes, Garfield one


