from Wikipedia, the free encyclopedia
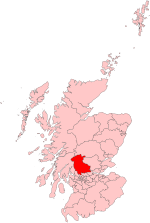
Stirling is a constituency for the British House of Commons . It was formed in the course of constituency reform in 1983 from the dissolved constituencies of Clackmannan and Eastern Stirlingshire and Stirling and Clackmannan Western . Since 2005 the constituency has covered the entire area of the Stirling Council Area . The constituency sends a representative.
Election results
General election 1983
General election 1987
General election 1992
General election 1997
General election 2001
General election 2005
General election 2010
General election 2015
General election 2017
General election 2019
Individual evidence
-
↑ UK Parliamentary General Election Results 2019 on the Council Area Administration website, accessed February 4, 2020.
-
^ Map of the constituency
-
↑ Results of the parliamentary elections in 1983 ( Memento of the original from October 6, 2014 in the Internet Archive ) Info: The archive link was inserted automatically and has not yet been checked. Please check the original and archive link according to the instructions and then remove this notice.
 @1@ 2Template: Webachiv / IABot / www.politicsresources.net
-
^ Results of the general election in 1987
-
^ Results of the general election in 1992
-
↑ a b Results of the 1997 and 2001 general election
-
^ Results of the general election 2005
-
↑ Results of the 2010 general election ( Memento of the original from May 2, 2015 in the Internet Archive ) Info: The archive link was inserted automatically and has not yet been checked. Please check the original and archive link according to the instructions and then remove this notice.
 @1@ 2Template: Webachiv / IABot / www.politicsresources.net
-
↑ a b c Results of the 2015, 2017 and 2019 general election on the BBC website , accessed February 4, 2020
Scottish lower house constituencies as of 2005
Aberdeen North |
Aberdeen South |
Airdrie and Shotts |
Angus |
Argyll and Bute |
Ayr, Carrick and Cumnock |
Banff and Buchan |
Berwickshire, Roxburgh and Selkirk |
Caithness, Sutherland and Easter Ross |
Central Ayrshire |
Coatbridge, Chryston and Bellshill |
Cumbernauld, Kilsyth and Kirkintilloch East |
Dumfries and Galloway |
Dumfriesshire, Clydesdale and Tweeddale |
Dundee East |
Dundee West |
Dunfermline and West Fife |
East Dunbartonshire |
East Kilbride, Strathaven and Lesmahagow |
East Lothian |
East Renfrewshire |
Edinburgh East |
Edinburgh North and Leith |
Edinburgh South |
Edinburgh South West |
Edinburgh West |
Falkirk |
Glasgow Central |
Glasgow East |
Glasgow North |
Glasgow North East |
Glasgow North West |
Glasgow South |
Glasgow South West |
Glenrothes |
Gordon |
Inverclyde |
Inverness, Nairn, Badenoch and Strathspey |
Kilmarnock and Loudoun |
Kirkcaldy and Cowdenbeath |
Lanark and Hamilton East |
Linlithgow and East Falkirk |
Livingston |
Midlothian |
Moray |
Motherwell and Wishaw |
Na h-Eileanan to Iar |
North Ayrshire and Arran |
North East Fife |
Ochil and South Perthshire |
Orkney and Shetland |
Paisley and Renfrewshire North |
Paisley and Renfrewshire South |
Perth and North Perthshire |
Ross, Skye and Lochaber |
Rutherglen and Hamilton West |
Stirling |
West Aberdeenshire and Kincardine |
West Dunbartonshire

