
Radiation exposure from the Fukushima nuclear accidents
The radiation exposure from the Fukushima nuclear accidents is an essential part of the Fukushima nuclear disaster .
From March 12, 2011, a series of catastrophic accidents occurred at the Japanese nuclear power plant in Fukushima Daiichi . Some of the radioactive substances, which are produced in large quantities in nuclear reactors , were released - volatile substances already through the targeted pressure relief of the reactors, particles mainly through explosions and fires and water-soluble substances through makeshift cooling measures. There was considerable environmental pollution on the mainland - especially in the prefectures of Fukushima and Ibaraki - and in the nearby Pacific Ocean .
The emissions into the atmosphere and into the sea persist, albeit to an order of magnitude less than during the first few weeks.
With sensitive measuring devices, traces of the radioactive particles from Fukushima can be detected worldwide.
Measurands
radioactivity
By measuring the energy spectrum of the radiation from a sample, it is possible to determine which radioactive substance, for example 131 I or 137 Cs , contributes how much to the radiation. In relation to the mass or volume of the sample, the specific activity results in Becquerel per kilogram (Bq / kg) or Becquerel per liter (Bq / l). One becquerel means one core decay per second.
Specifying the specific activity of a certain isotope , for example 1000 Bq / kg 131 I, is equivalent to specifying a concentration of this isotope in the sample. Specific activities of different isotopes only give comparable concentration data multiplied by the respective half-lives. With the same activity, the amount of substance of 136 Cs (half-life 13 days) is almost 1000 times smaller than that of 137 Cs (half-life 30 years).
Radiation dose
The equivalent dose (dose weighted according to biological effect) of ionizing radiation ( alpha , beta and gamma radiation ) that the human body absorbs is measured in Sievert , or in millisievert (mSv, thousandth Sievert) or microsievert (µSv, millionth Sievert) . The radiation dose per period is referred to as the dose rate and is always given in millisieverts per hour (mSv / h) below. If it occurs at a certain location, one speaks of the local dose rate . For comparison: The natural radiation to which a person is exposed in Germany has a dose rate in the range of around 0.0001 to 0.0002 millisieverts per hour, and the radiation dose absorbed in a year is around 2 millisieverts.
A physical damage breakfast is medically detectable from a recorded by the human body total dose of 200 to 300 millisieverts. Symptoms of acute radiation sickness can be observed from a total individual dose of 500 millisievert . From an individual total dose of 1000 millisieverts, ten percent of people die within 30 days; an individual total dose of 6000 millisieverts is always fatal without immediate intensive medical treatment ( lethal dose ).
In addition to this direct radiation damage , the risk of cancer (“ stochastic radiation risk ”) increases according to the radiation dose absorbed .
Measurements on the power plant site
Air measurements
Dose rates
During the series of accidents, the operator Tepco regularly published measured radiation values, which were recorded by mobile measuring stations every ten minutes at different points on the power plant site. There are also eight fixed measuring stations along the landside border of the power plant, which were not available for two months after the power failure on March 11th. Instead, the measuring vehicles drove to these and a few other points:
| Measuring point | position | Direction from Block 2 |
Distance to block 2 approx. |
|---|---|---|---|
| Station 1 | Terrain boundary | North | 2.5 km |
| Station 2 | Terrain boundary | North northwest | 2.5 km |
| Station 3 | Terrain boundary | northwest | 1.6 km |
| Station 4 | Terrain boundary | northwest | 1.4 km |
| Station 5 | Terrain boundary | west | 1.3 km |
| Station 6 | Terrain boundary | West southwest | 1.5 km |
| Station 7 | Terrain boundary | southwest | 1.2 km |
| Station 8 | Terrain boundary | south | 1.4 km |
| Vehicle position 1 |
at the administration building | northwest | 0.5 km |
| Vehicle position 2 |
at the sports field | West northwest | 0.9 km |
| Vehicle position 3 |
at the west gate | west | 1.1 km |
| Vehicle position 4 |
in front of the main gate | West southwest | 1.0 km |
The graphic opposite shows the radiation dose rates on the power plant site during the “hot phase” of the series of accidents.
The following table contains a compilation of individual, selected measured values from a longer period.
| Date (2011), local time | Dose rate (in mSv / h) |
place | situation | source |
|---|---|---|---|---|
| March 11, 2:40 pm | 0.00004 | Measuring station 1 to 8 | Normal value just before the earthquake | Tepco |
| March 12, 6:30 am | 0.005 | Measuring station 6 | GRS | |
| March 12, 3:36 pm | up to 1.0 | at block 1 | Explosion in Block 1 | GRS |
| March 12, around 6:30 p.m. | 0.07 | at block 1 | GRS | |
| March 13, 11:13 am | 1.2 | at block 1 | GRS | |
| March 14, 11:44 am | 0.020 | Measuring station 6 | after explosion in block 3 | Tepco |
| March 14, 12:30 | 0.004 | Measuring station 6 | after explosion in block 3 | Tepco |
| March 15, 6:10 am | 966 | at block 2? | after explosion in block 2 | JAIF |
| March 15, around 10 a.m. | 400 | on reactor block 3 | after explosion in block 2 | Tepco |
| March, 15 | 0.6 | Terrain boundary | after explosion in block 2 | BBC |
| March 15, 9:00 am | 11.9 | Main gate | IAEA | |
| March 15, 3:00 p.m. | 0.6 | Main gate | IAEA | |
| March 16 | up to 10 | Power plant site | after fires in block 4 | World / Kyodo News |
| March 16 | stable 1.5 | Main gate | simmering cooling pools | Kyodo News |
| 17. March | 3.6 | after a cooling test with fire trucks | Kyodo News | |
| March 18, 5:00 am | 0.279 | 1 km west of reactor 2 | Kyodo News | |
| March 23 | 500 | Ground floor of Block 2 | Bulletin of the AS | |
| March 25, 10:30 | 0.54 | Main gate | Decrease to 0.205 by 3:30 pm | GRS |
| April 1st | 0.14 | Main gate | NISA | |
| April 18 | 10 to 49 | on the ground floor of reactor building 1 | Measurement with remote controlled robots | JAIF |
| April 18 | 28 to 57 | on the ground floor of reactor building 3 | Measurement with remote controlled robots | JAIF |
Radioactive substances
From March 22 to March 30, 2011 and from April 4, 2011, Tepco also took air samples daily from the western edge of the power plant and published analysis results for the concentrations of radioactive substances on the following day.
The following table shows a selection of the measured values; The concentrations shown separately by Tepco for volatile and particulate substances are added together, since the limit values for workers relate to the total concentration. The fields left correspond to measurements that have not been taken or are not published; "-" stands for "below the detection limit". Some tests were also carried out for 58 Co (read: Cobalt -58) and 95 Zr , but without proof. The information from March could be incorrect, as the same evaluation problems arose here as described below in the “Turbine building” section .
| Sampling | Concentration in Bq / l | |||||||||
|---|---|---|---|---|---|---|---|---|---|---|
| date | place | 131 I. | 134 Cs | 136 Cs | 137 Cs | 105 Ru | 99m Tc | 129 te | 129m Te | 132 te |
| March 22 | Main gate | 1.20 | 0.048 | - | 0.040 | 0.031 | - | - | 0.082 | |
| 26th of March | Main gate | 0.56 | 0.03 | 0.0062 | 0.025 | 0.06 | - | 52 | - | 0.16 |
| March 30 | West gate | 0.60 | 0.072 | 0.0069 | 0.070 | 0.0030 | 63 | 0.27 | 0.083 | |
| April 6th | West gate | 0.27 | 0.0093 | 0.0077 | ||||||
| April 13th | West gate | 0.21 | 0.023 | 0.037 | ||||||
| 20th of April | West gate | 0.10 | 0.023 | 0.026 | ||||||
| Limit for workers in the power plant |
1 | 2 | 10 | 3 | 80 | 700 | 400 | 4th | 7th | |
Water measurements
Cooling pool
Tepco published the following analyzes of the water in the decay basins of the reactor blocks , including old comparative values (nuclides that cannot be detected are marked with "-"). In blocks 1 and 2 the water was taken from the skimmer surge tank , in blocks 3 and 4 directly from the basin.
| Date of sampling |
Block 1 (Bq / l) | ||
|---|---|---|---|
| 137 Cs | 134 Cs | 131 I. | |
| February 11, 2011 | 78 | - | - |
| June 22, 2011 | 14,000,000 | 12,000,000 | 68,000 |
| August 19, 2011 | 23,000,000 | 18,000,000 | - |
| Date of sampling |
Block 2 (Bq / l) | ||
|---|---|---|---|
| 137 Cs | 134 Cs | 131 I. | |
| February 10, 2011 | 280 | - | - |
| April 16, 2011 | 150,000,000 | 160,000,000 | 4,100,000 |
| August 19, 2011 | 110,000,000 | 110,000,000 | - |
| Date of sampling |
Block 3 (Bq / l) | ||
|---|---|---|---|
| 137 Cs | 134 Cs | 131 I. | |
| March 2, 2011 | - | - | - |
| May 8, 2011 | 150,000,000 | 140,000,000 | 11,000,000 |
| July 7, 2011 | 110,000,000 | 94,000,000 | - |
| August 19, 2011 | 87,000,000 | 74,000,000 | - |
| Date of sampling |
Block 4 (Bq / l) | ||
|---|---|---|---|
| 137 Cs | 134 Cs | 131 I. | |
| March 4, 2011 | 130 | - | - |
| April 12, 2011 | 93,000 | 88,000 | 220,000 |
| April 28, 2011 | 55,000 | 49,000 | 27,000 |
| May 7, 2011 | 67,000 | 56,000 | 16,000 |
| August 20, 2011 | 61,000 | 44,000 | - |
Tepco published the following measured values for the central cooling pool :
| Date of sampling |
central cooling pool (Bq / l) | ||
|---|---|---|---|
| 137 Cs | 134 Cs | 131 I. | |
| February 10, 2011 | - | - | - |
| May 14, 2011 | 1,200 | 170 | - |
In units 2 to 4, it was initially assumed that the fuel elements were damaged. Later official investigations assume that the increased measured values in all cases resulted from the entry of reactor emissions into the basin.
Turbine building
From March 25th, Tepco published measured values from the basement of the turbine buildings in blocks 1 to 4, where highly contaminated water had accumulated. On March 24th, Tepco had already measured radiation emissions from the surface of the accumulated water of 200 millisieverts per hour (mSv / h) in Block 1, but this was only published on March 26th. The water depth in Block 1 was 0.4 meters; in blocks 2 to 4 it was 1 meter, 1.5 meters and 0.8 meters.
| nuclide | Concentration ( Bq / l) |
|---|---|
| 38 Cl | 1,600,000,000 |
| 74 As | 390,000 |
| 91 Y | 52,000,000 |
| 131 I. | 210,000,000 |
| 134 Cs | 160,000,000 |
| 136 Cs | 17,000,000 |
| 137 Cs | 1,800,000,000 |
| 140 La | 340,000 |
| Old, partly incorrect Block 1 measured values from March 24th |
|
For block 2, Tepco reported over 1000 mSv / h, for block 4 750 mSv / h and for block 1 now only 60 mSv / h (1000 mSv / h was the upper limit of the existing measuring devices). There was excitement about a sample of the water standing in the turbine building of reactor 2. It was taken on the morning of March 26th and analyzed for radionuclides ten hours later. The spectacular result: an activity ten million times the normal in the primary circuit, mainly caused by 134 I with a specific activity of 2.9 billion Bq / l. This physically impossible result - the half-life of 134 I is only 53 minutes - was recognized the next day as a misinterpretation of the measurement. The renewed evaluation, a renewed measurement of the sample at noon and a further sample measured in the evening consistently gave the plausible result "not detectable" for the very short-lived isotopes 134 I, 56 Co and 108m Ag. The original results for 131 I, 134 Cs, 136 Cs, and 137 Cs were confirmed. The total activity was "only" 100,000 times the normal value.
The Japanese nuclear regulatory authority (NISA) warned Tepco strongly because of the irregularities in the measurements. Tepco explained that the reason for this was incorrect use of the evaluation software for the analyzes.
Later, Tepco publishes the following, recalculated measured values for blocks 1 to 4 ("-" = not detectable; with date of sampling):
| nuclide | Concentration (Bq / l) | |||||
|---|---|---|---|---|---|---|
| Block 1 | Block 2 | Block 3 | Block 4 | |||
| 26th of March | 27th of March | March 24th | April 22 | March 24th | April 21 | |
| 131 I. | 150,000,000 | 13,000,000,000 | 1,200,000,000 | 660,000,000 | 360,000 | 4,300,000 |
| 132 I. | - | - | - | - | 13,000 | - |
| 134 Cs | 120,000,000 | 3,100,000,000 | 180,000,000 | 1,500,000,000 | 31,000 | 7,800,000 |
| 136 Cs | 11,000,000 | 320,000,000 | 23,000,000 | 44,000,000 | 3,700 | 240,000 |
| 137 Cs | 130,000,000 | 3,000,000,000 | 180,000,000 | 1,600,000,000 | 32,000 | 8,100,000 |
| 140 Ba | - | 680,000,000 | 52,000,000 | 96,000,000 | - | 600,000 |
| 140 La | - | 340,000,000 | 9,100,000 | 93,000,000 | 410 | 480,000 |
| 99 mo | - | - | - | - | 1,000 | - |
| 99m Tc | - | - | 2,000,000 | - | 650 | - |
| 129m Te | - | - | - | - | 13,000 | - |
| 132 te | - | - | - | - | 14,000 | - |
Drainage shafts
For March 30th, Tepco published the following analysis results of water that had collected in drainage shafts next to the turbine buildings (no measured values were published for block 4; - = not detectable):
| March 30 | Concentration in Bq / l | |||||
|---|---|---|---|---|---|---|
| nuclide | Block 1 | Block 2 | Block 3 | Block 5 | Block 6 | |
| 131 I. | 430,000 | 80,000 | 22,000 | 1,600 | 20,000 | |
| 132 I. | 8,300 | - | 13,000 | - | 580 | |
| 134 Cs | 5,200 | 700 | 10,000 | 250 | 4,700 | |
| 136 Cs | 390 | 65 | 940 | 27 | 390 | |
| 137 Cs | 5,900 | 630 | 10,000 | 270 | 4,900 | |
| 140 La | 330 | - | 73 | - | 41 | |
| 95 Nb | - | 36 | - | - | - | |
| 129 te | 1,200,000 | - | - | - | 81,000 | |
| 129m Te | 8,700 | 1,700 | - | - | 1,300 | |
| 132 te | 3,000 | 390 | 540 | 100 | 600 | |
Up to April 13th, the nuclide concentrations in turbine buildings 1 and 2 increased significantly:
| April 13th | Concentration in Bq / l | |||||
|---|---|---|---|---|---|---|
| nuclide | Block 1 | Block 2 | Block 3 | Block 4 | Block 5 | Block 6 |
| 131 I. | 400,000 | 610,000 | 3,600 | 17,000 | 160 | 190 |
| 134 Cs | 53,000 | 7,900 | 2,400 | 2,700 | 270 | 260 |
| 137 Cs | 60,000 | 9,100 | 2,400 | 2,700 | 280 | 280 |
The remaining isotope concentrations were no longer published from April 13th.
| April 25 | Concentration in Bq / l | |||||
|---|---|---|---|---|---|---|
| nuclide | Block 1 | Block 2 | Block 3 | Block 4 | Block 5 | Block 6 |
| 131 I. | 130,000 | 610,000 | 20,000 | 93 | 130 | 380 |
| 134 Cs | 55,000 | 33,000 | 3,900 | 120 | 250 | 330 |
| 137 Cs | 64,000 | 37,000 | 4,200 | 130 | 310 | 390 |
| May 6th | Concentration in Bq / l | |||||
|---|---|---|---|---|---|---|
| nuclide | Block 1 | Block 2 | Block 3 | Block 4 | Block 5 | Block 6 |
| 131 I. | 7,100 | 140,000 | 5,800 | 16 | 15th | 40 |
| 134 Cs | 14,000 | 15,000 | 900 | 62 | - | 49 |
| 137 Cs | 17,000 | 18,000 | 950 | 49 | 22nd | 69 |
| May 13th | Concentration in Bq / l | |||||
|---|---|---|---|---|---|---|
| nuclide | Block 1 | Block 2 | Block 3 | Block 4 | Block 5 | Block 6 |
| 131 I. | 25,000 | 54,000 | 63 | 160 | - | 14th |
| 134 Cs | 48,000 | 18,000 | 260 | 150 | - | 28 |
| 137 Cs | 57,000 | 21,000 | 250 | 170 | - | 33 |
| 25. May | Concentration in Bq / l | |||||
|---|---|---|---|---|---|---|
| nuclide | Block 1 | Block 2 | Block 3 | Block 4 | Block 5 | Block 6 |
| 131 I. | 300 | 17,000 | 14th | - | - | - |
| 134 Cs | 5,700 | 17,000 | 160 | 21st | - | 13 |
| 137 Cs | 6,600 | 21,000 | 160 | 27 | - | 17th |
| 3rd of June | Concentration in Bq / l | |||||
|---|---|---|---|---|---|---|
| nuclide | Block 1 | Block 2 | Block 3 | Block 4 | Block 5 | Block 6 |
| 131 I. | 1,600 | 1,800 | 1,700 | 230 | - | - |
| 134 Cs | 27,000 | 9,600 | 870 | 160 | - | - |
| 137 Cs | 33,000 | 12,000 | 950 | 170 | - | - |
| 11./18. July | Concentration in Bq / l | |||||
|---|---|---|---|---|---|---|
| nuclide | Block 2 | Block 3 | Block 5 | |||
| 238 Pu | - | - | - | |||
| 239 pu, 240 pu | - | - | - | |||
Sea water channels
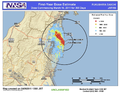
On April 1st, Tepco measured a concentration of 131 I up in the seawater channel of Block 1 (see graphic, point 3) , which exceeded the legal limit values by 10,000 times, and described this value as "extremely high". Usually the concentration of radionuclides at this point is so low that it cannot be detected.
On April 2, 2011, Tepco measured a dose rate of over 1000 mSv / h in a cable duct near the water inlet for reactor block 2 (see graphic, area 7). Here, too, there was water with a 131 I activity that was 10,000 times higher than the legal limit values and which leaked into the sea.
In the next few days and weeks, Tepco measured the following concentrations of radionuclides in the water inlet of Block 2 (the 134 Cs concentrations were almost identical to those of 137 Cs). The table also shows the activity ratio of 131 I and 137 Cs. An increase could indicate an increased activity in the reactor or a successful filtering of the cesium by zeolites (see below).
| Date sample extraction |
Readings for 137 Cs | Measured values for 131 I. | Ratio 131 I / 137 Cs |
source | ||
|---|---|---|---|---|---|---|
| Concentration (Bq / l) |
relative to the limit |
Concentration (Bq / l) |
relative to the limit |
|||
| 2nd of April | 300,000,000 | 7,500,000 | Kyodo News | |||
| 3rd of April | 36,000,000 | 410,000 | 79,000,000 | 2,000,000 | 2.2 | Tepco |
| 4. April | 96,000,000 | 1,100,000 | 200,000,000 | 5,000,000 | 2.1 | Tepco |
| April 5th | Begin attempts to close the leak with a glass of water | |||||
| April 5th | 5,500,000 | 61,000 | 11,000,000 | 280,000 | 2.0 | Tepco |
| April 6, 7:40 am | 3,200,000 | 36,000 | 5,600,000 | 140,000 | 1.8 | Tepco |
| April 6, 9:30 am | The leak was closed with a glass of water. | |||||
| 7th of April | 1,500,000 | 17,000 | 2,500,000 | 63,000 | 1.7 | Tepco |
| April 8th | 630,000 | 7,000 | 930,000 | 23,000 | 1.5 | Tepco |
| 10th of April | 110,000 | 1,200 | 130,000 | 3,300 | 1.2 | Tepco |
| 12. April | 84,000 | 930 | 100,000 | 2,500 | 1.2 | Tepco |
| April 14, 7:30 am | 33,000 | 370 | 42,000 | 1,100 | 1.3 | Tepco |
| April 14, 12:30 | A silt curtain in front of the water inlets of blocks 1 and 2 is being completed. The runoff of the contaminated water into the sea is contained. | |||||
| April 15th | Three bags of 100 kg of zeolites are deposited at the water inlet of block 2 in order to bind parts of the cesium. | |||||
| April 15th | 130,000 | 1,400 | 260,000 | 6,500 | 2.0 | Tepco |
| April 16 | 92,000 | 1,000 | 240,000 | 6,000 | 2.6 | Tepco |
| 17th April | Another seven bags of zeolites will be deposited at the water inlet of Block 2. | |||||
| April 19th | 24,000 | 270 | 47,000 | 1,200 | 1.5 | Tepco |
| April 24th | 21,000 | 230 | 29,000 | 730 | 1.4 | Tepco |
| April 28 | 21,000 | 230 | 120,000 | 3,000 | 5.7 | Tepco |
| April, 30th | 7,300 | 81 | 130,000 | 3,300 | 17.8 | Tepco |
| 2.May | 5,600 | 62 | 230,000 | 5,800 | 41.1 | Tepco |
| May 4th | 4,200 | 47 | 33,000 | 830 | 7.9 | Tepco |
| May 6th | 3,400 | 38 | 9,800 | 250 | 2.9 | Tepco |
| 8th of May | 5,100 | 57 | 5,600 | 140 | 1.1 | Tepco |
| 10th of May | 5,000 | 56 | 6,700 | 170 | 1.3 | Tepco |
Blocks 1 and 2 form a structural unit. There are connections through which the water can get from one block to the other. Therefore, the radionuclides measured at Unit 2 could also come from reactor 1.
Groundwater
From April 8, 2011, Tepco published measured values of the water in a well or shaft ( “deep well” ) on the western edge of the power plant site at irregular intervals . It was not stated whether the opening was covered or whether contamination from the air was possible. The groundwater in the area of the power plant flows into the Pacific (see The Ghijben-Herzberg equation ), i.e. from west to east. Values without indication (-) were not detectable.
| Date of sampling |
Concentration (Bq / l) | ||
|---|---|---|---|
| 131 I. | 134 Cs | 137 Cs | |
| April 6th | 79 | 24 | 33 |
| April 13th | - | - | - |
| 17th April | 15th | - | - |
| April 18 | 8th | 8th | - |
| 20th of April | - | - | - |
| April 22 | - | 7th | - |
| April 25 | - | - | - |
| legal limit: | 40 | 60 | 90 |
In 23 further measurements from April 27 to June 17, 2011, no more radionuclides were detected in the water of the well.
On June 19, 2013, Tepco admitted that the groundwater near the turbine building of reactor 2 had high levels of the radionuclides strontium 90 and tritium . The values for strontium 90 would be more than thirty times the maximum permissible value; Tritium was found in eight times higher concentration than permissible.
According to the TEPCO announcement of July 9, 2013, the cesium-134 exposure increased to 9000 Becquerel per liter. The permissible limit is 60 Becquerel.
Soil samples
- plutonium
On March 28th, Tepco published analysis results of soil samples that had been taken on March 21st and 22nd on the power plant site and subsequently examined for plutonium by independent specialists . Three out of five samples were normal; the other two contained a conspicuously high concentration of plutonium-238 ( 238 Pu), which, according to Tepco, could have been released in the nuclear accidents. The total concentration (sum of 238 Pu, 239 Pu and 240 Pu) in each of the five samples was, according to Tepco, in the range of the usual plutonium concentrations in Japanese soils, caused by the fallout from the above-ground nuclear weapons tests in the past .
On March 25 and 28, Tepco repeated the measurements at the two conspicuous points and at two or one further point. Again the same two points were striking.
The following table shows the results of these three and other measurements at the two conspicuous points (“nn” = not detectable) in comparison with the usual values in Japan. The "Ratio" column shows the activity ratio , not the concentration ratio . The concentration ratio is much lower due to the much shorter half-life of 238 Pu.
| Date sample extraction |
Open space, 500 m west-northwest of Block 1/2 | next to the waste storage facility, 500 m south-southwest of block 1/2 | ||||
|---|---|---|---|---|---|---|
|
238 Pu (Bq / kg) |
239 Pu, 240 Pu (Bq / kg) |
Ratio 238 Pu / 239 Pu, 240 Pu |
238 Pu (Bq / kg) |
239 Pu, 240 Pu (Bq / kg) |
Ratio 238 Pu / 239 Pu, 240 Pu |
|
| 21./22. March | 0.54 ± 0.062 | 0.27 ± 0.042 | 2.0 | 0.18 ± 0.033 | 0.19 ± 0.034 | 0.94 |
| 25th March | 0.14 ± 0.031 | 0.087 ± 0.023 | 1.6 | 0.066 ± 0.020 | nn | - |
| 28th March | 0.26 ± 0.022 | 0.12 ± 0.014 | 2.2 | 0.051 ± 0.008 | 0.026 ± 0.006 | 2.0 |
| March 31 | 0.16 ± 0.031 | nn | - | 0.32 ± 0.040 | nn | - |
| 4. April | 0.21 ± 0.019 | 0.063 ± 0.001 | 3.3 | nn | nn | - |
| 11 April | 0.12 ± 0.012 | 0.059 ± 0.008 | 1.5 | 0.083 ± 0.009 | 0.032 ± 0.006 | 1.5 |
| Comparison value | nn to 0.15 | nn to 4.5 | 0.026 | nn to 0.15 | nn to 4.5 | 0.026 |
- uranium
On March 28, the concentration of 234 U, 235 U and 238 U in both samples was also analyzed. According to Tepco, it was on a natural level.
- strontium
On May 9th, Tepco published strontium readings from soil samples taken on April 18th. The samples came from a depth of five centimeters at three points 500 meters away from reactor blocks 1 and 2. 89 Sr concentrations up to 4,400 Bq / kg and 90 Sr concentrations up to 570 Bq / kg were measured. The latter is 120 times higher than the previous maximum values that were detected in the Fukushima prefecture after above-ground nuclear weapons tests in the 20th century. 89 Sr has a half-life of 50 days.
people
see Radiation exposure and contamination of employees in the power plant
Contamination of the environment
_conduct_a_countermeasure_wash_down_on_the_flight_deck.jpg)
Air measurements
The first evidence of the existence of a "radioactive cloud" was provided by a US aircraft carrier. Between March 13 and 14, 2011, the USS Ronald Reagan passed through a radioactive area a hundred miles off the coast of Japan and was contaminated. The radiation exposure of crew members on deck was around 700 times above normal within one hour.
Later, the continued United States Air Force drones type Northrop Grumman RQ-4 Global Hawk and aircraft type Lockheed U-2 and Boeing C-135 Constant Phoenix one to data from the environment to collect the power plant. Also were Nuclear Emergency Support Team of the Department of Energy of the United States called for support to Japan.

DOE and NNSA drone flights, 17. – 19. March 2011

DOE and NNSA drone flights, March 24, 2011

Drone flight, March 24th and 26th

Drone flight, March 27th and 28th

Drone flight and ground measurements, March 30–3. April
Dose estimation for the first 365 days

Note: The graphics above use millirems per hour (thousandths of a rem per hour; mR / h) as the unit, where 1 mR / h = 0.01 mSv / h. In the dose estimate for the first 365 days, the annual dose is given in mR, where 100 mR = 1 mSv.
Fukushima prefecture
The following table shows a selection of measured values from various sources in the vicinity of the power plant:
| Date (2011) | Dose rate (in mSv / h) |
place | source |
|---|---|---|---|
| March 21st | 0.161 | Namie , 30 km northwest of Fukushima I | Kyodo News |
| March 24th | 0,016- 0,059 | 30–32 km northwest of Fukushima I | IAEA |
| 26th of March | 0.02- 0.1 | approx. 30–40 km northwest of Fukushima I | Greenpeace |
| 26th of March | 0.002 0.006 | Fukushima City , 60 km northwest of Fukushima I. | Greenpeace |
| 27th of March | 0.007 0.010 | Iitate , 40 km northwest of Fukushima I. | Greenpeace |
| March 29 | 0.0735 | 20 km northwest of Fukushima I | MEXT |
| March 29 | 0.043 | 30 km northwest of Fukushima I | MEXT |
| 3rd of April | 0.0003 | 160–650 meters above Kawamata , 47 km northwest of Fukushima I. | Kyodo News |
| April 13th | 0.026 | Namie, 30 km northwest of Fukushima I | Kyodo News |
| April 13th | 0.0021 | Fukushima City, 60 km northwest of Fukushima I. | Kyodo News |
- ↑ a b c Greenpeace emphasized that their measurement results confirmed the measurements of the Japanese authorities.
———
On May 3, 2011, the Japanese government published extensive forecasts and calculations on radioactive contamination from the period from March 11, which it had kept under lock and key until then. The calculations of the cumulative radiation dose for the period from March 12 to April 24 showed particularly high values for areas south and north-west of the power plant. In parts of Futaba and Namie the dose was above 100 mSv; in parts of Ōkuma , Tomioka , Katsurao and Iitate it was over 10 mSv.
Tokyo
The Tokyo Metropolitan Institute of Public Health regularly published readings from Tokyo's Shinjuku district (see graphic). The values were given in micrograys per hour (µGy / h). For the combination of X-ray , beta and gamma radiation measured here (without alpha radiation ), 1 µGy / h = 0.001 mSv / h = 1 µSv / h.
Other prefectures
The following diagrams show the measured local dose rates from different prefectures, from mid-March to mid-April:

Ibaraki , scale 0–15 µSv / h

Miyagi , scale 0–2 µSv / h

Tochigi , scale 0–2 µSv / h

Yamagata , scale 0–1 µSv / h
Rainfall
In late May 2011, the University of Tokyo examined 31 snow samples from seven mountain peaks in Fukushima Prefecture. In 14 of them, the radioactivity was above the legal drinking water limit of 200 Becquerel per kilogram.
food
For comparison: the natural radioactivity of most foods in Germany is in the range of 30 to 200 Bq / kg.
Japan

| |
The Fukushima and Ibaraki prefectures were particularly badly contaminated. |
- March 2011
On March 19, 2011, the IAEA announced readings to the Japanese authorities for radioactive iodine in milk in Fukushima Prefecture and in vegetables in Ibaraki Prefecture. The measurements were carried out between March 16 and 18, 2011. Limit values were exceeded. Up to 1,510 Bq / kg was found in milk on March 16, which is five times the Japanese maximum for placing on the market. The Japanese Ministry of Health began investigating a ban on the sale of food from Fukushima Prefecture.
On March 20, the Japanese Ministry of Health announced that radioactive iodine above the limit values had also been detected in milk in the city of Kawamata in Fukushima prefecture. In addition, contamination of the leafy vegetable Kakina with 137 Cs and 131 I was found in the city of Hitachi , which were above the permissible limit values of 500 and 2,000 Bq / kg, respectively.
On March 21, the Nuclear Emergency Response Headquarters in the Fukushima, Ibaraki, Tochigi and Gunma prefectures issued a suspension of shipment for spinach, kakina and raw milk. The World Health Organization in Geneva said it was "very concerned" about radioactive contamination of food.
The Japanese Ministry of Health issued a ban on the sale and consumption of various vegetables from Fukushima Prefecture and a ban on the sale of fresh raw milk and herbs from Ibaraki Prefecture on March 23.
- April 2011
On April 3, the Ministry of Health for Mushrooms from Iwaki , Fukushima prefecture, reported values of 890 Bq / kg cesium-134 and 3,100 Bq / kg 131 I. These were above the limit values of 500 and 2,000 Bq / kg, respectively. The ministry asked the farmers in Iwaki to stop shipping mushrooms. The sale of shiitake mushrooms from different parts of Fukushima Prefecture was later banned.
On April 4, the Ministry of Health began to differentiate the food sales bans. Only the sale of products from urban areas with high levels of radiation exposure and of products with limit values should remain restricted.
After a higher than legally allowed amount of radioactive cesium was found in sand eels caught in the coastal waters of Ibaraki Prefecture, Ibaraki Prefecture issued a sand eel fishing ban on April 5, 2011. Most of the fishermen in Ibaraki Prefecture largely ceased their work. On April 13, 12,500 Bq / kg of radioactive cesium were discovered in a fish caught off Ibaraki, with a legal limit of 500 Bq / kg.
Agriculture Minister Michihiko Kano announced on April 10th that rice farmers who cannot replant because of the contamination will be fully compensated.
On April 27, bans on the sale and consumption of vegetables were lifted from a number of towns and districts in Fukushima Prefecture and Tochigi Prefecture . In the town of Ōtama , Fukushima, the contamination of spinach at 960 Bq / kg was still above the legal limit of 500 Bq / kg; in Tamura it was 510 Bq / kg.
- May 2011
Between May 3 and 9, the environmental protection organization Greenpeace took ten samples of seaweed at a distance of 42 to 65 kilometers from the power station and at least 22 kilometers from the coast (the Japanese government had refused Greenpeace entry into the 12-mile zone ). Other helpers took twelve algae samples from various points along the coast of the Miyagi, Fukushima and Ibaraki prefectures. Laboratory tests on the 21st of the samples on May 19 and 22 showed 137 Cs concentrations in the range from below 1 to 1450 Bq / kg, with a mean value and a standard deviation of around 380 Bq / kg each and a legal limit of 500 Bq / kg . The 131 I concentrations were below 2 to around 127,000 Bq / kg, with a mean of around 22,200 and a standard deviation of around 41,600 Bq / kg. The 131 I limit is 2000 Bq / kg.
On May 11, the Japanese government responded to several countries' food import restrictions and held a press conference emphasizing the safety of Japanese food exports.
During the second half of May radioactive contamination of tea leaves was found in the prefectures of Ibaraki, Gunma , Saitama , Chiba, Kanagawa and Shizuoka , about 100 to 300 kilometers south-southwest of Fukushima I. In many places, the cesium concentrations ranged from 500 to 800 Bq / kg above the limit of 500 Bq / kg. The local authorities asked tea growers to voluntarily stop sales. Some of the producers complied with these demands, and some of them still sold the radioactive tea to their customers. The tea harvest begins in Japan in May.
In May, the authorities lifted the sales and consumption bans for various types of vegetables in various areas outside the 20-kilometer zone around the power plant: In the towns of Soma, Minamisōma and Iwaki , the districts of Aizu, Minamiaizu and Soso and parts of the Kennan and Kenchu regions and Kenhoku. Shiitake mushrooms from Tamura, Shinchi and Kawauchi could also be sold again, as well as raw milk from parts of Kawamata and Minamisōma. New sales bans have been issued for bamboo shoots from various locations in Fukushima Prefecture and for ostrich fern from the cities of Fukushima and Koori.
- June / July 2011
In early June, the Japanese government banned the sale of tea leaves from Ibaraki Prefecture and parts of Tochigi, Chiba and Kanagawa Prefectures.
In July, cesium contamination was discovered in beef from Minamisōma. The radioactivity was 1530 to 3200 Bq / kg.
Import to Europe
On March 25, the European Union issued an emergency ordinance with which it established a "radiological emergency". However, this did not answer the question of where the radiological emergency or the unavoidable large-scale radioactive contamination is in Europe. This means that increased limit values for the radioactive contamination of food and feed came into force, which had been set for such situations between 1987 and 1990 - after the Chernobyl disaster . The higher limit values have been in effect in all member states of the European Union since March 25, 2011 . The EU can identify a “radiological emergency” when the usual maximum levels are likely to be or have been reached.
On April 8, the European Commission then lowered the limit values again, especially for imports from Japan. For 134 Cs and 137 Cs, the Japanese limit values of 500 Becquerel per kilogram have been in effect in Europe since then.
Bluefin tuna / USA
In spring 2012, bluefin tuna caught off the west coast of the United States had significantly higher 137 Cs values than those caught in 2008; in addition, they were contaminated with 134 Cs, also from the Fukushima nuclear power plant .
tap water
The adjacent graphics show the tap water contamination with 131 I from approx. Mid-March to the beginning of April. The measured values come from water treatment plants in various prefectures. The limit values for adults (red line) and small children (orange line) are entered as comparison values.
On March 15 and 19, small amounts of radioactive iodine (limit value: 300 Bq / l) were found in Tokyo's drinking water. On March 20, the Ministry of Health announced that, for the first time since 1990, traces of radioactive iodine had been found in the tap water of all prefectures neighboring Fukushima and in the greater Tokyo area, mostly (77 Bq / l) in Tochigi, as well as radioactive cesium (limit: 200 Bq / l) l) in two prefectures. They are still harmless to health. However, the government warned residents of Fukushima Prefecture not to use tap water.
In Shinjuku, Tokyo, the 131 I load increased from 1.47 Bq / kg on March 18 to 31.8 Bq / kg on March 25. The 134 Cs / 137 Cs exposure increased from 0.15 and 0.21 Bq / kg on March 19 to 0.92 and 1.22 Bq / kg on March 25, respectively. On March 22nd, the value for 131 I in a water treatment plant in Tokyo was 210 Bq / kg for the first time above the limit value of 100 Bq / l permitted for small children. Until March 25th, when it fell below this again, the prefecture administration recommended not to give tap water to children under one year old. The increase was mainly due to the rain, as during the same period the fallout (dust and rain) rose from 131 I from 51.4 Bq / m² on March 18 to 32,300 Bq / m² on March 21 and for 137 Cs from below Measurement threshold at 5,300 Bq / m². When the precipitation ended on March 24th, the values fell to 173 Bq / m² and 36.9 Bq / m².
On March 21-22, the 131 I concentrations in the cities of Kawamata , Minamisōma and Iwaki in Fukushima Prefecture exceeded the limit value for infants of 100 Bq / l at 174 Bq / l, 137 Bq / l and 103 Bq / l.
On March 26th, 131 I was detected in the drinking water of 12 of the 47 prefectures, but only in the Tochigi prefecture with a dangerous level for small children of 110 Bq / l; in the other prefectures it was well below 100 Bq / l. 137 Cs was found in the drinking water of 6 prefectures, but only in traces of less than 10 Bq / l.
On April 4, the Ministry of Health began to differentiate warnings against drinking tap water. Warnings should only continue if the limit values are exceeded within an average of the last three days [in an urban area?] .
On May 11th, the authorities in Iitake released tap water to babies again.
Floors
The Japanese Ministry of Culture and Technology MEXT took soil samples between March 18 and 22 at ten different locations 25 to 40 kilometers away from the power plant. In this 137 CS concentrations 1260-163000 Becquerel per kilogram (Bq / kg), and 131 detected I concentrations 6970-1170000 Bq / kg. On September 30th, the ministry published maps of strontium and plutonium contamination from 50 soil samples each.
- Hot spot in Iitate
The respective maximum values were found in soil samples from March 20 from the site of a farm in the village of Iitate , 40 kilometers northwest of Fukushima Daiichi. The next sample from March 21st showed only 39,900 Bq / kg 137 Cs and 207,000 Bq / kg 131 I for Iitate. By the end of the month the measured values in Iitate continued to decrease.
The place with the second highest measured value was the city of Kawamata , around 10 kilometers west of Iitate, with 14,200 Bq / kg 137 Cs and 84,300 Bq / kg 131 I on March 18. In the city of Minamisōma, only 25 kilometers from the power station, 4,040 Bq / kg 137 Cs and 35,800 Bq / kg 131 I were measured on the same day .
- Floor surfaces
The International Atomic Energy Agency (IAEA) published its own measurements from around the power plant at irregular intervals from March 21st. It only gave the minimum and maximum values of all measuring points for a day. This type of summary presentation met with criticism from the specialist community.
The following table shows the IAEA measurements of gamma - beta contamination on the soil surface, with measurements on consecutive days in the same direction being summarized for a better overview:
| date | Number of measurements | Location to the power plant | Measured values (kBq / m²) | ||
|---|---|---|---|---|---|
| Distance (km) | Compass direction | minimum | maximum | ||
| March, 20th | 16-58 | 200 | 900 | ||
| March 23 | 30-73 | 20th | 600 | ||
| March 24th | 34-73 | west | 40 | 400 | |
| 25th March | 34-62 | 70 | 960 | ||
| 26th of March | 23-97 | south, southwest | 20th | 400 | |
| 27./28. March | 30-46 | 20th | 3,100 | ||
| March 29 | 32-62 | north, northwest | 50 | 450 | |
| March 31 | 7th | 23-30 | south | 40 | 340 |
| April 1st | 9 | 30-58 | west | 10 | 490 |
| 2nd of April | 7th | 32-62 | north, northwest | 90 | 460 |
| 4th-6th April | 21st | 16-41 | south, southwest | 10 | 3,200 |
| April 8th | 16 | 24-62 | north, northwest | 30th | 5,000 |
| 10th of April | 7th | 23-39 | south, southwest | 10 | 180 |
| 11-13 April | 16 | 20-62 | west, northwest | 10 | 2,100 |
| April 14th | 11 | 15-39 | south, southwest | 160 | 2,500 |
- More hot spots
In the months that followed, there were various reports of high levels of contamination in road ditches and lowlands. In mid-August, for example, authorities reported 186,000 Bq / kg for sludge in a trench in Aizu-Wakamatsu , Fukushima Prefecture, about 100 kilometers west of the power plant.
people
As of March 30, 2011, a total of 110,340 people had been tested for radioactive contamination in Fukushima Prefecture . In 102 of them, the contamination in the clothed state was above the limit of 100,000 Becquerel . None of the people examined exceeded this limit when they were undressed. Six months later, the limit was lowered to 13,000 Becquerel.
On 20 April, in the breast milk of a woman in Kashiwa in Chiba Prefecture , a 131 I-concentration of 36 Bq / kg measured. Radioactive cesium was not detectable. The 131 I concentration in the milk of three other women examined was lower.
From April 24-28, the Japanese Ministry of Health had breast milk samples taken from 23 women from Tokyo, Fukushima, Ibaraki and Chiba prefectures, and one other prefecture. 3.5 Bq / kg of radioactive iodine and 2.4 Bq / kg of radioactive cesium were found in the milk of a woman who had been within the 30-kilometer zone around the power plant up to March 14th . In six other women from the prefectures of Ibaraki and Chiba, the specific activity of breast milk was between 2.2 and 8.0 Bq / kg. According to the ministry, these values are not dangerous for babies. The Japanese limit value for baby food is 100 Bq / kg.
A study by the Japanese Society of Pediatrics in August 2011 found that half of the 1,139 children examined in Fukushima Prefecture had low levels of 131 I thyroid exposure . The highest dose measured was 35 millisieverts; According to the company, values up to 100 are considered harmless.
As of November, urine samples from 1,500 children in Fukushima Prefecture had been tested for radioactive contamination. Radioactive cesium was detected in 104 of the children, with typical concentrations of 20 to 30 Bq / l. The highest value was 187 Bq / l in a one year old infant.
Sea water
For the total release of radioactive substances into the sea, see releases into the sea .
At the power plant
On March 21, 2011, Tepco found concentrations of 131 I, 134 Cs and 137 Cs above the legal limit values in the seawater near the water outlet channel of reactor units 1 to 4 and informed the NISA. Media coverage of this event focused on the 131 I values, which were significantly higher but are less dangerous than the cesium values in the long term. Marine biologists warned that 134 Cs and 137 Cs could accumulate in the food chain because of their long half-lives of two and thirty years, respectively. The Japanese nuclear regulatory authority NISA denied a threat to ocean life.
The adjacent graphics show the 137 Cs and 131 I measured values published by Tepco at four points along the coast ( logarithmic representation ):
- 30 meters north of the water outlet of blocks 5 and 6, approximately 2 kilometers north of block 1
- 330 meters south of the water outlet from blocks 1 to 4
- 10 kilometers further south, at the Fukushima II nuclear power plant
- 16 kilometers south of Fukushima I
The following table contains a selection of the measured values for the second measuring point near the water outlet from blocks 1 to 4. The concentrations of 134 Cs were almost identical to those of 137 Cs (maximum 3% downward deviation). The measurements were not completed until the day after the sample was taken, so that the published measured values for 131 I contained in the table are slightly lower than at the time of sampling due to the short half-life of eight days.
In addition to the concentration in Becquerel per liter, the ratio to the legal limit value for seawater is given. The Japanese limit values for 131 I, 134 Cs and 137 Cs are 40, 60 and 90 Bq / l, respectively.
From March 30th, Tepco measured twice a day (morning and noon). If the results of both measurements were similar, only the first measurement from the morning is shown in the table for a better overview; "-" = not detectable.
| Date sample extraction |
Readings for 137 Cs | Measured values for 131 I. | source | ||
|---|---|---|---|---|---|
| Concentration (Bq / l) |
relative to the limit |
Concentration (Bq / l) |
relative to the limit |
||
| March 21st | 1,484 | 16 | 5,066 | 127 | Tepco |
| March 23 | 250 | 3 | 5,900 | 147 | Tepco |
| March 24th | 440 | 5 | 4,200 | 104 | Tepco |
| 25th March | 7,200 | 80 | 50,000 | 1,251 | Tepco |
| 26th of March | 12,000 | 133 | 74,000 | 1,851 | Tepco |
| 27th of March | 1,800 | 20th | 10,000 | 250 | Tepco |
| 28th March | 240 | 3 | 1,100 | 28 | Tepco |
| March 29 | 24,000 | 268 | 100,000 | 2,572 | Tepco |
| March 30, 8:20 am | 8,300 | 92 | 32,000 | 800 | Tepco |
| March 30, 1:55 pm | 47,000 | 527 | 180,000 | 4,385 | Tepco |
| April 4, 9:20 am | 5,100 | 57 | 11,000 | 280 | Tepco |
| April 4, 2:20 pm | 19,000 | 210 | 41,000 | 1,000 | Tepco |
| April 5th | 7,800 | 130 | 16,000 | 400 | Tepco |
| April 6, 8:30 am | 2,000 | 22nd | 3,200 | 80 | Tepco |
| April 6, 9:30 am | The leak in a cable duct in Block 2 was sealed with a water glass. | ||||
| 7th of April | 1,700 | 19th | 2,200 | 55 | Tepco |
| April 8, 8:55 am | 12,000 | 130 | 19,000 | 480 | Tepco |
| April 8, 1:55 pm | 1,900 | 21st | 1,900 | 48 | Tepco |
| 9th April | 4,400 | 49 | 6,100 | 150 | Tepco |
| April 14th | The mud wall in front of the water inlet of Unit 2 has been completed; further mud walls and barriers in front of the water inlets from blocks 1 to 4 will be installed. | ||||
| April 15th | 880 | 10 | 720 | 18th | Tepco |
| April 23 | 130 | 1.4 | 59 | 1.5 | Tepco |
| April, 30th | 100 | 1.1 | 17th | 0.4 | Tepco |
| May 15 | 68 | 0.8 | 5 | 0.1 | Tepco |
| May 29th | 73 | 0.8 | - | - | Tepco |
| 14th June | 39 | 0.4 | - | - | Tepco |
| June 30th | 22nd | 0.2 | - | - | Tepco |
| 15th of July | - | - | - | - | Tepco |
| July 31 | - | - | - | - | Tepco |
| August 31 | - | - | - | - | Tepco |
| 30. September | - | - | - | - | Tepco |
| In October the detection threshold decreased from the previous 4 Bq / l 131 I and 9 Bq / l 137 Cs to 0.77 and 1.1 Bq / l, respectively. | |||||
| October 31 | 2.7 | 0.03 | - | - | Tepco |
| 30th of November | - | - | - | - | Tepco |
The next table shows the corresponding data from the first measurement point at the water outlet of reactor blocks 5 and 6. Here too, the 134 Cs values were almost identical to those of 137 Cs (maximum 5% downward deviation).
| Date sample extraction |
Readings for 137 Cs | Measured values for 131 I. | source | ||
|---|---|---|---|---|---|
| Concentration (Bq / l) |
relative to the limit |
Concentration (Bq / l) |
relative to the limit |
||
| March 23 | 1,900 | 21st | 2,700 | 67 | Tepco |
| March 24th | 110 | 1 | 950 | 24 | Tepco |
| 25th March | 1,700 | 18th | 11,000 | 284 | Tepco |
| 26th of March | 5,100 | 57 | 29,000 | 725 | Tepco |
| 27th of March | 9,800 | 109 | 46,000 | 1,150 | Tepco |
| 28th March | 6,600 | 74 | 33,000 | 816 | Tepco |
| March 30 | 15,000 | 167 | 57,000 | 1,525 | Tepco |
| March 31 | 12,000 | 130 | 45,000 | 1,100 | Tepco |
| April 1st | 37,000 | 410 | 120,000 | 3,000 | Tepco |
| 2nd of April | 21,000 | 230 | 53,000 | 1,300 | Tepco |
| 3rd of April | 5,000 | 56 | 12,000 | 300 | Tepco |
| 4. April | 2,300 | 26th | 5,300 | 130 | Tepco |
| April 5, 9:15 am | 13,000 | 140 | 24,000 | 600 | Tepco |
| April 5, 2:30 pm | 77,800 | 86 | 16,000 | 400 | Tepco |
| April 6, 8:55 am | 14,000 | 160 | 24,000 | 600 | Tepco |
| April 6, 9:30 am | The leak in a cable duct in Block 2 was sealed with a water glass. | ||||
| April 6, 2:25 pm | 24,000 | 270 | 41,000 | 1,000 | Tepco |
| April 7, 8:50 am | 68,000 | 760 | 110,000 | 2,800 | Tepco |
| April 7, 2:20 pm | 20,000 | 220 | 32,000 | 800 | Tepco |
| April 8th | 34,000 | 380 | 50,000 | 1,300 | Tepco |
| 9th April | 9,800 | 110 | 13,000 | 330 | Tepco |
| April 14th | The mud wall in front of the water inlet of Unit 2 has been completed; further mud walls and barriers in front of the water inlets from blocks 1 to 4 will be installed. | ||||
| April 15th | 2,000 | 22nd | 1,900 | 48 | Tepco |
| April 23, 8:50 am | 130 | 1.4 | 220 | 5.5 | Tepco |
| April 23, 2:25 pm | 370 | 4.1 | 260 | 6.5 | Tepco |
| April 30, 9:00 am | 230 | 2.3 | 43 | 1.1 | Tepco |
| April 30, 2:15 p.m. | 90 | 1.0 | 36 | 0.9 | Tepco |
| May 15 | 100 | 1.1 | 13 | 0.3 | Tepco |
| May 29th | 80 | 0.9 | 6th | 0.15 | Tepco |
| 14th June | 41 | 0.5 | - | - | Tepco |
| June 30th | 46 | 0.5 | - | - | Tepco |
| 15th of July | 93 | 1.0 | - | - | Tepco |
| July 31 | - | - | - | - | Tepco |
| August 31 | - | - | - | - | Tepco |
| 30. September | 10 | 0.1 | - | - | Tepco |
| In October the detection threshold decreased from the previous 4 Bq / l 131 I and 9 Bq / l 137 Cs to 0.77 and 1.1 Bq / l, respectively. | |||||
| October 31 | 5.7 | 0.06 | - | - | Tepco |
| 30th of November | 2.0 | 0.02 | - | - | Tepco |
At sea
From April 4 to 7, 2011, Tepco also measured the concentrations of 131 I, 134 Cs and 137 Cs at several points 15 kilometers from the coast. The following table shows the measured values 15 kilometers from Fukushima Daiichi. Nuclides that cannot be detected are marked with "-".
| Date sample extraction |
Readings for 137 Cs | Readings for 134 Cs | Measured values for 131 I. | source | |||
|---|---|---|---|---|---|---|---|
| Concen- tration (Bq / l) |
relative to the limit |
Concen- tration (Bq / l) |
relative to the limit |
Concen- tration (Bq / l) |
relative to the limit |
||
| 4. April | 64 | 0.71 | 52 | 0.87 | 190 | 4.8 | Tepco |
| April 5th | 22nd | 0.24 | 25th | 0.42 | 96 | 2.4 | Tepco |
| April 6th | 130 | 1.4 | 120 | 2.0 | 230 | 5.8 | Tepco |
| 7th of April | 32 | 0.47 | 32 | 0.7 | 99 | 2.5 | Tepco |
| 10th of May | - | - | 7th | 0.2 | Tepco | ||
| 23. May | 8th | 0.1 | 10 | 0.2 | - | Tepco | |
| 2th of June | - | - | - | Tepco | |||
Measurements by the responsible Ministry of Culture and Technology MEXT at points 15 kilometers from the shore around the power plant showed similar values over the next ten days. The 131 I and 137 Cs concentrations fluctuated between approx. 10 and 200 Bq / l.
On April 13th, the MEXT measured a 131 I concentration of 88 Bq / l in seawater 30 kilometers in front of the power plant , 2.2 times the legal limit.
On April 28, the Japanese Ministry of Agriculture denied the environmental protection organization Greenpeace measurements of radioactive contamination of sea and marine animals within the twelve-mile zone off the Japanese coast. Greenpeace is allowed to measure outside this zone.
Tepco measurements from April 25 off the coast of Ibaraki Prefecture showed slight traces of 134 Cs and 131 I. Measurements were taken at five points three kilometers from the coast. In repeated measurements from April 29th to June 10th, no more radioactive iodine or cesium was detectable.
Seabeds
On May 3, Tepco published for the first time measurement results from samples of the seabed that were taken on April 29 at a distance of three kilometers from the coast. Before Odaka, a district of Minamisōma, about 15 kilometers north of the power plant, 190 Bq / kg 131 I, 1300 Bq / kg 134 Cs and 1400 Bq / kg 137 Cs were detected. In front of Iwasawa Beach between Naraha and Hirono , 20 kilometers south of the power plant, it was 98 Bq / kg 131 I and 1200 Bq / kg 134 Cs and 137 Cs each . These values are 100 to 1000 times the usual, but there are no legal limits in Japan for the radionuclide concentration in the seabed. In a repeat measurement on June 2, no more 131 I was detectable. The cesium concentrations were 570 Bq / kg before Odaka and 1000 Bq / kg before Iwasawa.
Ships
Various ships were contaminated while sailing through Japanese waters. On March 30, Chinese authorities banned the Japanese container ship MOL Presence from entering the port of the Chinese city of Xiamen ; it had to return to Japan.
Germany and Spain set radiation limit values for cargo ships. On April 16, the European Union followed suit and decided that ships must be decontaminated if a dose rate of over 300 nanosieverts per hour (ten times the maximum dose rate permitted on the fence of the site of nuclear facilities) was determined.
Worldwide spread through the atmosphere
The possible distribution patterns and associated measurements were carried out at the Norwegian research institute and the American NOAA , among others . In Norway, distribution patterns were already calculated using the so-called FLEXPART model during the Chernobyl accident .
In Seattle , Washington state, the first particles released in the reactor accidents were detected on March 17, 2011. The radioactive isotopes 131 I , 132 I, 132 Te , 133 I, 134 Cs and 137 Cs were found in filters in the ventilation system of buildings at the University of Washington . Calculations showed that the concentration in the air was a fraction of the legal limit values, at 131 I for example one hundredth (<32 mBq / m³). The distribution of the different radioisotopes indicated that they were decay products from the reactor core that had been released into the atmosphere by means of water vapor, for example when the pressure was released from the reactor.
From March 22, 2011, the Environmental Protection Agency (EPA) measured slightly increased radiation levels in the air, first in Hawaii and later on the Pacific coast of the USA, which they previously classified as harmless to health.
On March 23, the first radioactive particles from Fukushima - transported via a transatlantic jet stream - reached Europe near Iceland and Norway. Measurements by the CTBTO , which operates a worldwide measurement system (International Monitoring System - Radionuclide Network) and can thus differentiate between artificial radionuclides and natural radiation, confirmed this. However, the concentration of radioactive substances is too low to have any effect on people. On March 29, radioactive particles from Fukushima were detectable at almost all CTBTO measuring stations.
South Korea closed some schools on April 7 for fear of radioactive rain. The authorities also recommended that you refrain from outdoor activities.
Total release
According to Tepco, 81 million terabecquerels ( trillion Becquerels ) were present at 131 I within the Fukushima I facility at the time of the accident . There are various estimates of how much of this and other radionuclides were released.
Release to the atmosphere
From March 22, 2011, the Austrian Central Institute for Meteorology and Geodynamics (ZAMG) published estimates of the total release of radioactive particles into the atmosphere. The calculations were based on measured values from the CTBTO stations and were carried out for the period from March 12 to 19, 2011.
On April 12, NISA published the first "official" assessments.
The following table shows the various estimates in Terabecquerel (TBq) and in comparison to the Chernobyl disaster . NISA did not give the dates of their investigations directly, but they can be read from data from a publication dated May 7, 2011 and were reported through the press.
| Report date | place | Period of release |
131 I (TBq) | 137 Cs (TBq) | source | ||
|---|---|---|---|---|---|---|---|
| from | to | from | to | ||||
| 2002 | Chernobyl | April 25 - June 1986 | 1,600,000 | 1,920,000 | 59,000 | 111,000 | NEA |
| March 22, 2011 | Fukushima | March 12-15, 2011 | 400,000 | 3,000 | 30,000 | ZAMG | |
| April 2, 2011 | Fukushima | March 12-19, 2011 | 10,000 | 700,000 | 1,000 | 70,000 | ZAMG |
| April 12, 2011 | Fukushima | March 11th - April 5th | 150,000 | 12,000 | NSC | ||
| April 12, 2011 | Fukushima | March 11-17, 2011 | 130,000 | 6,100 | NISA | ||
| June 7, 2011 | Fukushima | March 11-17, 2011 | 160,000 | 15,000 | NISA | ||
| August 24, 2011 | Fukushima | March 11th - April 5th | 130,000 | 11,000 | NSC | ||
| September 15, 2011 | Fukushima | March - September | 100,000 | 200,000 | 10,000 | 20,000 | Kantei |
In addition to 131 I and 137 Cs, other radioactive isotopes were released, for example 134 Cs in about the same amount as 137 Cs (see table of measured values above in the article). Using a procedure prescribed by the IAEA, the NSC and NISA determined the total amount (" 131 I equivalent") of all radioactive substances released in Fukushima from the 131 iodine and 137 Cs values, and came up with the following estimates:
| Report date | place | Period of release |
Quantity (TBq) | source |
|---|---|---|---|---|
| April 12, 2011 | Chernobyl | April 25 - June 1986 | 5,200,000 | NISA |
| April 12, 2011 | Fukushima | March 11 - April 5, 2011 | 630,000 | NSC |
| April 12, 2011 | Fukushima | March 11-17, 2011 | 370,000 | NISA |
| April 2011 | Fukushima | April 4, 2011 | 154 | NSC |
| April 25, 2011 | Fukushima | April 24, 2011 | 24 | NSC |
| 6./7. June 2011 | Fukushima | March 11-17, 2011 | 770,000 | NISA |
| June 7, 2011 | Fukushima | March 11-17, 2011 | 840,000 | NISA |
| 17th August 2011 | Fukushima | August 3-16, 2011 | 0.07 | government |
| 23 August 2011 | Fukushima | March 12 - April 5, 2011 | 630,000 | NISA |
The estimates for Fukushima only take into account the releases from reactors 1 to 3, but not from suspected fires in the decay basins.
Release into the sea
According to an estimate by Tepco, around 520 tons of contaminated water with a radioactivity of 4,700 terabecquerel (TBq) ended up in the sea between April 1 and 6, 2011. In addition, 0.15 TBq came from the dumping of 10,400 tons of lightly contaminated water from April 4th to April 10th.
At the end of August 2011, the Japanese government estimated that 950 TBq 137 Cs of radiation had entered the sea. Scientists at this point in time assumed 3,500 TBq direct and 7,500 TBq indirect (via the air) input. 10,000 TBq corresponds to about three percent of the input into the Pacific from the surface nuclear weapons tests of the 1950s and 1960s. In addition, there is further input via rivers and rain, by then 8,500 TBq.
The following table gives an overview of various estimates:
| Report date | Period of release |
Entry into the sea (TBq) | source | |
|---|---|---|---|---|
| directly | indirectly | |||
| May 21, 2011 | April 1-6, 2011 | 4,700 | Tepco | |
| Late August 2011 | March - August 2011 | 3,500 | 16,000 | JMA |
| September 8, 2011 | March - April 2011 | 15,000 | Research group | |
| October 29, 2011 | March 21 - July 15, 2011 | 27,100 | IRSN | |
New model simulations by scientists at the Helmholtz Center for Ocean Research Kiel show how the radioactive substances in the Pacific could spread over the long term due to ocean currents. With the help of a water mass tracer (t 1/2 137 Cs = 30a) that is very similar to 137 Cs in terms of half-life and solubility in the water column and an ocean flow model based on NEMO (Madec 2008), which also enables the rapid dilution of radioactive water in the Pacific in If ocean eddies are included, it was possible to simulate a long-term (10a) estimate of the distribution of 137 Cs in the Pacific. After two to three years, the tracer flag already spans the entire Pacific between 25 ° N and 55 ° N to depths of more than 400 m. The main part of the tracer patch is propagating eastwards and is expected to hit the North American coast after about five to six years. For the total net input of 137 Cs into the ocean, 10 P Bq were assumed; the simulation indicates a rapid dilution within two years after the input of the highest radioactive concentration to 10 Bq / m 3 . This is followed by a further dilution over the next four to seven years to 1–2 Bq / m 3 . The level of radioactivity would then still be about twice as high as the pre-Fukushima values.
In December 2014, small amounts of radioactivity are still being released into the Pacific. Since the significant decrease in the average contamination in the sea between the month of the accident in March and July 2011, it has been determined that this no longer decreases significantly, but remains relatively constant. The fish further away from the scene of the accident also show up to 100 times higher radiation exposure than was originally expected due to the assumed dilution with the distance. That also has z. B. Economic Consequences for Fisheries.
decontamination
See Protective Measures for the Population / Decontamination in the Fukushima Nuclear Disaster article
Media coverage
During the series of accidents, there were frequent reports in the media about measured radiation values and contamination by radioactive substances. Usually only the highest measured value within an area or a certain period of time was mentioned. For example, the measured 137 Cs concentrations in the soils of the Fukushima prefecture were on 19/20. March 2011 at 1,260 to 163,000 Becquerel per kilogram, the latter as an outlier compared to other measuring points; However, the Tagesthemen editorial team only reported that “within a 40-kilometer radius, a 137 Cs load of 163,000 Becquerel per kilogram of earth was measured”. When there was a release of extremely highly contaminated water in the water inlet of reactor block 2 - still within the power plant area - numerous media reported the values measured there as millions of limit values being exceeded in the seawater outside the power plant, although the measured values in the seawater directly outside the power plant by about a factor 200 lower.
Occasionally, the units millisievert (thousandth Sievert ) and microsievert (millionth Sievert) were confused . Among other things, the Neue Zürcher Zeitung reported on March 17 a huge radiation exposure “around the power plant” of 400 millisieverts per hour (mSv / h) - a value at which acute radiation sickness occurs within an hour - and based it on this number compares. In fact, on that day, the radiation even directly at the power plant boundary remained below 4 mSv / h; see the comparison values and the graphic in the section Air measurements on the power plant site .
The day before, figures of 1000 mSv / h had even made the rounds, which were due to an error by government spokesman Yukio Edano . The actual measured values on March 16 at the power station boundary amounted to around 10 mSv / h; see also air measurements on the power plant site .
There were also misunderstandings when legal limit values were exceeded. A milk contamination that was five times the Japanese limit of 300 Becquerel per liter - that is, four times the limit value too high - was exceeded five times. This mistake was also often made with reports of seawater contamination.
Japan's Deputy Foreign Minister Chiaki Takahashi criticized the foreign media reports on the accidents in Fukushima Daiichi as exaggerated and excessive.
Proven damage
A study from 2016 with the participation of the Helmholtz-Zentrum München shows increased mortality rates in fetuses and newborns for the period from the fifth month of pregnancy to seven days after birth from the 10th month after the three core meltdowns with radioactivity release from March 2011 contaminated prefectures closer to the disaster reactors. These increases in mortality are decreasing with increasing distance from the disaster reactors.
See also
Web links
- Tepco press releases (English), Tepco
- Tepco press releases (Japanese) with additional radiation readings
- Corrected and supplemented radiation measurements from the power plant site, March 11 to 21 (PDF; 197 kB) (English, archive ( Memento from May 29, 2011 on WebCite )), Tepco
- Local dose rate in Fukushima I (Japanese), Tepco
- NISA information update (English), with measured values from the power plant site, Nuclear and Industrial Safety Agency
- extensive collection of radiation measurements (English), Ministry of Culture and Technology (MEXT)
- Interactive map with current radiation readings (English)
- Interactive map of the radiation distribution ( memento from October 20, 2011 in the Internet Archive ) from the Ministry of Culture and Technology (Japanese)
- safecast.org/tilemap : Interactive map of the Citizen Science network Safecast (English)
Individual evidence
- ↑ Environmental radioactivity and radiation exposure (annual reports 2001–2009) . ( Memento from April 20, 2011 on WebCite ) Federal Office for Radiation Protection, accessed on April 21, 2011.
- ↑ Radioactivity Map Germany . ( Memento of March 24, 2011 on WebCite ) Federal Office for Radiation Protection, accessed on March 24, 2011.
- ↑ Tepco radiation measured values from March 22, 2011, mobile measured values on pages 1-3 and graphics with the fixed measuring stations on page 4 ( Memento from April 21, 2011 on WebCite ) (English, pdf). NISA, March 22, 2011, accessed March 22, 2011.
- ↑ Measuring points at the Fukushima Daiichi location . ( Memento April 14, 2011 on WebCite ) GRS, accessed April 14, 2011.
- ↑ Additional monitoring data at Fukushima Daiichi Nuclear Power Station ( Memento from May 29, 2011 on WebCite ) (English). Tepco, May 28, 2011, accessed May 29, 2011.
- ↑ Dose rate values of Fukushima Daiichi before the accident ( memento of March 24, 2011 on WebCite ) (Japanese). Tepco, accessed March 24, 2011.
- ↑ a b c d Information on the situation in Japan: As of March 25, 2011, 1:00 p.m. (CET) . ( Memento of April 11, 2011 on WebCite ) GRS, March 25, 2011, accessed March 25, 2011.
- ↑ TEPCO: Press Release ( Memento from April 2, 2011 on WebCite ) (English). Tepco, March 14, 2011, accessed April 2, 2011.
- ↑ White smoke around the Fukushima Daiichi Nuclear Power Station Unit 3 (3rd release) ( Memento from March 15, 2011 on WebCite ) (English). Tepco, March 14, 2011, accessed March 14, 2011.
- ↑ Earthquake Report - JAIF, No. 6 . ( Memento of April 28, 2011 on WebCite ) March 15, 2011, (PDF; 27 kB) April 28, 2011, accessed on April 28, 2011.
- ↑ Plant Status of Fukushima Daiichi Nuclear Power Station (as of 11:00 PM Mar 17th) ( Memento from April 20, 2011 on WebCite ) (English). Tepco, March 17, 2011, accessed March 19, 2011.
- ↑ Japan earthquake: Radiation levels fall at Fukushima ( Memento from March 15, 2011 on WebCite ) (English). BBC, March 15, 2011, accessed March 21, 2011.
- ↑ a b c Fukushima Nuclear Accident Update (March 15, 2011, 11:25 UTC) - Fukushima Daiichi Nuclear Power Plant Update ( Memento from April 9, 2011 on WebCite ). IAEA, March 15, 2011, accessed March 24, 2011.
- ↑ Desperate rescue operations at the wrecked pile . ( Memento April 20, 2011 on WebCite ) Die Welt Online, March 16, 2011, accessed March 17, 2011.
- ↑ Miya Tanaka, Maya Kaneko: Fukushima No. 3 reactor vents smoke, but container damage unlikely ( Memento from April 20, 2011 on WebCite ). Kyodo News, March 17, 2011, accessed March 21, 2011.
- ↑ Page no longer available , search in web archives: (title unknown) (English). Kyodo News, 2011-03-00, accessed 2011-03-00.
- ↑ Radiation slightly down around reactor ( Memento from April 20, 2011 on WebCite ). Kyodo News, March 18, 2011, accessed March 18, 2011.
- ↑ Wednesday, March 23, 10:30 pm ET, Tokyo ( April 20, 2011 memento on WebCite ). Bulletin of the Atomic Scientists, March 23, 2011, accessed March 25, 2011.
- ↑ Information on the situation in the Japanese nuclear power plants Fukushima, Onagawa and Tokai . ( Memento of April 12, 2011 on WebCite ) GRS, March 25, 2011, accessed March 25, 2011.
- ↑ April 2nd, 2011 Fukushima Dai-ichi Monitoring Data ( Memento from April 21, 2011 on WebCite ) (English, pdf). NISA, April 2, 2011, accessed April 8, 2011.
- ↑ a b Earthquake Report - JAIF, No. 56: 20:00, April 18 ( Memento from April 18, 2011 on WebCite ) (English, pdf). April 18, 2011 (PDF; 69 kB) on April 18, 2011, accessed on April 18, 2011.
- ↑ The results of nuclide analyzes of radioactive materials in the air at the site of Fukushima Daiichi Nuclear Power Station (30th release) ( Memento from April 24, 2011 on WebCite ) (English, pdf). Tepco, April 24, 2011, accessed April 25, 2011.
- ↑ a b The result of the nuclide analysis of radioactive materials in the air Fukushima Daiichi ( Memento from April 24, 2011 on WebCite ) (English, pdf). Tepco, March 26, 2011, (PDF; 13 kB) April 24, 2011, accessed April 24, 2011.
- ↑ The result of the nuclide analysis of radioactive materials in the air Fukushima Daiichi ( Memento of 27 April 2011 Webcite ) (pdf). Tepco, March 27, 2011, (PDF; 35 kB) April 27, 2011, accessed April 27, 2011.
- ↑ a b The result of the nuclide analysis of radioactive materials in the air Fukushima Daiichi ( Memento from April 24, 2011 on WebCite ) (English, pdf). Tepco, March 31, 2011, (PDF; 37 kB) April 24, 2011, accessed April 24, 2011.
- ↑ The result of the nuclide analysis of radioactive materials in the air Fukushima Daiichi ( Memento from April 24, 2011 on WebCite ) (English, pdf). Tepco, April 7, 2011, (PDF; 37 kB) April 24, 2011, accessed April 24, 2011.
- ↑ The result of the nuclide analysis of radioactive materials in the air Fukushima Daiichi ( Memento from April 24, 2011 on WebCite ) (English, pdf). Tepco, April 14, 2011, (PDF; 8 kB) April 24, 2011, accessed April 24, 2011.
- ↑ The result of the nuclide analysis of radioactive materials in the air Fukushima Daiichi ( Memento from April 24, 2011 on WebCite ) (English, pdf). Tepco, April 21, 2011, (PDF; 11 kB) April 24, 2011, accessed April 24, 2011.
- ↑ a b c Additional Report of the Japanese Government to the IAEA ( Memento of December 11, 2011 on WebCite ) (English, pdf, 31 MB). Kantei , September 15, 2011, accessed December 17, 2011. Fountain basin readings on pages 205, 207, 210, and 214; Total release on page 449.
- ^ Result of Analysis of common spent fuel pool water for Fukushima Daiichi Nuclear Power Station ( Memento from May 17, 2011 on WebCite ). Tepco, May 14, 2011, (PDF; 9 kB) May 17, 2011, accessed on May 15, 2011.
- ↑ 3 人 被曝 の 1 時間 前 「1 号 機 地下 に 汚染 水」 東 電 伝 え ず ( Memento from April 11, 2011 on WebCite ) (Japanese). In: asahi.com. Asahi Shimbun, archived from the original ( Memento of March 27, 2011 in the Internet Archive ) on April 11, 2011, retrieved on March 26, 2011.
- ^ Fears of radioactive seawater grow near nuke plant despite efforts ( Memento April 21, 2011 on WebCite ). Kyodo News, March 26, 2011, accessed April 21, 2011.
- ↑ Regarding the result of concentration measurement in the stagnant water on the basement floor of the turbine building of Unit 1 of Fukushima Dai-ichi Nuclear Power Station ( Memento from April 18, 2011 on WebCite ) (English). METI, March 25, 2011, accessed March 26, 2011.
- ↑ a b Earthquake Report No. 32 (JAIF) ( Memento from April 21, 2011 on WebCite ) (English, pdf). JAIF / NHK, March 27, 2011, (PDF; 32 kB) April 21, 2011, accessed on March 27, 2011.
- ↑ At Plant, a Choice Between Bad, Worse ( Memento from May 11, 2011 on WebCite ) (English). Wall Street Journal, March 30, 2011, accessed May 11, 2011: “Authorities say 1,000 millisieverts is the upper limit of their measuring devices”.
- ↑ a b Woes deepen over radioactive water at nuke plant, sea contamination ( Memento from March 28, 2011 on WebCite ) (English). Kyodo News, March 28, 2011, accessed March 27, 2011.
- ↑ Result of Contamination Check of Water in the Basement At the Turbine Building of Each Unit 2 of Fukushima Daiichi Power Station ( Memento from March 28, 2011 on WebCite ) (English, pdf). Tepco, March 27, 2011, (PDF; 15 kB) on March 28, 2011, accessed on March 28, 2011.
- ↑ Improvement plan for the exact nuclide analysis at the site of Fukushima Daiichi Nuclear Power Station under instruction of NISA ( Memento from April 21, 2011 on WebCite ) (English). Tepco, April 4, 2011, accessed April 21, 2011.
- ↑ a b c d Seismic Damage Information (the 93rd Release) ( Memento from April 21, 2011 on WebCite ) (English, pdf). NISA, April 14, 2011, accessed April 16, 2011.
- ↑ The 2011 off the Pacific coast of Tohoku Pacific Earthquake and the seismic damage to the NPPs ( Memento of April 13, 2011 on WebCite ) (English, pdf). NISA, April 4, 2011, accessed April 13, 2011. Readings on page 60 (document numbering).
- ↑ Report of Japanese Government to the IAEA Ministerial Conference on Nuclear Safety - The Accident at TEPCO's Fukushima Nuclear Power Stations - VI 5. Situation of Each Unit etc. at Fukushima NPS (Part 2/2) ( Memento from June 8, 2011 on WebCite ) (English). Kantei / NISA, June 7, 2011, (PDF; 1.4 MB), accessed June 8, 2011. Measured values on page IV-112.
- ↑ 福島 第一 原子 力 発 電 所 サ ブ ド レ ン の 測定 結果 ( Memento from April 11, 2011 on WebCite ) (Japanese, pdf). Tepco, March 28, 2011, (PDF; 11 kB) April 11, 2011, accessed on April 11, 2011.
- ↑ a b Fukushima Daiichi Nuclear Power Station: Results of Nuclide Analysis of sub-drain ( Memento from April 14, 2011 on WebCite ) (English, pdf). Tepco, April 14, 2011, (PDF; 53 kB) April 14, 2011, accessed on April 14, 2011.
- ↑ a b Fukushima Daiichi Nuclear Power Station: Results of Nuclide Analysis of sub-drain ( Memento from June 12, 2011 on WebCite ) (English, pdf). Tepco, May 7, 2011, (PDF; 10 kB), accessed on June 12, 2011.
- ↑ Results of Nuclide Analysis of sub-drain ( Memento from May 14, 2011 on WebCite ) (English, pdf). Tepco, May 14, 2011, (PDF; 53 kB) on May 14, 2011, accessed on May 14, 2011.
- ↑ Results of Nuclide Analysis of sub-drain ( Memento from May 26, 2011 on WebCite ) (English, pdf). Tepco, May 26, 2011, (PDF; 11 kB), accessed on May 26, 2011.
- ↑ Results of Nuclide Analyzes of sub-drains ( Memento of June 7, 2011 on WebCite ) (English, pdf). Tepco, June 4, 2011, (PDF; 11 kB), accessed on June 7, 2011.
-
↑ Fukushima Diichi Nuclear Power Station - Result of Pu Analysis in Sub Drain ( Memento from August 17, 2011 on WebCite ) (English, pdf). Tepco, July 27, 2011, (PDF; 8 kB), accessed on August 17, 2011;
Fukushima Diichi Nuclear Power Station - Result of Pu Analysis in Sub Drain ( Memento from August 17, 2011 on WebCite ) (English, pdf). Tepco, July 28, 2011, (PDF; 8 kB), accessed on August 17, 2011. - ^ A correction of "The status of water analysis in the trench of Fukushima Daiichi Nuclear Power Station" ( Memento of April 12, 2011 on WebCite ) (English). Tepco, March 31, 2011, accessed April 5, 2011.
- ↑ Groundwater at nuclear plant 'highly' radiation-contaminated: TEPCO ( Memento from April 1, 2011 on WebCite ) (English). Kyodo News, April 1, 2011, accessed April 1, 2011.
- ↑ Out flow of fluid containing radioactive materials to the ocean from areas near intake channel of Fukushima Daiichi Nuclear Power Station Unit 2 ( Memento from April 12, 2011 on WebCite ) (English). Tepco, April 2, 2011, accessed April 2, 2011.
- ↑ Absorbent used to soak up radioactive water, 2 found dead at nuke plant ( Memento from April 20, 2011 on WebCite ) (English). April 3, 2011, accessed April 3, 2011.
- ^ Removal of 60,000 tons of radioactive water eyed at Fukushima plant ( Memento from April 12, 2011 on WebCite ) (English). Kyodo News, April 5, 2011, accessed April 5, 2011.
- ↑ a b The result of the nuclide analyzes of the seawater at the front of shallow draft quay and screen of Unit 2, 4 ( Memento from April 21, 2011 on WebCite ) (en, pdf). Tepco, April 5, 2011, (PDF; 11 kB) April 21, 2011, accessed on April 5, 2011.
- ↑ The result of the nuclide analyzes of the seawater at the front of shallow draft quay and screen of Unit 2, 4 ( Memento from April 21, 2011 on WebCite ) (en, pdf). Tepco, April 5, 2011, (PDF; 11 kB) April 21, 2011, accessed April 9, 2011.
- ↑ a b c d Out flow of fluid containing radioactive materials to the ocean from areas near intake channel of Fukushima Daiichi Nuclear Power Station Unit 2 (continued report) ( Memento from April 24, 2011 on WebCite ) (en, pdf). Tepco, April 6, 2011, accessed April 24, 2011.
- ↑ The result of the nuclide analyzes on seawater sampled in front of quay and screens of Unit 2/4 ( Memento from April 21, 2011 on WebCite ) (English, pdf). Tepco, April 6, 2011, (PDF; 11 kB) April 21, 2011, accessed April 7, 2011.
- ↑ The result of the nuclide analyzes on seawater sampled in front of quay and screens of Unit 2/4 ( Memento from April 21, 2011 on WebCite ) (English, pdf). Tepco, April 7, 2011, (PDF; 11 kB) April 21, 2011, accessed April 7, 2011.
- ↑ The result of the nuclide analyzes on seawater sampled in front of the shallow draft quay and the screens of Unit 2 and 4 of the Fukushima Daiichi Nuclear Power Station ( Memento from April 24, 2011 on WebCite ) (English, pdf). Tepco, April 8, 2011, (PDF; 51 kB) April 24, 2011, accessed April 24, 2011.
- ↑ The result of the nuclide analyzes on seawater sampled in front of the shallow draft quay and the screens of Unit 2 and 4 of the Fukushima Daiichi Nuclear Power Station ( Memento from April 21, 2011 on WebCite ) (English, pdf). Tepco, April 9, 2011, (PDF; 54 kB) April 21, 2011, accessed April 9, 2011.
- ↑ 福島 第一 原子 力 発 電 所 2 号 機 取水 口 付 近 か ら の 放射性 物質 を 含 む 液体 の 海 へ の 流出 に つ い て (続 報 7) ( Memento from April 21, 2011 on WebCite ) (Japanese, pdf). Tepco, April 11, 2011, (PDF; 11 kB) April 21, 2011, accessed April 11, 2011.
- ↑ Result of the Nuclide Analysis of the seawater at the shallow draft quay, Unit 2 screen and the water intake canal of Unit 1-4 ( Memento from April 21, 2011 on WebCite ) (English, pdf). Tepco, April 13, 2011, (PDF; 11 kB) April 21, 2011, accessed on April 16, 2011.
- ↑ Result of the Nuclide Analysis of the seawater at the shallow draft quay, Unit 2 screen and the water intake canal of Unit 1-4 ( Memento from April 21, 2011 on WebCite ) (English, pdf). Tepco, April 15, 2011, (PDF; 11 kB) on April 21, 2011, accessed on April 16, 2011.
- ↑ a b Earthquake Report - JAIF, No. 54: 18:00, April 16 ( Memento from April 16, 2011 on WebCite ) (English, pdf). JAIF / NHK, April 16, 2011, (PDF; 280 kB) April 16, 2011, accessed April 16, 2011.
- ↑ Result of the Nuclide Analysis of the seawater at the shallow draft quay, Unit 2 screen and the water intake canal of Unit 1-4 ( Memento from April 21, 2011 on WebCite ) (English, pdf). Tepco, April 16, 2011, (PDF; 11 kB) April 21, 2011, accessed on April 16, 2011.
- ↑ Result of the Nuclide Analysis of the seawater at the shallow draft quay, Unit 2 screen and the water intake canal of Unit 1-4 ( Memento from April 21, 2011 on WebCite ) (English, pdf). Tepco, April 17, 2011, (PDF; 11 kB) April 21, 2011, accessed on April 17, 2011.
- ↑ Seismic Damage Information (the 98th Release) ( Memento of April 17, 2011 on WebCite ) (English, pdf). NISA, April 17, 2011, accessed April 17, 2011.
- ↑ Result of the Nuclide Analysis of the seawater at the shallow draft quay, Unit 2 screen and the water intake canal of Unit 1-4 ( Memento from April 24, 2011 on WebCite ) (English, pdf). Tepco, April 24, 2011, (PDF; 12 kB) April 20, 2011, accessed April 24, 2011.
- ↑ (Definite Report) Result of Nuclide Analysis of the seawater at Fukushima Daiichi NPS, Shallow Draft Quay, Unit 2 screen, and the water intake canal of Units 1-4 ( Memento from May 23, 2011 on WebCite ) (English, pdf) . Tepco, May 23, 2011, (PDF; 51 kB) on May 23, 2011, accessed on May 23, 2011.
- ↑ Result of the Nuclide Analysis of the seawater at the shallow draft quay, Unit 2 screen and the water intake canal of Unit 1-4 ( Memento from April 24, 2011 on WebCite ) (English, pdf). Tepco, April 24, 2011, (PDF; 56 kB) April 24, 2011, accessed April 24, 2011.
- ↑ Result of the nuclides Analysis of the seawater at the shallow draft quay, Unit 2 screen and the water intake canal of Unit 1-4 ( Memento of 4 May 2011 Webcite ) (pdf). Tepco, April 29, 2011, (PDF; 12 kB) on May 4, 2011, accessed on May 4, 2011.
- ↑ Result of the Nuclide Analysis of the seawater at the shallow draft quay, Unit 2 screen and the water intake canal of Unit 1-4 ( Memento from May 5, 2011 on WebCite ) (English, pdf). Tepco, May 1, 2011, (PDF; 54 kB) May 5, 2011, accessed May 5, 2011.
- ↑ Result of the nuclides Analysis of the seawater at the shallow draft quay, Unit 2 screen and the water intake canal of Unit 1-4 ( Memento of 4 May 2011 Webcite ) (pdf). Tepco, May 3, 2011, (PDF; 12 kB) May 4, 2011, accessed May 4, 2011.
- ↑ Result of the Nuclide Analysis of the seawater at the shallow draft quay, Unit 2 screen and the water intake canal of Unit 1-4 ( Memento from May 5, 2011 on WebCite ) (English, pdf). Tepco, May 5, 2011, (PDF; 13 kB) May 5, 2011, accessed May 5, 2011.
- ↑ Result of the nuclides Analysis of the seawater at the shallow draft quay, Unit 2 screen and the water intake canal of Unit 1-4 ( Memento of 7 May 2011 Webcite ) (pdf). Tepco, May 7, 2011, (PDF; 56 kB) May 7, 2011, accessed May 7, 2011.
- ↑ Result of the nuclides Analysis of the seawater at the shallow draft quay, Unit 2 screen and the water intake canal of Unit 1-4 ( Memento of 11 May 2011 on Webcite ) (pdf). Tepco, May 9, 2011, (PDF; 11 kB) May 11, 2011, accessed on May 11, 2011.
- ↑ Result of the nuclides Analysis of the seawater at the shallow draft quay, Unit 2 screen and the water intake canal of Unit 1-4 ( Memento of 11 May 2011 on Webcite ) (pdf). Tepco, May 11, 2011, (PDF; 11 kB) May 11, 2011, accessed on May 11, 2011.
- ↑ Report regarding the implementation of a measure to flood primary containment vessel to the upper area of fuel reange in Unit 1 of Fukushima Daiichi Nuclear Power Station (summary) ( Memento from May 5, 2011 on WebCite ) (English, pdf). Tepco, May 5, 2011, (PDF; 119 kB) on May 5, 2011, accessed on May 5, 2011. See explanations on page 3
- ↑ Site plan of the deep water measuring points ( Memento from April 8, 2011 on WebCite ) (Japanese). Tepco, (PDF; 786 kB) on April 8, 2011, accessed on April 8, 2011.
- ↑ 福島 第一 サ ブ ド レ ン 等 核 種 分析 結果 ( Memento from April 11, 2011 on WebCite ) (Japanese). Tepco, April 8, 2011, (PDF; 63 kB) April 11, 2011, accessed April 8, 2011.
- ↑ Fukushima Daiichi Nuclear Power Station: Results of Nuclide Analysis of sub-drain ( Memento of April 17, 2011 on WebCite ) (English, pdf). Tepco, April 17, 2011, (PDF; 53 kB) April 18, 2011, accessed on April 18, 2011.
- ↑ Fukushima Daiichi Nuclear Power Station: Results of Nuclide Analysis of sub-drain ( Memento from April 19, 2011 on WebCite ) (English, pdf). Tepco, April 19, 2011, (PDF; 10 kB) April 20, 2011, accessed on April 20, 2011.
- ^ Fukushima Daiichi Nuclear Power Station: Results of Nuclide Analysis of sub-drain ( Memento from April 24, 2011 on WebCite ) (English, pdf). Tepco, April 21, 2011, (PDF; 53 kB) April 24, 2011, accessed April 24, 2011.
- ↑ Fukushima Daiichi Nuclear Power Station: Results of Nuclide Analysis of sub-drain ( Memento from May 7, 2011 on WebCite ) (English, pdf). Tepco, April 23, 2011, (PDF; 54 kB) on May 7, 2011, accessed on May 7, 2011.
- ↑ Fukushima Daiichi Nuclear Power Station: Results of Nuclide Analysis of sub-drain ( Memento from May 7, 2011 on WebCite ) (English, pdf). Tepco, April 26, 2011, (PDF; 54 kB) on May 7, 2011, accessed on May 7, 2011.
- ↑ A list of press releases regarding Fukushima Daiichi Nuclear Power Station . Tepco, accessed on June 18, 2011, archive ( Memento from May 23, 2011 on WebCite ) from May 23, 2011: "Detection of Radioactive Materials from Subsurface Water"
- ↑ Radioactively contaminated groundwater in Fukushima faz.net, June 19, 2013.
- ↑ spiegel.de July 9, 2013: Radioactive pollution of the groundwater increases dramatically
- ^ A b Detection of radioactive material in the soil in Fukushima Daiichi Nuclear Power Station ( Memento from April 20, 2011 on WebCite ) (English). Tepco, March 28, 2011, accessed March 28, 2011.
- ↑ News, 19:00 . ( Memento from April 1, 2011 on WebCite ) In: dradio.de. Deutschlandradio, March 27, 2011, accessed on April 1, 2011.
- ↑ a b c Result of Plutonium measurement in the soul in the Fukushima Daiichi Nuclear Power Plant ( Memento from April 21, 2011 on WebCite ) (English, pdf). Tepco, March 28, 2011, (PDF; 83 kB) April 21, 2011, accessed April 7, 2011.
- ↑ a b c Result of Plutonium measurement in the soul in the Fukushima Daiichi Nuclear Power Plant ( Memento from April 21, 2011 on WebCite ) (English, pdf). Tepco, April 6, 2011, (PDF; 13 kB) April 21, 2011, accessed April 7, 2011.
- ↑ a b Fukushima Daiichi Nuclear Power Station Regular Sampling Spots of Soil ( Memento from May 29, 2011 on WebCite ) (English, pdf). Tepco, March 28, 2011, (PDF; 114 kB), accessed on May 29, 2011.
- ↑ a b Fukushima Daiichi Nuclear Power Station: Plutonium analysis result in the soil ( Memento from April 14, 2011 on WebCite ) (English, pdf). Tepco, April 14, 2011, (PDF; 13 kB) April 14, 2011, accessed on April 14, 2011.
- ↑ Fukushima Daiichi Nuclear Power Station: Plutonium analysis result in the soil ( Memento from May 17, 2011 on WebCite ) (English, pdf). Tepco, April 22, 2011, (PDF; 14 kB) on May 17, 2011, accessed on May 17, 2011.
- ↑ Fukushima Daiichi Nuclear Power Station: Uranium analysis result in the soil ( Memento from April 14, 2011 on WebCite ) (English, pdf). Tepco, April 14, 2011, (PDF; 14 kB) April 14, 2011, accessed on April 14, 2011.
- ↑ Earthquake Report - JAIF, No. 74 ( Memento of May 7, 2011 on WebCite ) (English, pdf). JAIF / NHK, May 7, 2011, (PDF; 236 kB) May 7, 2011, accessed May 7, 2011.
- ↑ Military Crew Said to Be Exposed to Radiation, but Officials Call Risk in US Slight ( Memento April 21, 2011 on WebCite ). New York Times, March 13, 2011, accessed April 21, 2011.
- ↑ Anatol Johansen: Drones circle over Fukushima . ( Memento from April 2, 2011 on WebCite ) In: welt.de. Axel Springer, March 21, 2011, accessed April 2, 2011.
- ↑ Evan Ackerman: Global Hawk UAV to Peek Inside Damaged Reactors ( Memento April 2, 2011 on WebCite ) (English). In: news.discovery.com. Discovery Communications as of March 18, 2011, archived from the original on April 2, 2011.
- ↑ Radiation 1,600 times normal level 20 km from Fukushima plant: IAEA ( Memento from April 20, 2011 on WebCite ) (English). Kyodo News, March 22, 2011, accessed March 22, 2011.
- ↑ a b Fukushima Nuclear Accident Update Log, Updates of 24 March 2011 ( Memento from April 20, 2011 on WebCite ) (English). IAEA, March 24, 2011, accessed April 18, 2011.
- ↑ a b Greenpeace: Googlemap (English). March 27, 2011, accessed March 30, 2011.
- ↑ Greenpeace radiation team pinpoints need to extend Fukushima evacuation zone ( Memento from April 20, 2011 on WebCite ) (English). Greenpeace, March 27, 2011, accessed March 28, 2011.
- ↑ a b Readings at Monitoring Post out of 20 Km Zone of Fukushima Dai-ichi NPP ( Memento from April 21, 2011 on WebCite ). MEXT, March 29, 2011, (PDF; 192 kB) April 21, 2011, accessed on March 29, 2011.
- ↑ a b Illegal levels of radioactive substances found in Fukushima mushrooms ( Memento from April 3, 2011 on WebCite ) (English). Kyodo News, April 3, 2011, accessed April 3, 2011.
- ↑ a b Radiation in Tokyo returns to pre-disaster level ( Memento from April 13, 2011 on WebCite ) (English). Kyodo News, April 13, 2011, accessed April 13, 2011.
- ↑ Earthquake Report - JAIF, No. 70 ( Memento from May 3, 2011 on WebCite ) (English, pdf). JAIF / NHK, May 3, 2011, (PDF; 193 kB) May 3, 2011, accessed on May 3, 2011.
- ↑ 外部 被 ば く の 積 算 線 量 ( Memento from May 3, 2011 on WebCite ) (Japanese, pdf). Nuclear Safety Commission, accessed May 3, 2011.
- ↑ Earthquake Report - JAIF, No. 99 ( Memento from June 1, 2011 on WebCite ) (English, pdf). JAIF / NHK, June 1, 2011, (PDF; 124 kB), accessed June 1, 2011.
- ↑ Food glossary : radioactivity of food . ( April 20, 2011 memento on WebCite ) Archived from the original on April 20, 2011, retrieved on March 22, 2011.
- ↑ a b Information on the nuclear power plants affected by the earthquake of March 11, 2011 in Japan. Federal Ministry for the Environment, Nature Conservation and Nuclear Safety, March 21, 2011, archived from the original on April 8, 2011 ; Retrieved April 4, 2014 .
- ↑ URGENT: Spinach with high radiation levels found near Fukushima plant ( Memento from March 19, 2011 on WebCite ) (English). Kyodo News, March 19, 2011, accessed March 19, 2011.
- ^ Fukushima Nuclear Accident Update Log; Fukushima Nuclear Accident Update (19 March 2011 12:00 UTC) - Corrected ( Memento from April 12, 2011 on WebCite ). IAEA, March 19, 2011, accessed March 24, 2011.
- ↑ Miracles in Japan - food contaminated . In: sueddeutsche.de. March 20, 2011, accessed on March 22, 2011. Archived print version ( Memento from April 21, 2011 on WebCite )
- ↑ Information on the situation in the Japanese nuclear power plants Fukushima, Onagawa and Tokai . ( Memento from April 12, 2011 on WebCite ) (see discussion: Radiation exposure from the Fukushima nuclear accidents # Defective sources )
- ↑ Seismic Damage Information (the 47th Release) (As of 08:00 March 24th, 2011) ( Memento of April 21, 2011 on WebCite ) (English, pdf). NISA, March 24, 2011, accessed March 24, 2011.
- ↑ a b Japan's government warns against contaminated drinking water . ( Memento April 12, 2011 on WebCite ) Spiegel Online, March 20, 2011, accessed April 21, 2011.
- ↑ information on the situation in Japan: Stand March 25th 2011, 13:00 . ( Memento of April 11, 2011 on WebCite ) GRS, accessed April 11, 2011.
- ↑ Earthquake Report - JAIF, No. 52: 20:00, April 14 ( Memento from April 14, 2011 on WebCite ) (English, pdf). JAIF / NHK, April 14, 2011, (PDF; 119 kB) April 14, 2011, accessed April 14, 2011.
- ↑ Gov't bans shiitake mushroom shipment from Fukushima city ( Memento from April 18, 2011 on WebCite ) (English). Kyodo News, accessed April 18, 2011.
- ↑ a b Japan changes scope of restrictions on farm products ( Memento from April 20, 2011 on WebCite ) (English). Kyodo News, April 4, 2011, accessed April 4, 2011.
- ↑ High level of cesium detected in sand lances ( Memento of April 18, 2011 on WebCite ). NHK World, April 5, 2011, archived from the original ( Memento of May 11, 2011 in the Internet Archive ) on April 18, 2011, retrieved on April 5, 2011.
- ↑ Earthquake Report - JAIF, No. 44: 20:00, April 6 . ( Memento from April 9, 2011 on WebCite ) JAIF / NHK, April 6, 2011, (PDF; 140 kB) April 9, 2011, accessed April 9, 2011.
- ↑ Excessive radioactive cesium found in fish caught off Fukushima ( Memento from April 13, 2011 on WebCite ). Kyodo News, April 13, 2011, accessed April 13, 2011.
- ↑ Earthquake Report - JAIF, No. 48: 18:00, April 10 ( Memento from April 10, 2011 on WebCite ) (English). JAIF / NHK, April 10, 2011, (PDF; 80 kB) April 10, 2011, accessed April 10, 2011.
- ↑ Seismic Damage Information (the 118th Release), Extract ( Memento from April 29, 2011 on WebCite ) (English, pdf). NISA, April 28, 2011, accessed April 29, 2011.
- ↑ Earthquake Report - JAIF, No. 66 ( Memento of April 29, 2011 on WebCite ) (English, pdf). JAIF / NHK, April 28, 2011, (PDF; 117 kB) April 29, 2011, accessed on April 29, 2011.
- ↑ Greenpeace: Japanese Government must immediately investigate seaweed contamination ( Memento of May 12, 2011 on WebCite ) (English). Greenpeace, May 12, 2011, accessed May 12, 2011.
- ↑ Marine testing lab results 1, published 25 May 2011 ( Memento from May 27, 2011 on WebCite ) (English, pdf). Greenpeace, May 25, 2011, (PDF; 122 kB) May 27, 2011, accessed May 27, 2011.
- ↑ Marine testing lab results 2, published 25 May 2011 ( Memento from May 27, 2011 on WebCite ) (English, pdf). Greenpeace, May 25, 2011, (PDF; 805 kB) May 27, 2011, accessed May 27, 2011.
- ↑ Greenpeace Fukushima radiation research reveals serious marine contamination ( Memento of May 27, 2011 on WebCite ). Greenpeace, May 26, 2011, accessed May 27, 2011.
- ↑ Earthquake Report - JAIF, No. 78 ( Memento of May 10, 2011 on WebCite ) (English, pdf). JAIF / NHK, May 11, 2011, (PDF; 120 kB) May 11, 2011, accessed May 12, 2011.
- ↑ Earthquake Report - JAIF, No. 80 ( Memento of May 13, 2011 on WebCite ) (English, pdf). JAIF / NHK, May 13, 2011, (PDF; 130 kB) May 13, 2011, accessed on May 13, 2011.
- ↑ Earthquake Report - JAIF, No. 84 ( Memento of May 17, 2011 on WebCite ) (English, pdf). JAIF / NHK, May 17, 2011, (PDF; 113 kB) May 17, 2011, accessed on May 17, 2011.
- ↑ Earthquake Report - JAIF, No. 93 ( Memento from May 26, 2011 on WebCite ) (English, pdf). JAIF / NHK, May 26, 2011, (PDF; 130 kB), accessed on May 26, 2011.
-
↑ Seismic Damage Information (the 126th Release) ( Memento from May 29, 2011 on WebCite ) (English). NISA, May 5, 2011, accessed May 29, 2011;
Seismic Damage Information (the 136th Release) ( Memento from May 29, 2011 on WebCite ). NISA, May 12, 2011; accessed May 29, 2011;
Seismic Damage Information (the 143rd Release), Extract ( Memento from May 28, 2011 on WebCite ). NISA, May 19, 2011, accessed May 28, 2011;
Seismic Damage Information (the 150th Release), Extract ( Memento from May 28, 2011 on WebCite ). NISA, May 26, 2011, accessed May 28, 2011. -
↑ Seismic Damage Information (the 140th Release) ( Memento from May 28, 2011 on WebCite ) (English). NISA, May 16, 2011, accessed May 28, 2011;
Seismic Damage Information (the 147th Release), Extract ( Memento from May 28, 2011 on WebCite ). NISA, May 23, 2011, accessed May 28, 2011. - ↑ Seismic Damage Information (the 123rd Release) ( Memento from May 29, 2011 on WebCite ) (English). NISA, May 2, 2011, accessed May 29, 2011.
-
↑ Seismic Damage Information (the 131st Release) ( Memento from May 29, 2011 on WebCite ) (English). NISA, May 9, 2011, accessed May 28, 2011;
Seismic Damage Information (the 137th Release) ( Memento from May 29, 2011 on WebCite ). NISA, May 13, 2011, accessed May 29, 2011. - ↑ Gov't bans shipment of tea leaves in 4 prefectures ( Memento from June 3, 2011 on WebCite ) (English). The Mainichi Daily News / Kyodo News, June 3, 2011, archived from the original ( June 7, 2011 memento on the Internet Archive ), accessed June 3, 2011.
- ↑ Earthquake Report - JAIF, No. 138 ( Memento of July 11, 2011 on WebCite ) (English, pdf). JAIF / NHK, July 10, 2011, (PDF; 188 kB), accessed on July 11, 2011.
- ↑ Implementing Regulation (EU) No. 297/2011 of the Commission . In: Official Journal of the European Union. March 25, 2011, accessed April 5, 2011.
- ↑ Regulation (EEC) No. 944/89 of the Commission of April 12, 1989 laying down maximum levels of radioactivity in foods of minor importance in the event of a nuclear accident or other radiological emergency .
- ↑ Regulation (EEC) No. 2218/89 of the Council of July 18, 1989 amending Regulation (Euratom) No. 3954/87 laying down maximum levels of radioactivity in food and feed in the event of a nuclear accident or other radiological emergency .
- ↑ EU adopts stricter limits for Japanese food . ( Memento from April 8, 2011 on WebCite ) Financial Times Deutschland, April 8, 2011, archived from the original ( August 21, 2011 memento in the Internet Archive ) on April 8, 2011.
- ↑ 20min.ch, May 29, 2012: Radioactivity also in US tuna (June 7, 2012)
- ↑ derwesten.de, May 29, 2012: Tuna carries radioactivity from Fukushima to California (June 7, 2012)
- ↑ After explosion and fire in nuclear power plant: Radiation around Fukushima is increasing . ( Memento from April 21, 2011 on WebCite ) In: tagesschau.de. March 15, 2011, accessed March 15, 2011.
- ↑ Japan: Radioactive food discovered . ( Memento from April 21, 2011 on WebCite ) Deutsche Welle, March 19, 2011, accessed on April 21, 2011.
- ↑ Radioactive iodine beyond limit detected in tap water in Fukushima ( Memento from April 20, 2011 on WebCite ) (English). Kyodo News, March 20, 2011, accessed March 19, 2011.
- ↑ 都 内 の 水道 水中 の 放射 能 調査 結果 (Radioactive material level of tap water at Tokyo) ( Memento from April 20, 2011 on WebCite ) (Japanese). March 25, 2011, accessed March 26, 2011.
- ↑ 東京 都 乳 児 の 家庭 に 水 配 布 へ ( Memento from March 26, 2011 in the Internet Archive ) (Japanese). In: NHK News. March 23, 2011, accessed March 24, 2011.
- ↑ a b Fukushima Nuclear Accident Update Log; Updates of 25 March 2011 ( Memento from April 12, 2011 on WebCite ). IAEA, March 25, 2011, accessed March 26, 2011.
- ↑ City administration issues warning: Radiation in Tokyo's water exceeds limit value . ( Memento from March 24, 2011 in the Internet Archive ) In: tagesschau.de. March 23, 2011, archived from the original ( memento of March 24, 2011 in the Internet Archive ) on April 20, 2011.
- ↑ 都 内 の 降下 物 (塵 や 雨) の 放射 能 調査 結果 (Radioactive material level of fallout in Tokyo / day) ( Memento from April 20, 2011 on WebCite ) (Japanese / English). Tokyo Metropolitan Institute of Public Health, March 25, 2011, accessed March 26, 2011.
- ↑ Detection of radioactive materials in tap water in Fukushima Prefecture and Tokyo ( Memento from April 7, 2011 on WebCite ) (en, pdf). Japanese Ministry of Health, March 23, 2011, (PDF; 195 kB) April 7, 2011, accessed April 7, 2011.
- ^ Fukushima Nuclear Accident Update Log ( April 21, 2011 memento on WebCite ). IAEA, March 26, 2011, accessed April 21, 2011.
- ↑ Seismic Damage Information (the 134th Release) ( Memento from May 29, 2011 on WebCite ) (English). NISA, May 11, 2011, accessed May 29, 2011.
- ↑ a b c d Readings of dust sampling ( Memento from April 11, 2011 on WebCite ) (en). MEXT, March 23, 2011, accessed April 11, 2011.
- ↑ Ex-SKF blog article with comments (English) Ministry of Education Maps of Plutonium and Strontium Show Wide Dispersion of Supposedly Heavy Nuclides
- ^ MEXT Document ( Memento of October 6, 2011 in the Internet Archive ) (in Japanese), published September 30
- ↑ Aya Takada: Cattle Struggling to Survive in Fukushima as Radiation Taints Soil, Water ( Memento from April 8, 2011 on WebCite ) (English). Bloomberg, April 1, 2011, accessed April 8, 2011.
- ↑ Readings of dust sampling (10:00 March 27, 2011) ( Memento from April 11, 2011 on WebCite ) (English). MEXT, March 27, 2011, accessed April 11, 2011.
- ↑ Readings of dust sampling (10:00 March 31, 2011) ( Memento from April 11, 2011 on WebCite ) (English). MEXT, March 31, 2011, accessed April 11, 2011.
- ^ Ed Lyman: IAEA Data Appear to Show Increased Ground Contamination. Why Doesn't the IAEA Just Say So? ( Memento of April 29, 2011 on WebCite ) (English). In: All Things Nuclear. Union of Concernded Scientists, archived from the original on April 29, 2011.
- ↑ Fukushima Nuclear Accident Update Log, Updates of March 21, 2011 ( Memento of April 20, 2011 on WebCite ) (English). IAEA, March 21, 2011, accessed April 18, 2011.
- ^ Fukushima Nuclear Accident Update Log, Updates of 23 March 2011 ( Memento from April 20, 2011 on WebCite ). IAEA, March 23, 2011, accessed April 18, 2011.
- ↑ Fukushima Nuclear Accident Update Log, Updates of 26 March 2011 ( Memento of April 20, 2011 on WebCite ). IAEA, March 26, 2011, accessed April 18, 2011.
- ↑ Fukushima Nuclear Accident Update Log, Updates of 27 March 2011 ( Memento from April 20, 2011 on WebCite ). IAEA, March 27, 2011, accessed April 18, 2011.
- ^ Fukushima Nuclear Accident Update Log, Updates of March 28, 2011 ( Memento of April 2, 2011 on WebCite ). IAEA, March 28, 2011, accessed April 18, 2011.
- ↑ Fukushima Nuclear Accident Update Log, Updates of 30 March 2011 ( Memento from April 20, 2011 on WebCite ) (English). IAEA, March 30, 2011, accessed April 18, 2011.
- ↑ Fukushima Nuclear Accident Update Log, Updates of March 31, 2011 ( Memento April 20, 2011 on WebCite ). IAEA, March 31, 2011, accessed April 18, 2011.
- ↑ Fukushima Nuclear Accident Update Log, Updates of April 1, 2011 ( Memento April 20, 2011 on WebCite ). IAEA, April 1, 2011, accessed April 18, 2011.
- ↑ Fukushima Nuclear Accident Update Log, Updates of April 3, 2011 ( Memento of April 20, 2011 on WebCite ) (English). IAEA, April 3, 2011, accessed April 18, 2011.
- ^ Fukushima Nuclear Accident Update Log, Updates of April 4, 2011 ( Memento of April 20, 2011 on WebCite ). IAEA, April 4, 2011, accessed April 18, 2011.
- ^ Fukushima Nuclear Accident Update Log, Updates of April 5, 2011 ( Memento of April 20, 2011 on WebCite ) (English). IAEA, April 5, 2011, accessed April 18, 2011.
- ^ Fukushima Nuclear Accident Update Log, Updates of April 6, 2011 ( Memento of April 20, 2011 on WebCite ). IAEA, April 6, 2011, accessed April 18, 2011.
- ↑ Fukushima Nuclear Accident Update Log, Updates of April 9, 2011 ( Memento of April 20, 2011 on WebCite ) (English). IAEA, April 9, 2011, accessed April 18, 2011.
- ↑ Fukushima Nuclear Accident Update Log, Updates of April 10, 2011 ( Memento of April 20, 2011 on WebCite ) (English). IAEA, April 10, 2011, accessed April 18, 2011.
- ↑ Fukushima Nuclear Accident Update Log, Updates of April 11, 2011 ( Memento of April 20, 2011 on WebCite ) (English). IAEA, April 11, 2011, accessed April 18, 2011.
- ^ Fukushima Nuclear Accident Update Log, Updates of April 12, 2011 ( Memento April 15, 2011 on WebCite ). IAEA, April 12, 2011, accessed April 18, 2011.
- ↑ Fukushima Nuclear Accident Update Log, Updates of April 13, 2011 ( Memento of April 20, 2011 on WebCite ) (English). IAEA, April 13, 2011, accessed April 18, 2011.
- ↑ Fukushima Nuclear Accident Update Log, Updates of April 13, 2011 ( Memento of April 20, 2011 on WebCite ) (English). IAEA, April 14, 2011, accessed April 18, 2011.
- ↑ Excessive levels of radioactive cesium found 100 km from plant ( Memento from August 21, 2011 on WebCite ) (English). The Mainichi Daily News, August 17, 2011, accessed August 21, 2011.
- ↑ Seismic Damage Information (the 67th Release) ( Memento of April 21, 2011 on WebCite ) (English, pdf). NISA, April 1, 2011, accessed April 3, 2011.
- ↑ Seismic Damage Information (the 258th Release) ( Memento December 11, 2011 on WebCite ) (English, pdf). NISA, September 16, 2011, accessed December 11, 2011.
- ↑ Small amounts of radioactive iodine found in breast milk ( Memento from April 20, 2011 on WebCite ). April 20, 2011, accessed April 20, 2011.
- ↑ Radiation exposure levels near limit for 2 Fukushima nuke workers . ( Memento of May 1, 2011 on WebCite ) The Mainichi Daily News, May 1, 2011, archived from the original ( May 3, 2011 memento on the Internet Archive ) on May 1, 2011, accessed May 1, 2011.
- ↑ Earthquake Report - JAIF, No. 173 ( Memento from August 14, 2011 on WebCite ) (English, pdf). JAIF / NHK, August 14, 2011, (PDF; 184 kB), accessed on August 14, 2011.
- ↑ Earthquake Report - JAIF, No. 256 ( Memento from December 14, 2011 on WebCite ) (English, pdf). JAIF / NHK, November 5, 2011, (PDF; 169 kB), accessed on December 12, 2011.
- ↑ Detection of radioactive materials from the seawater around the discharge canal of Fukushima Daiichi Nuclear Power Station (3rd release) ( Memento from April 20, 2011 on WebCite ) (English). Tepco, March 21, 2011, accessed April 1, 2011.
- ↑ Radiation level in seawater hits new high near Fukushima plant (sample report) ( Memento from April 20, 2011 on WebCite ) (English). Kyodo News, March 31, 2011, accessed April 1, 2011.
- ↑ Radioactivity in the Pacific is rapidly diluting . ( Memento from April 21, 2011 on WebCite ) Badische Zeitung, March 24, 2011, accessed on April 21, 2011.
- ↑ Elisabeth Rosenthal: Radiation, Once Free, Can Follow Tricky Path ( Memento from April 21, 2011 on WebCite ) (English). New York Times, March 21, 2011, archived from the original on April 21, 2011.
- ↑ Extremely high radioactivity measured in the Pacific . ( Memento of April 20, 2011 on WebCite ) March 26, 2011, accessed April 20, 2011.
- ↑ The result of the nuclide analysis of the seawater around the discharge canal (south) of Fukushima Daiichi ( Memento from April 21, 2011 on WebCite ) (English, pdf). Tepco, March 21, 2011, (PDF; 30 kB) April 21, 2011, accessed on March 31, 2011.
- ↑ The result of the nuclide analysis of the seawater around the discharge canal (south) of Fukushima Daiichi ( Memento from April 21, 2011 on WebCite ) (English, pdf). Tepco, March 24, 2011, (PDF; 31 kB) April 21, 2011, accessed April 2, 2011.
- ↑ The result of the nuclide analysis of the seawater around the discharge canal (south) of Fukushima Daiichi ( Memento from April 21, 2011 on WebCite ) (English, pdf). Tepco, March 25, 2011, (PDF; 31 kB) April 21, 2011, accessed on March 31, 2011.
- ↑ The result of the nuclide analysis of the seawater around the discharge canal (south) of Fukushima Daiichi ( Memento from April 21, 2011 on WebCite ) (English, pdf). Tepco, March 26, 2011, (PDF; 8 kB) April 21, 2011, accessed April 6, 2011.
- ↑ The result of the nuclide analysis of the seawater around the discharge canal (south) of Fukushima Daiichi ( Memento from April 21, 2011 on WebCite ) (English, pdf). Tepco, March 27, 2011, (PDF; 8 kB) April 21, 2011, accessed April 1, 2011.
- ↑ The result of the nuclide analysis of the seawater around the discharge canal (south) of Fukushima Daiichi ( Memento from April 21, 2011 on WebCite ) (English, pdf). Tepco, March 28, 2011, (PDF; 8 kB) April 21, 2011, accessed April 1, 2011.
- ↑ The result of the nuclide analysis of the seawater around the discharge canal (south) of Fukushima Daiichi ( Memento from April 21, 2011 on WebCite ) (English, pdf). Tepco, March 30, 2011, (PDF; 31 kB) April 21, 2011, accessed on March 31, 2011.
- ↑ The result of the nuclide analysis of the seawater around the discharge canal (south) of Fukushima Daiichi ( Memento from April 21, 2011 on WebCite ) (English, pdf). Tepco, March 30, 2011, (PDF; 8 kB) April 21, 2011, accessed on March 31, 2011.
- ↑ The result of the nuclide analysis of the seawater around the discharge canal (south) of Fukushima Daiichi ( Memento from April 21, 2011 on WebCite ) (English, pdf). Tepco, March 31, 2011, (PDF; 8 kB) April 21, 2011, accessed April 9, 2011.
- ↑ The result of the nuclide analysis of the seawater around the discharge canal (south) of Fukushima Daiichi ( Memento from April 21, 2011 on WebCite ) (English, pdf). Tepco, March 31, 2011, (PDF; 8 kB) April 21, 2011, accessed March 31, 2011.
- ↑ a b The result of the nuclide analysis of the seawater around the discharge canal (south) of Fukushima Daiichi ( Memento from April 21, 2011 on WebCite ) (English, pdf). Tepco, April 5, 2011, (PDF; 17 kB) April 21, 2011, accessed April 5, 2011.
- ↑ The result of the nuclide analysis of the seawater around the discharge canal (south) of Fukushima Daiichi ( Memento from April 21, 2011 on WebCite ) (English, pdf). Tepco, April 6, 2011, (PDF; 12 kB) April 21, 2011, accessed April 7, 2011.
- ↑ The result of the nuclide analysis of the seawater around the discharge canal (south) of Fukushima Daiichi ( Memento from April 21, 2011 on WebCite ) (English, pdf). Tepco, April 7, 2011, (PDF; 13 kB) April 21, 2011, accessed April 7, 2011.
- ↑ The result of the nuclide analysis of the seawater around the discharge canal (south) of Fukushima Daiichi ( Memento from April 21, 2011 on WebCite ) (English, pdf). Tepco, April 8, 2011, (PDF; 62 kB) April 21, 2011, accessed April 9, 2011.
- ↑ a b c Result of Nuclide Analysis of Seawater (Shore) ( Memento from April 21, 2011 on WebCite ) (English, pdf). Tepco, April 9, 2011, (PDF; 57 kB) April 21, 2011, accessed April 9, 2011.
- ↑ a b Result of Nuclide Analysis of Seawater (Shore) ( Memento from April 21, 2011 on WebCite ) (English, pdf). Tepco, April 10, 2011, (PDF; 13 kB) April 21, 2011, accessed on April 16, 2011.
- ↑ a b Result of Nuclide Analysis of Seawater (Shore) ( Memento from April 21, 2011 on WebCite ) (English, pdf). Tepco, April 16, 2011, (PDF; 25 kB) April 21, 2011, accessed April 16, 2011.
- ↑ a b c Result of Nuclide Analysis of Seawater (Coast) ( Memento from April 24, 2011 on WebCite ) (English, pdf). Tepco, April 24, 2011, (PDF; 16 kB) April 24, 2011, accessed April 24, 2011.
- ↑ a b c Result of Nuclide Analysis of Seawater (Coast) ( Memento from May 1, 2011 on WebCite ) (English, pdf). Tepco, May 1, 2011, (PDF; 78 kB) May 1, 2011, accessed on May 1, 2011.
- ↑ a b 海水 核 種 分析 結果 (沿岸) (Japanese, pdf; 18 kB). Tepco, May 16, 2011, accessed May 17, 2011.
- ↑ a b Result of Nuclide Analysis of Seawater (Coast) ( Memento from June 1, 2011 on WebCite ) (English, pdf). Tepco, May 30, 2011, (PDF; 11 kB) June 1, 2011, accessed June 1, 2011.
- ↑ a b Result of Nuclide Analysis of Seawater (Coast) ( Memento from June 15, 2011 on WebCite ) (English, pdf). Tepco, June 15, 2011, (PDF; 22 kB), accessed on June 15, 2011.
- ↑ a b Result of Nuclide Analysis of Seawater (Coast) ( Memento from July 2, 2011 on WebCite ) (English, pdf). Tepco, July 1, 2011, (PDF; 16 kB), accessed on July 2, 2011.
- ↑ a b Result of Nuclide Analysis of Seawater (Coast) ( Memento from August 17, 2011 on WebCite ) (English, pdf). Tepco, July 16, 2011, (PDF; 60 kB), accessed on August 17, 2011.
- ↑ a b Result of Nuclide Analysis of Seawater (Coast) ( Memento from August 17, 2011 on WebCite ) (English, pdf). Tepco, August 1, 2011, (PDF; 17 kB), accessed on August 17, 2011.
- ↑ a b Result of Nuclide Analysis of Seawater (Coast) (English, pdf; 13 kB). Tepco, September 1, 2011, (PDF; 13 kB), accessed on September 4, 2011.
- ↑ a b Result of Nuclide Analysis of Seawater (Coast) ( Memento from October 4, 2011 on WebCite ) (English, pdf). Tepco, October 1, 2011, (PDF; 35 kB), accessed on October 4, 2011.
- ↑ a b Nuclide Analysis Results of Seawater (Coast) ( Memento from December 14, 2011 on WebCite ) (English, pdf). Tepco, November 1, 2011, (PDF; 16 kB), accessed on December 14, 2011.
- ↑ a b Nuclide Analysis Results of Seawater (Coast) ( Memento from December 14, 2011 on WebCite ) (English, pdf). Tepco, December 1, 2011, (PDF; 16 kB), accessed on December 14, 2011.
- ↑ The result of the nuclide analysis of the seawater around the discharge canal (north) of Unit 5 and 6 ( Memento from April 21, 2011 on WebCite ) (English, pdf). Tepco, March 24, 2011, (PDF; 31 kB) April 21, 2011, accessed April 5, 2011.
- ↑ The result of the nuclide analysis of the seawater around the discharge canal (north) of Unit 5 and 6 ( Memento from April 21, 2011 on WebCite ) (English, pdf). Tepco, March 25, 2011, (PDF; 31 kB) on April 21, 2011, accessed on April 5, 2011.
- ↑ The result of the nuclide analysis of the seawater around the discharge canal (north) of Unit 5 and 6 ( Memento from April 21, 2011 on WebCite ) (English, pdf). Tepco, March 26, 2011, (PDF; 8 kB) April 21, 2011, accessed on April 5, 2011.
- ↑ The result of the nuclide analysis of the seawater around the discharge canal (north) of Unit 5 and 6 ( Memento from April 21, 2011 on WebCite ) (English, pdf). Tepco, March 27, 2011, (PDF; 7 kB) April 21, 2011, accessed April 5, 2011.
- ↑ The result of the nuclide analysis of the seawater around the discharge canal (north) of Unit 5 and 6 ( Memento from April 21, 2011 on WebCite ) (English, pdf). Tepco, March 28, 2011, (PDF; 8 kB) April 21, 2011, accessed April 5, 2011.
- ↑ The result of the nuclide analysis of the seawater around the discharge canal (north) of Unit 5 and 6 ( Memento from April 21, 2011 on WebCite ) (English, pdf). Tepco, March 30, 2011, (PDF; 31 kB) April 21, 2011, accessed April 5, 2011.
- ↑ The result of the nuclide analysis of the seawater around the discharge canal (north) of Unit 5 and 6 ( Memento from April 21, 2011 on WebCite ) (English, pdf). Tepco, March 30, 2011, (PDF; 8 kB) April 21, 2011, accessed April 5, 2011.
- ↑ The result of the nuclide analysis of the seawater around the discharge canal (north) of Unit 5 and 6 ( Memento from April 21, 2011 on WebCite ) (English, pdf). Tepco, April 1, 2011, (PDF; 16 kB) April 21, 2011, accessed April 5, 2011.
- ↑ The result of the nuclide analysis of the seawater around the discharge canal (north) of Unit 5 and 6 ( Memento from April 21, 2011 on WebCite ) (English, pdf). Tepco, April 2, 2011, (PDF; 16 kB) April 21, 2011, accessed on April 5, 2011.
- ↑ The result of the nuclide analysis of the seawater around the discharge canal (north) of Unit 5 and 6 ( Memento from April 21, 2011 on WebCite ) (English, pdf). Tepco, April 3, 2011, (PDF; 19 kB) April 21, 2011, accessed on April 5, 2011.
- ↑ The result of the nuclide analysis of the seawater around the discharge canal (north) of Unit 5 and 6 ( Memento from April 21, 2011 on WebCite ) (English, pdf). Tepco, April 4, 2011, (PDF; 43 kB) April 21, 2011, accessed April 5, 2011.
- ↑ The result of the nuclide analysis of the seawater around the discharge canal (north) of Unit 5 and 6 ( Memento from April 21, 2011 on WebCite ) (English, pdf). Tepco, April 5, 2011, (PDF; 15 kB) April 21, 2011, accessed on April 5, 2011.
- ↑ a b The result of the nuclide analysis of the seawater around the discharge canal (north) of Unit 5 and 6 ( Memento from April 21, 2011 on WebCite ) (English, pdf). Tepco, April 6, 2011, (PDF; 12 kB) April 21, 2011, accessed April 8, 2011.
- ↑ a b The result of the nuclide analysis of the seawater around the discharge canal (north) of Unit 5 and 6 ( Memento from April 21, 2011 on WebCite ) (English, pdf). Tepco, April 7, 2011, (PDF; 13 kB) April 21, 2011, accessed April 8, 2011.
- ↑ a b The result of the nuclide analysis of the seawater around the discharge canal (north) of Unit 5 and 6 ( Memento from April 21, 2011 on WebCite ) (English, pdf). Tepco, April 8, 2011, (PDF; 62 kB) April 21, 2011, accessed April 9, 2011.
- ↑ The result of the nuclide analysis of the seawater around 15km off shore of Fukushim Daiichi Nuclear Power Station ( Memento from April 21, 2011 on WebCite ) (English, pdf). Tepco, April 5, 2011, (PDF; 11 kB) April 21, 2011, accessed April 7, 2011.
- ↑ The result of the nuclide analysis of the seawater around 15km off shore of Fukushim Daiichi Nuclear Power Station ( Memento from April 21, 2011 on WebCite ) (English, pdf). Tepco, April 6, 2011, (PDF; 12 kB) April 21, 2011, accessed April 7, 2011.
- ↑ The result of the nuclide analysis of the seawater around 15km off shore of Fukushim Daiichi Nuclear Power Station ( Memento from April 21, 2011 on WebCite ) (English, pdf). Tepco, April 7, 2011, (PDF; 12 kB) April 21, 2011, accessed April 7, 2011.
- ↑ The result of the nuclide analysis of the seawater around 15km off shore of Fukushim Daiichi Nuclear Power Station ( Memento from April 21, 2011 on WebCite ) (English, pdf). Tepco, April 8, 2011, (PDF; 10 kB) April 21, 2011, accessed April 9, 2011.
- ↑ Result of nuclides Analysis of Seawater (Offshore) ( Memento of 11 May 2011 on Webcite ) (pdf). Tepco, May 11, 2011, (PDF; 16 kB) May 11, 2011, accessed on May 11, 2011.
- ↑ a b c Result of Nuclide Analysis of Radioactive Materials at the Site ( Memento June 18, 2011 on WebCite ) (English). Tepco, June 18, 2011, (PDF; 398 kB), accessed on June 18, 2011.
- ↑ Readings of Sea Area Monitoring at Post Out of Fukushima Dai-ichi NPP ( Memento from April 21, 2011 on WebCite ) (English, pdf). MEXT, April 8, 2011, accessed April 16, 2011.
- ↑ Readings of Sea Area Monitoring at Post Out of Fukushima Dai-ichi NPP ( Memento from April 21, 2011 on WebCite ) (English, pdf). MEXT, April 16, 2011, accessed April 16, 2011.
- ↑ a b Earthquake Report - JAIF No. 51: 20:00, April 13 . ( Memento from April 13, 2011 on WebCite ) JAIF / NHK, April 13, 2011, (PDF; 124 kB) on April 13, 2011, accessed on April 13, 2011.
- ↑ Greenpeace marine radiation monitoring blocked by Japanese government ( Memento of April 29, 2011 on WebCite ). Greenpeace, April 28, 2011, accessed April 28, 2011.
- ↑ Results of the Nuclide Analysis of Seawater (Offshore of Ibaraki Prefecture) ( Memento June 14, 2011 on WebCite ) (English, pdf). Tepco, April 30, 2011, (PDF; 32 kB), accessed on June 14, 2011.
- ↑ Tepco press releases , accessed on June 14, 2011.
- ↑ The results of nuclide analyzes of radioactive materials in the ocean soil ( Memento of May 3, 2011 on WebCite ) (English, pdf). Tepco, May 3, 2011, (PDF; 13 kB) May 3, 2011, accessed on May 3, 2011.
- ↑ Earthquake Report - JAIF, No. 71 ( Memento of May 4, 2011 on WebCite ) (English, pdf). May 4, 2011, (PDF; 211 kB) on May 4, 2011, accessed on May 4, 2011.
- ↑ Fukushima excites shipping . ( Memento from April 16, 2011 on WebCite ) Handelsblatt, March 30, 2011, accessed on April 16, 2011.
- ^ Fukushima — Atmospheric Transport ( Memento from April 21, 2011 on WebCite ) (English). Norsk institutt for luftforskning, April 14, 2011, accessed on April 21, 2011.
- ^ Fission Products in Seattle Reveal Clues about Japan Nuclear Disaster . ( Memento of March 28, 2011 on WebCite ) Technology Review, MIT, March 25, 2011, accessed March 27, 2011.
- ↑ Arrival time and magnitude of airborne fission products from the Fukushima, Japan, reactor incident as measured in Seattle, WA, USA . arxiv.org, March 24, 2011, accessed March 27, 2011.
- ↑ Daily Data Summary, Japanese Nuclear Emergency: Radiation Monitoring ( Memento April 2, 2011 on WebCite ). In: epa.gov. United States Environmental Protection Agency, April 1, 2011, accessed April 2, 2011.
- ↑ Traces of radiation . In: sueddeutsche.de. March 22, 2011, accessed on April 21, 2011. Archived print version ( Memento from April 21, 2011 on WebCite )
- ↑ Fukushima radioactive fallout nears Chernobyl levels ( Memento of 21 April 2011 Webcite ) (English). In: newscientist.com. March 24, 2011, accessed April 21, 2011.
- ^ Fukushima: Summary of previous calculations and CTBTO measurements . ( Memento from April 2, 2011 on WebCite ) In: zamg.ac.at. Central Institute for Meteorology and Geodynamics, March 25, 2011, accessed on April 2, 2011.
- ↑ CTBTO World Map . Retrieved March 27, 2011.
- ↑ a b c Current situation after the accident in Fukushima (Update: April 2, 2011 12:00) . ( Memento from April 20, 2011 on WebCite ) In: www.zamg.ac.at. Central Institute for Meteorology and Geodynamics, April 2, 2011, accessed on April 2, 2011.
- ↑ Ticker on the disaster in Japan . ( Memento from April 12, 2011 on WebCite ) Financial Times Deutschland, April 7, 2011, archived from the original ( August 31, 2011 memento in the Internet Archive ) on April 12, 2011, accessed on April 7, 2011.
- ^ A b Accident at the Japanese nuclear power plant in Fukushima . ( Memento from April 20, 2011 on WebCite ) ZAMG, March 22, 2011, accessed April 20, 2011.
- ↑ a b c d e f g INES (the International Nuclear and Radiological Event Scale) Rating on the Events in Fukushima Dai-ichi Nuclear Power Station by the Tohoku District - off the Pacific Ocean Earthquake ( Memento from April 12, 2011 on WebCite ) (English, pdf). NISA / METI, April 12, 2011, accessed April 12, 2011.
- ↑ a b Abstracts of the cross check analysis on the evaluation of the cores of Unit 1, 2 and 3 of Fukkushima Dai-ichi NPP reported by TEPCO ( Memento from June 13, 2011 on WebCite ). NISA / Kantei, June 7, 2011, (PDF; 2.6 MB), accessed June 14, 2011.
- ↑ a b No.1 reactor vessel damaged 5 hours after quake ( Memento from June 6, 2011 on WebCite ) (English). NHK, June 6, 2011, archived from the original ( April 9, 2011 memento in the Internet Archive ), accessed June 6, 2011.
- ^ Chernobyl: Assessment of Radiological and Health Impact, Chapter 2 . ( Memento of April 20, 2011 on WebCite ) 2002, accessed April 6, 2011.
- ↑ a b c d Earthquake Report - JAIF, No. 64: 20:00, April 26 ( Memento from April 27, 2011 on WebCite ) (English, pdf). JAIF / NHK, April 26, 2011, (PDF; 91 kB) April 27, 2011, accessed April 27, 2011.
- ^ A b Report of Japanese Government to the IAEA Ministerial Conference on Nuclear Safety / VI. Discharge of radioactive materials to the environment ( Memento from June 8, 2011 on WebCite ). NISA / Kantei, June 7, 2011, (PDF; 102 kB), accessed June 8, 2011.
- ↑ NSC Recalculates Total Amount of Radioactive Materials Released ( Memento from December 20, 2011 on WebCite ) (English, pdf). In: Atoms in Japan. JAIF, September 5, 2011, (PDF; 45 kB), accessed December 20, 2011.
- ↑ Earthquake Report - JAIF, No. 177 ( Memento of August 21, 2011 on WebCite ) (English, pdf). JAIF / NHK, August 18, 2011, accessed on August 21, 2011. Converted from 200 MBq / h in a two-week period.
- ↑ Earthquake Report - JAIF, No. 182 ( Memento from August 31, 2011 on WebCite ) (English, pdf). JAIF / NHK, August 23, 2011, (PDF; 78 kB), accessed on August 31, 2011.
- ↑ a b Report regarding the impact due to the discharge of drained water with concentrations of radioactive materials exceeding discharge standard to the ocean (summary) ( Memento from May 23, 2011 on WebCite ) (English). Tepco, May 21, 2011, (PDF; 12 kB), accessed on May 23, 2011.
- ↑ a b Dagmar Röhrlich: The accident and the sea - How the radioactive pollution will spread in the oceans. ( Memento from December 11, 2011 on WebCite ) In: dradio.de, Research News. Deutschlandfunk, September 5, 2011, accessed on September 7, 2011; 1 quadrillion Becquerel = 1,000 TBq.
- ↑ Earthquake Report - JAIF, No. 199 ( Memento of December 11, 2011 on WebCite ) (English, pdf). JAIF / NHK, September 9, 2011, (PDF; 79 kB), accessed on December 11, 2011.
- ↑ Earthquake Report - JAIF, No. 250 ( Memento from December 20, 2011 on WebCite ) (English, pdf). JAIF / NHK, November 30, 2011, (PDF; 184 kB), accessed December 20, 2011.
- ↑ Madec G 2008 NEMO ocean engine - version 3.1 Note du Pole de modélisation No. 27 (Institute Pierre-Simon Laplace (IPSL))
- ^ E. Behrens, FU Schwarzkopf, JF Lübbecke, CW Böning: Model simulations on the long-term dispersal of 137Cs released into the Pacific Ocean off Fukushima. In: Environmental Research Letters. Vol. 7, 2012. (GEOMAR | Helmholtz Center for Ocean Research Kiel, NOAA / PMEL) Original article at IOPScience
- ↑ Fukushima - Where's the radioactive water? Eddies cause strong mixing in the Pacific Article on the homepage of the Cluster of Excellence Ocean of the Future from July 9, 2012.
- ↑ Radioactive water from Fukushima has crossed half the Pacific , scinexx.de, accessed on September 30, 2012.
- ↑ Christoph Neidhart: The fishermen from Fukushima remain unemployed on tagesanzeiger.ch from December 9, 2014, accessed on December 9, 2014.
- ↑ Japan is fighting the worst-case scenario; Significant damage found in reactor 3 . ( Memento from April 8, 2011 on WebCite ) In: tagesschau.de. ARD, March 25, 2011, accessed April 8, 2011.
- ↑ How radioactive is the water from the nuclear power plant in Fukushima? . ( Memento of April 8, 2011 on WebCite ) FOCUS, April 5, 2011, accessed April 8, 2011.
- ↑ Nuclear disaster in Fukushima: radioactivity from Japan in Canadian drinking water . ( Memento of April 20, 2011 on WebCite ) Financial Times Deutschland, April 5, 2011, archived from the original ( April 7, 2011 memento in the Internet Archive ) on April 20, 2011, accessed on April 8, 2011.
- ^ Thuringia to Fukushima: Conversation with Peter Bretschneider . ( Memento from April 20, 2011 on WebCite ) In: thueringer-allgemeine.de. April 6, 2011, accessed April 8, 2011.
- ↑ Radiant everyday life - How much radioactivity we are exposed to every day - and when it is harmful . ( Memento of April 8, 2011 on WebCite ) NZZ, March 17, 2011, accessed on April 8, 2011.
- ↑ The situation in the Fukushima nuclear power plant is coming to a head - the nuclear power plant temporarily evacuated . ( Memento of April 8, 2011 on WebCite ) News Magazin 24, March 16, 2011, accessed April 8, 2011.
- ↑ Earthquake Report - JAIF, No. 45: 20:00, April 7 . ( Memento from April 9, 2011 on WebCite ) JAIF / NHK, April 7, 2011 (PDF; 167 kB) on April 9, 2011, accessed on April 9, 2011.
- ^ Increases in perinatal mortality in prefectures contaminated by the Fukushima NPP accident
Coordinates: 37 ° 25 '17 " N , 141 ° 1' 57" E