
Eyjafjallajökull eruption in 2010
The eruption of the Eyjafjallajökull volcano ( [ ˈɛɪjaˌfjatl̥aˌjœkʏtl̥ ] ) in 2010 began on March 20.


The eruption of the Eyjafjallajökull volcano , which is located under the glacier of the same name, had a large-scale impact beyond Iceland . In particular, air traffic in large parts of northern and central Europe was suspended in mid-April 2010 due to the volcanic ash that had leaked out , which was an unprecedented disruption to air traffic in Europe as a result of a natural event.
Surveillance of the Eyjafjallajökull area and the origin of the scientific data
In Iceland, two institutions are working together to monitor the volcanoes, including Eyjafjallajökull. This is on the one hand the Vulcanological Institute of the University of Iceland ( Nordic Volcanological Center ) and on the other hand the Icelandic Meteorological Office , which z. B. is responsible for earthquake measurements, water level measurements and the prediction of movements of the ash clouds. This explains why the two institutions jointly published daily reports on the status of the eruption in Icelandic and English.
Chronology of events


Sign of the outbreak
As early as 1999, increased earthquake activity at Eyjafjallajökull and Mýrdalsjökull was noted. In the winter of 1999 to 2000 these earthquakes were concentrated on the Eyjafjallajökull, and in the autumn of 2000 a small glacier run in the Lambfellsá river was detected, the chemical composition of which came from the volcano. From both events, the volcanologists concluded that magma accumulated in southern Eyjafjallajökull.
Since the end of January 2002, two new crevices at the summit crater of Eyjafjallajökull between Goðasteinn and Guðnasteinn were known, from which sulfur dioxide-saturated steam rose. Since then, monitoring of the mountain had been intensified.
Easter 2009 began a phase of increased seismic activity in the area of Eyjafjallajökull with thousands of small earthquakes, most of which reached a magnitude between 1 and 2 and had their hypocenter mainly at depths of seven to ten kilometers below the volcano.
From the beginning of February 2010, GPS measurements showed significant changes in the surface of the volcano. The Icelandic Meteorological Office and the University of Iceland had set up the devices in numerous places around the volcano, including at the Þorvaldseyri farm about 15 kilometers southwest of the eruption site at Fimmvörðuháls. The evaluation of the results showed a deformation of the earth's crust directly at Eyjafjallajökull by up to 15 centimeters, whereby the crust had deformed several centimeters in places within the last four days before the eruption.
The unusually high number of earthquakes, together with the rapid expansion of the crust, resulted in magma flowing in below the surface of the earth.
In the following weeks the number of measured earthquakes increased and reached a preliminary peak with 3000 earthquakes, which were recorded between March 3rd and 5th, 2010. Most tremors were relatively weak (less than magnitude 2); but precisely these are often indicators of a preparatory outbreak. Some were also above magnitude 2 and could be felt in nearby locations.
On March 19, the series of earthquakes shifted slightly to the east and upwards ( earthquake centers four to seven kilometers deep).
Another shift to the east was noted on March 21; some of the earthquake foci were close to the surface.
Eruptions at Fimmvörðuháls: March 20 to April 12, 2010
On March 20, 2010, just before midnight, the volcano's first eruption began, an effusive eruption as it turned out to be. The outbreak site was on the Fimmvörðuháls plateau between Eyjafjallajökull and Mýrdalsjökull. The neighboring region of Fljótshlíð and the south coast between Hvolsvöllur and Vík í Mýrdal with around 500 residents have been temporarily evacuated.
At around 10:30 p.m. on March 21, 2010, the measuring devices detected weak unrest and volcanic tremors in three locations that were closest to Eyjafjallajökull. At around the same time, the news came that a volcanic eruption had started on the glacier. Soon after, it became clear that the eruption was on the Fimmvörðuháls plateau between Eyjafjallajökull and Mýrdalsjökull.
Evacuation measures
As a precaution, the immediate vicinity of the volcano in the districts of Fljótshlíð , Eyjafjöll and Landeyjar was evacuated, with 500 people being brought to safety. The airports of Reykjavík and Keflavík were closed at short notice . However, the international airport was reopened to traffic on the evening of March 21st.
Almost all of the residents of the zone around the volcano were able to return to their homes on March 22, 2010. However, the roads to the Þórsmörk and the Fimmvörðuháls pass were still closed on March 27, 2010.
Lava flows on the first days of the eruption

Until March 27, 2010, it was largely an effusive volcanic eruption that produced lava fountains up to 150 meters high from 10–12 craters along a roughly 500-meter-long fissure. The lava was about 1000–1200 ° C hot, of an alkali basaltic composition and fluid.
The liquid lava flowed about two kilometers to the northeast and then first into the Hrunagil Gorge , where it formed a lava fall more than 200 meters high.
On March 25, 2010, scientists managed for the first time to trace the formation of pseudocraters .
In the first two days of the eruption, an expansion of the earth's crust at Eyjafjallajökull was found, but this decreased with increasing eruptive activity. The scientists assumed that the volume of the magma entering the magma chamber roughly corresponded to the eruptive mass and that the eruption had thus found a certain equilibrium.
The geophysicist Magnús Tumi Guðmundsson explained that the eruption has so far been relatively small compared to that of the Hekla in 2000. This could change, however, if the eruption center were to move under the glacier. This would also result in the risk of glacier runs . The radars of the Icelandic Meteorological Office did not detect any significant ash fall in the first two days; some ash did not fall in Fljótshlíð and Hvolsvöllur until the evening of March 22nd .
The lava flow split on March 26th, and a larger part formed a lava fall in the Hvannagil , a gorge west of the Hrunagil . On March 27, towards evening, another part of the lavas broke through the south face of a crater and moved towards the hiking trail from Skógar to Fimmvörðuháls, which was closed.
On the evening of March 28, a third stream had formed, which flowed into the Hrunagil gorge via a “lava fall” between the other two. Magnús Tumi Guðmundsson explained that the flow rate has not decreased and is around 20-30 cubic meters per second.
Eruption clouds

On March 22 at around 7 a.m., an eruption cloud rose from the eruption site to an altitude of around 4,000 meters. On March 23, 2010, such a cloud reached a height of 7,000 meters.
Amount of water in the rivers Krossá and Hruná
On March 22, 2010 at around 10 a.m., a sudden, brief increase in the amount of water and temperature in the Krossá River was detected. This was attributed to the nearby eruptive activity.
On March 27, 2010, a group of geologists drove to investigate the Hrunagil gorge, into which lava has now flowed. The water of the river Hruná steamed. The geologists estimated the water temperature to be 50–60 ° C. They also suspected a small glacier run in the Hruná because an increased amount of water had been measured for a short time.
Ejected rock and fluorine content
The analysis of volcanic ash and lavas at the eruption site showed the basic constituents of silicon dioxide (47%) and aluminum oxide (16%) with a trace amount of 0.1 grams of fluoride per kilogram. The higher catapulted ash particles can contain much higher levels of fluorine (up to 0.5 grams per kg). Since the fluoride in water and feed could have a negative effect on calcium utilization , the farmers in the area were advised to keep their animals in the barn if possible and to give them plenty of (pure) water and feed. Livestock farming is extremely important in the south of Iceland, where around 28 percent of the workforce is on farms.
Further analysis of the ejected material revealed that it was magma that was brought to the surface of the earth without stopping in a magma chamber . In addition, the chemical composition of these ejecta materials was found to be strikingly similar to that of Katla eruptions .
Lava temperature and lava output

A few days after the start of the eruption, satellite measurements by NASA were able to determine an output of over six tons of lava per second with a thermal output of more than one gigawatt. The latest satellite technology was used for the measurements, with satellite observations on March 24, 29 and 30, 2010.
According to measurements by scientists on March 31, 2010, the temperature in the newly flowing lavas was around 800 ° C and in the lava columns around 640 ° C. Such measurements were probably made in Iceland for the first time, but previously in Kamchatka and Hawaii .
According to measurements by the Geological Institute of the University of Iceland, the lava output up to April 7, 2010 was around 22-24 million cubic meters, which corresponds to an average lava production of 15 cubic meters or 30 to 40 tons per second. These lavas covered 1.3 square kilometers and the thickness of the lava field was 10-20 meters. These are block lavas .
The volcanic eruption created two new small mountains by April 7, 2010: The older crater reached a height of 82 meters above its surroundings; the younger crater grew to 47 meters.
New eruption crevice at Fimmvörðuháls March 31, 2010 and lava flow into the Hvannárgil gorge


On March 31, 2010, the lava flow began to split. From then on, part of it flowed into the Hvannárgil gorge, which lies to the west of the Hrunagil.
On the evening of the same day at around 7 p.m., a new, approximately 300-meter-long eruption crevice on Fimmvörðuháls opened completely unexpectedly in front of the eyes of scientists and the curious. The earthquake and tremor measuring devices had not indicated any vibrations indicating this.
From both crevices a lava flow poured into the Hvannárgil Gorge, while lava continued to flow into the Hrunagil Gorge to the east, so that two lava falls could now be seen. From time to time there were steam explosions when the lavas came into contact with snow.
On April 6, 2010, a 3.7 magnitude earthquake was measured under eastern Eyjafjallajökull. The hypocenter was exactly where scientists suspect an underground bend in the outbreak canal.
On April 7, 2010, the eruption in the older eruption fissure stopped. In contrast, the lava ejection in the other craters continued.
Signs of subsiding eruption at Fimmvörðuháls from April 12, 2010
On April 12, 2010, another somewhat stronger earthquake with a magnitude of 3.2 was measured at Eyjafjallajökull. The tremor , which decreased very sharply on the same day, was interpreted as a sign that the eruption or the eruption phase was nearing its end.
The fact that GPS devices, among others in Básar on April 9 and 10, 2010, showed a shift of 2–3 centimeters in one day to the south and at the same time downwards, indicated a decrease in the tension of the earth's crust and thus the eruption pressure down.
The eruption on the summit caldera: April 14th to July 9th, 2010


A much stronger, mostly explosive eruption began on April 14th in the southern part of the ice-filled summit caldera below the highest peak of Eyjafjallajökull.
First eruption: April 13-17, 2010
On the night of April 13-14, 2010, an earthquake with a magnitude of 2.5 was measured in southern Eyjafjallajökull. After an earthquake swarm, the earthquake measuring devices also showed a strong increase in the low-frequency tremor around 1 a.m., which means that the magma had reached the surface of the earth at this time.
On the morning of April 14, 2010, a two-kilometer long crevice broke directly in the volcano's summit caldera . Large amounts of lava emerged from five craters. Clouds of steam and ash several thousand meters high rose above the glacier. The area was evacuated again.
Smaller glacier runs caused the water level of the Markarfljót river to rise sharply . The water level reached its peak around noon, when the current swelled up to a width of up to three kilometers. The water mainly flowed on the northern side of Eyjafjallajökull from the Gígjökull valley glacier through the Lónið glacial lake in the Þórsmörk valley into the Krossá river and from there into the Markarfljót. The glacial lake disappeared after the first flooding. Also south of the glacier, near the Þorvaldseyri farm, a larger stream emerged from under the glacier. Ring road No. 1 , which runs on a dam, was torn down in places near the Seljalandsfoss waterfall and near the large Markarfljót bridge to relieve the bridge.
It was a phreatomagmatic eruption : When the rising magma in the crater comes into contact with water in various forms, such as glacier ice, it is cooled very quickly and torn into tiny particles, which form an ash cloud.
The ash cloud rose around four kilometers several times that day, but then became lower again. Ash fell on the areas in the south and east of the volcano, which had been evacuated as a precaution.
Analyzes by the University of Iceland on April 18, 2010 show that the ash layer in the immediate vicinity of the volcano on an approx. 10 km wide strip in the inhabited area south of the mountain on the coast after the first 4 days of eruption 0.5–5.5 cm Thickness reached. Media reports from April 18 showed how even the volcanic ash turned day into night directly south and east of the volcano. The ashes there covered streets and vehicles inches thick.
On April 15, the earthquake gauges indicated that the tremor was alternately growing and subsiding. This pattern was also seen in the Grímsvötn eruptions and it points to a certain interaction between magma and water.
Another tidal wave about two meters high shot down the Markarfljót around 8 p.m. The water level stayed at this height until 9:30 p.m.
When flying over the summit, the new craters within the summit crater could be made out on radar devices.
There were several lightning bolts in the ash cloud immediately above the crater. The ash cloud settled in the east for the first few days and reached as far as Poland on April 16. It reached a height of 8,000 m several times, but mostly moved in heights of 5,000 m. In doing so, it considerably hindered air traffic throughout Europe, especially since it consisted for the most part of very small particles.
As early as April 16, it was possible to see from GPS devices that the pressure inside the volcano had subsided.
On April 17th, the eruption column still reached a height of 8 km.
Second eruption: April 18 to April 30, 2010
From April 18, the volcano continued to produce ash more or less regularly, but at a significantly lower rate. The eruption column kept disappearing from radar range, meaning it was lower than 3000 m. Within the next few days, the height of the eruption column was between 3000 and 5000 m. On April 29, 2010, a special aircraft from the DLR ( German Aerospace Center ) came to Iceland to help with the analysis of the ash cloud and fine dust.
Presumably from April 19, lava began to flow below the ice sheet from a crater in the southwest of the small summit caldera. This triggered small glacier runs from the Gígjökull, the highest level with 250 m³ / s at the bridge over the Markarfljót . The average amount of water was also increased accordingly and on April 28 and 29, 2010 was 130–150 m³ / s. The Steinholtsá and Krossá rivers showed increased electrical conductivity since April 28th . On April 30, a new crater had formed within the caldera, from which lava flowed north.
Explosion noises from the crater could be heard far away. The explosions are due to the rising of viscous magma.
The volcanic tremor on the earthquake gauges remained more or less constant in the following days, with a slightly increasing tendency.
Third eruption phase: from May 1, 2010
May 1-10, 2010: Mixed eruption
From May 1, 2010, activity increased again, the eruption column again reached a height of 5.5 km and was driven towards the southeast by the turning wind.
The tremor measuring devices showed a clearly rising curve from May 1, 2010 (up to May 4).
It was now a mixed eruption that was both explosive with the production of ash and effusive with the production of lavas, which began to flow under the valley glacier Gígjökull and thawed it from below. On May 2, these lavas could be traced up to 3 km from the main crater. White clouds of steam over the side glacier indicated this. Lava production was estimated at around 20 m³ / s (i.e. 50 t / s) and ash production on May 2nd at around 10-20 t / s.
The ash cloud reached heights of approx. 5,500 m on May 3rd and up to 6,000 m on May 4th. Ashes fell on May 4th in Álftaver and Meðalland , d. H. on the Mýrdalssandur east of the Katla . Furthermore, one could see dark clouds over the main crater and on the other hand light clouds of water vapor over Gígjökull.
At the Gígjökull valley glacier, explosion noises were heard and toxic degassing was detected.
Meltwater emerged from Gígjökull in large quantities at regular intervals - the temperature of the same was so high that the Markarfljót river was briefly heated to 17 ° C on May 3 in the morning at 6 a.m., later the temperature dropped again to 4 ° C which is normal for the time of year.
A cinder cone formed within the summit caldera. It measured 280 × 150 m on May 4th and hurled slag a few hundred meters into the air.
On May 2nd, a deflation of the volcano was determined based on GPS measurements. In contrast, the GPS devices moved away from the volcano on May 4th and 5th - an inflation that suggests a renewed magma intrusion.
On May 5, a series of earthquakes with epicentres at different depths were found. The earthquakes also indicate the location of a magma chamber about 3-5 km deep.
On May 10, 2010, the scientists involved in the analysis concluded, based on the location of the hypocenters of earthquakes, that magma rose directly from the earth's mantle. At the same time there was a slight increase in the intensity of the outbreak.

On the next few days (May 11-14, 2010) there was no indication of an end to the outbreak, which continued unabated.
May 14-18: More explosive activity
Rather, the eruption intensified again as a result of a series of earthquakes that began around midnight on May 14 and lasted until 3 a.m. on May 15 (over 30 quakes). The eruption column sometimes reached a height of 8,000 m, over 20 lightning bolts were detected in it (by the British Meteorological Office in London). Ashes fell and drifted at the foot of the volcano in the south. The development continued up to and including May 16th. The amount of lava and ash produced was estimated at 150–200 t / s, with higher activity up to 400 t / s. The explosive eruption continued on May 17th with undiminished strength, even somewhat increasingly and with an eruption column of approx. 9,000 m height.
This time a roar was also heard in Hafnarfjörður , that is more than 100 km away from the place of the eruption. On May 18th, strong winds blew, so that on the one hand the eruption column reached a lower height of 7,000 m, on the other hand the ashes were distributed to Reykjavík, among other places. Ashfall was also found in Vopnafjörður , approx. 300 km northeast .
May 19 to July 9, 2010: The eruption subsided
On May 19 and 20 the eruption finally subsided sharply and reduced to a production of 50 t / s. At the same time, the height of the eruption column decreased.
On the following two days, the eruption rate continued to decrease rapidly to around 5 t / s. The eruption column only reached 1,500 m height. On May 22, 2010 there were still explosions in the crater, but the activity itself was as low as the day before, and the GPS devices also showed a clear sinking of the mountain towards the center.
As of May 23, 2010, the eruption was low. Only now and then did you discover smaller steam explosions and the associated clouds. On May 25, the amount of gas that was accumulating around the main crater was noticed, the bluish color and the smell that the scientists flying over the crater detected, suggesting a high sulfur dioxide content .
On May 24th, the volcano was classified as "inactive" by scientists at the University of Iceland. At the same time, however, they stated that it was still unclear whether it would really have come to rest in the long term, as the last eruption of Eyjafjallajökull had lasted thirteen months with interruptions.
On the first days of June the column of steam reached a height of 2–2.5 km. Strong winds spread the ashes over the south and west of the country.
Eventually the activity of the volcano picked up again on June 7, 2010. Explosions produced more ashes again, the eruption column rose to 6,000 m. By June 10th, however, the situation calmed down again, the rising steam column was white again.
From June 11th, the main crater began to fill with condensation from the glacier. Initially, there were fears that the glacier would run, but these fears were dashed when the water level in the crater rose very slowly.
By June 26, the situation had calmed down so much that the institutions involved, i.e. the Icelandic Meteorological Office and the Volcanological Institute of the University of Iceland, decided to stop their daily announcements as much as possible. There were only isolated steam explosions and the associated clouds of steam, and the GPS devices mostly indicated that the mountain was sinking further towards the middle. The seismological measurements agreed with these indications, i.e. the tremor activity largely corresponded to that before the eruption.
The last report so far is from July 9, 2010, when a 9,000 m high column of steam was discovered above the mountain. She had been seen the night before - in Iceland this is the time of the midnight sun. However, the cloud consisted only of water vapor and no other side effects were found.
In view of the known eruption behavior of Eyjafjallajökull, the scientists involved did not want to finally declare the eruption to be over.
On December 9, 2010, the status of the volcano was lowered to the lowest alert level (“unsafe” / “uncertain”).
Igneous rock: composition and approximate amounts

The chemical analysis revealed that the erupted materials were intermediate rock (58% Si), more precisely trachyandesite with a relatively high fluorine content .
After the first three days of the eruption, the approximate amount of erupted material was given as follows: approx. 30 million m³ precipitated in the summit crater; approx. 10 million m³ made the glacial lake Lónið disappear and filled it up; as an ash cloud about 100 million m³, a total of 140 million m³. This corresponds to around 70–80 million m³ of magma. It was 10-20 times the amount of igneous rocks compared to the first eruption at Fimmvörðuháls. As of April 21, 2010, the production of igneous material had fallen sharply and was estimated by the Geological Institute of the University of Iceland to be less than 30 m³ / s magma, or 75 t / s. In addition, lower explosive activity was found.
The total amount of igneous rock stated was> 1.4 · 10 8 m³ of tephra and> 1.4 · 10 7 m³ of lava. Thus, the eruption reached a strength of 4 on the volcanic explosion index , whereby no distinction was made between the eruptions at Fimmvörðuháls and those at the main crater of Eyjafjallajökull.
First cause analyzes for the two outbreaks in March and from April 2010

According to an interview by MSN with Icelandic volcanologist Freysteinn Sigmundsson , the explosiveness of the eruption from the summit craters of Eyjafjallajökull is mainly due to the meeting of different types of magma from different sources. A research group led by the head geophysicist Magnús Tumi Guðmundsson also agrees with the hypothesis of the mixing of magmas of different origins and compositions.
Since periods of unrest had been observed in the volcano over the past 20 years, the responsible scientists carefully monitored the development during this time.
When the volcano finally erupted, the scientists found that, contrary to the popular idea of a central magma chamber, the magma here evidently flowed together from 2 or more different sources, which could possibly be typical for volcanoes with less activity at the edge zones. First and foremost, it was the interaction of the different types of magma when they met that made the eruption explosive, according to Freysteinn Sigmundsson. According to petrochemical analyzes, the main components were on the one hand a basic magma of the basalt type and on the other hand a silicate-rich trachyandesite magma.
The origin from different smaller magma chambers and sources also resulted from inflation and deflation (the swelling and swelling) of the volcano in different places. The magma chamber, which had been found to have expanded, had not emptied after the eruption for the first few days, but the magma apparently came from another source. This was not only indicated by geodetic measurements, but also by the location of the epicentres of the earthquakes involved.
In the opinion of the volcanologist, it is very important to determine the location of such magma sources as precisely as possible, as well as the construction and connection of magma channels, since they provide important information about the role of intrusions in the initial phase of a volcanic eruption. Research results in this regard could in the future also be transferred to other volcanoes, for example on the Pacific Ring of Fire , and could provide assistance in predicting eruptions from less active volcanoes.
Further empirical results confirm these analyzes and point to a build-up of magma intrusions over about 20 years, with magma being deposited in smaller chambers that deformed the volcano (inflation, i.e. swelling), which ultimately led to the first effusive eruption. However, since there was no significant deflation (i.e. subsidence, regression) afterwards, the scientists assume that magma then rose from great depths and in turn led to the explosive eruption at the summit crater. The V. a. Radar and GPS detected inflation of the volcano persists, which could point to further possible eruptions.
Wider consequences of the outbreak
Spread of the ash cloud
Due to the prevailing north-westerly weather conditions during the eruption , the ash plume from the first and second eruptions in particular moved over the North Sea and north-western Europe , where northern Central Europe was most heavily covered. From there they stretched eastwards as far as central Russia, and by April 17 also beyond the Alpine region south and eastwards, where a Mediterranean low had previously held off the north-westerly current.

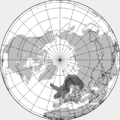
April 15, 2010: Ash cloud of the 2nd eruption phase over the southern European Arctic Ocean (NASA)

April 16, 2010; Ash clouds mixed with normal clouds over northern Germany

April 18, 18:00 UTC; Advance into the Mediterranean

Ash cloud 14-25. April, cumulative: spread of the West Atlantic , Central Asia , Central Siberia


Measurements
LIDAR measurements were carried out from the ground by various institutes . In Kühlungsborn , the cloud was less than a kilometer thick and 9 kilometers high. In Zurich , between the 16th and 17th, a layer of cloud a few hundred meters thick was measured from almost 6 km to less than 3 km within 14 hours. Measurements in Leipzig showed the ash layer at heights between 1 and 4 km for April 18. Traces of the ash reached up to a height of 13 km and also influenced cirrus clouds there .
Fine dust measurements on Monday, April 19, showed eight times higher concentrations on the Zugspitze (2962 m), at the Sonnblick Observatory (3106 m) up to April 21, dust particle concentrations of up to a thousand times the normal value were measured - values that are in at this altitude otherwise only occur during Saharan dust events . Elevated values were also registered at the Schauinsland measuring station near Freiburg; increased sulfur dioxide values were also measured here at the same time .
_ILA_2010_144.jpg)
The German Center for Aerospace introduced on April 19, a test flight with the retrofitted with LIDAR and particle analyzer atmospheric research aircraft D-CMET type Dassault Falcon 20 E through ash concentrations were measured at 60 micrograms per cubic meter on the fly through the cloud.
On April 17, in Vienna, for example, “unusually low visibility” was found near the ground, but a connection with the fallout of the volcanic ash was not yet clear. According to reports from the German Federal Environment Agency , the increase in fine dust near the ground was "very likely" due to the ash cloud from Eyjafjallajökull.
Disruptions to air traffic in Europe


As of April 15, decisions by the air traffic control authorities to suspend a large part of European air traffic under instrument flight rules resulted in massive obstructions in European and intercontinental air traffic. The danger to air traffic comes not only from the blindness of the cockpit windows, but above all from the impairment of the jet engines and other aircraft parts by ash particles. The volcanic ash acts like a sandblasting blower on the outer shell and the windows of the aircraft. The engines can be damaged because they suck in the ash, it becomes liquid again inside due to the high heat and the individual parts and lines stick together and thus lead to the failure of the jet engines, which inevitably leads to serious flight emergencies. The Finnish Air Force has published pictures of damage to an aircraft engine that had flown through the ash cloud shortly before the airspace was closed.
In Europe, from April 15, 2010, air traffic according to instrument flight rules in large parts of northern and central Europe was wholly or partially suspended for several days. Thousands of flights have been canceled or diverted to airports that have not yet been closed. Eurocontrol stated that on April 15, a quarter of the approximately 28,000 flight connections a day had failed. It is the biggest disruption to air traffic since the September 11, 2001 attacks .
Even so, the airlines operated a number of flights during the lockdowns. These flights took place according to visual flight rules and typically at low altitude. In contrast to instrument flight , the responsibility here lies primarily with the pilot. At first only transfer flights were carried out in this way ; after this, however, regular flights ran smoothly. Pilots and air traffic controllers have expressed serious concerns about the high risk of bird strikes and collisions with small aircraft on these low-altitude flights. Avoiding clouds, which is necessary under visual flight conditions, is also dangerous and not always possible. The Lufthansa security pilot expressly regretted having consented to the visual flights.
The closings of the airspace after the eruption of Eyjafjallajökull were characterized by ignorance. There was widespread uncertainty about both the actual concentration of ash in the airspace and the concentration above which dangerous effects on aircraft turbines can be expected. Previously it was assumed that ash clouds visible on satellite images could pose a threat to aircraft.
In the course of the closures, the airlines reproached the air traffic control authorities that the airspace for IFR flights had only been blocked on the basis of computer model calculations over Central Europe. According to images from Meteosat -9, the airspace over Germany is said to have been free of pollution on April 18th. The evaluation of LIDAR measurements with regard to flight safety is difficult because, on the one hand, the measurements do not provide any particle concentration and, on the other hand, aircraft manufacturers do not specify any limit values for air contaminated with silicate. The closures are based on calculations by the Volcanic Ash Advisory Center VAAC of the ICAO in London on the spread of volcanic ash at different heights. The air traffic control authorities and politicians emphasized the absolute priority of safety in air traffic, and economic considerations of road users would have to take second place here.
From April 21st, normal flight operations were increasingly resumed in Central Europe, while in Scandinavia the situation worsened in some areas by April 23rd.
On May 3, 2010, air traffic in Ireland was stopped again. In the following days, Spain and northern Italy were also affected by impairments or bans on air traffic. On May 9, 2010, the Munich airspace was closed due to the highly concentrated ash cloud. The Austrian airspace was also closed again on the night of May 10, 2010; All airports in the country were affected. However, the extent of flight disruptions was far less than in April.
In order to create clearer rules for future outbreaks, the British Civil Aviation Authority introduced a limit value for the ash concentration of 2 micrograms per cubic meter in May 2010, above which the corresponding airspace and a buffer zone must be closed to air traffic. According to this limit, there would have been far fewer flight bans in connection with the Eyjafjalla eruption in April.
Economic impact
Impact on air carriers

The financial consequences of the flight barriers for the airlines concerned were put at around 150 million euros per day. Due to their rarity, they are not insured against such cases and fear that they will have to bear the costs themselves. At the end of April, the European Commission on the part of EU Transport Commissioner Siim Kallas - citing the industry associations - reported sales losses of between 1.5 and 2.5 billion euros, adding up 10 million people affected and 100,000 canceled flights.
After a week of flight disruptions, statements were circulated in the press about economic damage in the amount of “billions”, an amount that economic research has described as “dubious”: experience has shown that operational downtimes are made up for in the long term, and sales declines in air traffic are seen in other sectors of transport Compensated: Since as a result of the impairment, many passengers within Europe tried to switch to the train, the railway companies reported a significant increase in the number of passengers - up to overloading the trains - in international traffic. The ship ferry service on the English Channel and the car rental companies also reported record sales.
Effects on the Icelandic Economy
On May 11, 2010, estimates of the damage caused to the Icelandic economy by the outbreak amounted to around 2.5-3.7 million euros - a considerable sum given a population of only around 320,000 people in the whole country (cf. . Iceland ). The eruption hits the farmers particularly hard, as the area around the erupting volcano is mainly used for agriculture. For this reason, compensation payments from a fund of the farmers' associations and the state for special emergencies ( Bjargráðasjóð ) are planned.
The tourism industry also suffered from the volcanic eruption, as many tourists cancel their bookings early even though the volcanic eruption was long over in the actual tourist season.
The Icelandic state bought the Önundarhorn farm on the Svaðbælisá river with the aim of straightening the course of the river because it carries so much mud and ash with it that the bridge over the ring road suffers.
Assessment of health risks
According to the World Health Organization and British trade associations, adverse effects on health from falling volcanic ash on mainland Europe and the British Isles were unlikely, but could not be completely ruled out. The ashes contained traces of harmful substances such as fluoride or sulfuric acid and could also have an allergenic effect and irritation due to their mineral character alone .
Despite the low likelihood of adverse health effects, the UK authorities advised asthmatics in particular to stay at home.
In Iceland itself, in October and November 2010 there were increasing indications of possible damage to health and allergic reactions to the ash, of which around 10-15 million m³ are still present on the south side of Eyjafjallajökull alone. This is especially true for the inhabitants of the areas directly in the vicinity of the volcano and especially for the children, whose lower stature encourages breathing in the tiny ash particles. A long-term study into possible health damage was commissioned by the Icelandic government. In addition, in November 2010 it was considered whether the further management of some farms located particularly close to the volcano, especially on the Svaðbælisá river, would still be advisable.
Environmental impact
Soil enrichment
After the dust has settled and washed out, the pyroclastics of the Icelandic volcano - like those of all volcanoes - are soil minerals rich in mineral salts .
Possible impact on phytoplankton growth
The outbreak could also potentially have a positive impact on the environment.
A British oceanographic expedition was in the North Sea in 2010/2011 and investigated u. A. a possible prolonged growth of phytoplankton in this part of the world ocean. Phytoplankton normally grows in spring and summer, binding carbon dioxide , then dies and takes the carbon dioxide with it to the sea floor. He needs iron to grow. After the eruption, an increased iron content was found in the seawater.
Climate relevance and forecasts
According to the behavior in earlier outbreaks, such as the month-long event 1821–23 , longer activity could not be ruled out here either. The eruption columns produced up to 8000 meters high were u. A. generated by steam explosions ( phreatomagmatic explosion ), which occur when water and lava meet. In this case, however, the explosive eruptions continued even after the surrounding ice had thawed, which was due on the one hand to the gas content of the magma itself, which is higher in andesitic magmas as in the case, but possibly also to the meeting of two types of magma.
Volcanic ash falls out of the atmosphere again relatively quickly and can therefore only have regional and short-term effects on the weather in the event of smaller eruptions. With the current eruption, neither the amounts of climate-relevant volcanic gases that z. Currently estimated at 3000 tons of SO 2 per day, nor the height of the eruption column, in order to affect the climate of larger areas - this only occurs when significant quantities reach the stratosphere , over about 10 km.
Triggering eruptions from neighboring volcanoes

The event of 1821 had - so it is assumed today - in 1823 the eruption of the much larger Katla , located about 15 km northeast at the northern end of Mýrdalsjökull , so that such effects are also possible with the eruption of 2010. One can use the earthquake measurements and the tremor a constant unrest z. B. at the Goðabunga, a summit on the edge of the Katla crater. On the other hand, it has not yet been possible to predict a compelling sequence of events or the strength of a possible outbreak.
Appendix: Chronology of the ash clouds

April 14, 18:00 UTC
April 15, 18:00 UTC

April 16, 18:00 UTC

April 17, 18:00 UTC
April 18, 18:00 UTC

April 19, 18:00 UTC

April 20, 18:00 UTC

April 21, 18:00 UTC

April 22, 18:00 UTC

April 23, 18:00 UTC

April 24, 18:00 UTC

April 25, 18:00 UTC


See also
literature

- A Ansmann, M Tesche, S Gross, et al .: The 16 April 2010 major volcanic ash plume over central Europe: EARLINET lidar and AERONET photometer observations at Leipzig and Munich, Germany. GEOPHYSICAL RESEARCH LETTERS, (37), 2010, Article Number: L13810
- D. Bird, G. Gisladottir, D. Dominey-Howes: Resident perception of volcanic hazards and evacuation procedures. Natural Hazards and Earth System Sciences 9 , 2009, pp. 251-266.
- D. Bird, G. Gisladottir, D. Dominey-Howes: Volcanic risk and tourism in southern Iceland. Journal of Volcanology and Geothermal Research 189 . 2010, pp. 33-48. doi: 10.1016 / j.jvolgeores.2009.09.020
- SM Davies, G Larsen, S Wastegard, et al .: Widespread dispersal of Icelandic tephra: how does the Eyjafjoll eruption of 2010 compare to past Icelandic events? JOURNAL OF QUATERNARY SCIENCE, (25) 5, 2010, pp. 605-611. doi: 10.1002 / jqs.1421
- AJ Elliot, N Singh, P Loveridge, et al .: Syndromic surveillance to assess the potential public health impact of the Icelandic volcanic ash plume across the United Kingdom . In: EUROSURVEILLANCE April 2010, Volume: 15 Issue: 23 Pages: 6-9 Published: JUN 10 2010
- Ari Trausti Guðmundsson, R.Th. Sigurðsson: Eyjafjallajökull. The untamed volcano. Bassermann, Munich 2010, ISBN 978-3-8094-2792-6
- RG Harrison, KA Nicoll, Z Ulanowski, et al .: Self-charging of the Eyjafjallajokull volcanic ash plume. ENVIRONMENTAL RESEARCH LETTERS Volume: 5 Issue: 2 Article Number: 024004 Published: APR-JUN 2010
- G. Jóhannesdóttir, G. Gísladóttir: People living under threat of volcanic hazard in south Iceland: vulnerability and perception . In: Natural Hazard and Earth System Sciences 10, 2010, 407-420.
Web links
Photos and videos
- Satellite images from the eruption of Eyjafjallajökull in March 2010, Iceland , NASA
- Images from May 6, 2010
- Photo gallery by geologist Björn Oddson, May 13th, 2011, click on the main crater of Eyjafjallajökull (pictures on the left and below on the article Fóru ofan í gíginn ( Eng . Steps into the crater ))
- Video: Graphic representation of the earthquakes and eruptions at Eyjafjallajökull 2010 (private website) (English)
Scientific contributions
- MT Gudmundsson, R. Pedersen, K. Vogfjörd, B. Thorbjarnardóttir, S. Jakobsdóttir, MJ Roberts: 2010. Eruptions of Eyjafjallajökull Volcano, Iceland. Eos, 91, 190-191.
- Eruption in Eyjafjallajökull , Geological Institute of the University of Iceland (English, research results and synopsis, more detailed reports from April 24th, updated)
- Jill Sakai: Months of geologic unrest signaled reawakening of Icelandic volcano , PhysOrg, November 17, 2010 (English)
- Scientific background information (mainly commented collection of links) on the eruption and spread of volcanic ash at the University of Natural Resources and Life Sciences (BOKU) Vienna
- Freysteinn Sigmundsson, et al .: Intrusion triggering of the 2010 Eyjafjallajökull explosive eruption . In: Nature 468, pp. 426-30 (November 18, 2010)
- Jill Sakai, ea: Intrusion triggering of the 2010-Eyjafjallajökull explosive eruption . Dept. of Geoscience, Univ. of Wisconsin, Nov. 17, 2010
- AJBennett, ea: (PDF file; 1 MB) Monitoring of lightning of the April-May 2010 Eyjafjallajökull volcanic eruption using a very low frequency lightning location network , IOP Publishing, Environmental Research Letters (5) 2010
- Matoza, RS, J. Vergoz, A. Le Pichon, L. Ceranna, DN Green, LG Evers, M. Ripepe, P. Campus, L. Liszka, T. Kvaerna, E. Kjartansson, and Á. Höskuldsson: Long-range acoustic observations of the Eyjafjallajökull eruption, Iceland, April - May 2010 , In: Geophysical Research Letters . 38, 2011, doi: 10.1029 / 2011GL047019 .
- SR Gislason, ea: Characterization of Eyjafjallajökull volcanic ash particles and a protocol for rapid risk assessment. Yale Univ., New Haven, March 15, 2011
- Siwan M. Davies, Gudrun Larsen u. a .: Widespread dispersal of Icelandic tephra: how does the Eyjafjallajökull eruption of 2010 compare to past Icelandic events ?. In: Journal of Quaternary Science. 25, 2010, pp. 605-611, doi: 10.1002 / jqs.1421 .
- P. Arason, ea: Observations of the altitude of the volcanic plume during the eruption of Eyjafjallajökull, April – May 2010. Earth Syst. Sci. Data, 3, 9-17, 2011; doi: 10.5194 / essd-3-9-2011 (PDF file; 1.6 MB) (English)
- Volker Matthias, Armin Aulinger u. a .: The ash dispersion over Europe during the Eyjafjallajökull eruption - Comparison of CMAQ simulations to remote sensing and air-borne in-situ observations. In: Atmospheric Environment . 48, 2012, pp. 184–194, doi: 10.1016 / j.atmosenv.2011.06.077 .
- Hoyle, CR, Pinti, V., Welti, A., Zobrist, B., Marcolli, C., Luo, B., Höskuldsson, Á., Mattsson, HB, Stetzer, O., Thorsteinsson, T., Larsen, G., and Peter, T .: Ice nucleation properties of volcanic ash from Eyjafjallajökull. In: Atmos. Chem. Phys., 2011, 11, 9911-9926, doi: 10.5194 / acp-11-9911-2011 (English)
- Magnús T. Gudmundsson, et al .: Ash generation and distribution from the April-May 2010 eruption of Eyjafjallajökull, Iceland. In: Scientific Reports . 2, 2012, S., doi: 10.1038 / srep00572 . (English)
Various individual observations
- Topic page of the German Aerospace Center (DLR) on the ash cloud
- Jón Kristinn Helgason, Veðurstofu Íslands, Esther Hlíðar Jensen, Veðurstofu Íslands: Eðjuflóð, aurskriður og framburður gosefna niður á með láglendi vatnsföllum vorið 2011 vegna gjósku úr Eyjafjallajökulsgosinu , VI 2011-001, ISSN 1670-8261 . (The lahars in Zsh with the Ash from the eruption of Eyjafjallajökull) (PDF file, Icelandic; 6.5 MB)
- Fine, jagged ash increased Eyjafjallajokull volcano's influence . Pyhs.Org., January 22, 2012 (English)
- SJ Leadbetter, MC Hort u. a .: Modeling the resuspension of ash deposited during the eruption of Eyjafjallajökull in spring 2010. In: Journal of Geophysical Research : Atmospheres. 117, 2012, doi: 10.1029 / 2011JD016802 .
- Oddur Sigurðsson, ea: Flood warning system and jökulhlaups - Eyjafjallajökull , Icelandic Met Office, January 7, 2011 (English)
- Jon Tarasewicz, ea: Using microearthquakes to track repeated magma intrusions beneath the Eyjafjallajökull stratovolcano, Iceland. In: Journal of Geophysical Research. 117, 2012, S., doi: 10.1029 / 2011JB008751 .
- Eyjafjallajökull eruption 20th March 2010 to June 2010 , IN: Tephrabase. A Tephrochoronological Database , Univ. of Edinburgh
Individual evidence
- ^ Institute of Earth Sciences - Eruption in Eyjafjallajökull 2010 . .norvol.hi.is. Retrieved March 27, 2011.
- ↑ Veðurstofa Íslands: Þjónusta Veðurstofu Íslands (isl.); Icelandic Met Office: Update on activity (Engl.)
- ↑ jardvis.hi.is; Accessed: January 3, 2011 ( Memento of August 25, 2007 in the Internet Archive )
- ↑ Jarðskjálftahrina undir Eyjafjallajökli . In: Veðurstofa Íslands (The Meteorological Institute of Iceland) . Retrieved November 11, 2010 (March 5, 2010)
- ↑ Innskot and Eyjafjallajökli . In: Morgunblaðið . Retrieved November 11, 2010 (February 26, 2010)
- ↑ Fyrsta háskastigi Lyst yfir . In: Morgunblaðið . Retrieved December 20, 2010.
- ↑ a b Icelandic Meteorological Office , accessed on March 27, 2010.
- ↑ Icelandic Meteorological Office: Eruption on Fimmvörðuháls ; engl .; Accessed March 21, 2010. State of emergency. Glacier volcano erupted in Iceland . In: Spiegel Online , March 21, 2010.
- ^ Iceland: volcanic eruption on the glacier . In: Spiegel Online , accessed on March 21, 2010.
- ↑ AFP report on Yahoo: volcanic eruption drives 500 people from their homes ; Accessed January 10, 2014.
- ↑ Eldgosið á Fimmvörðuhálsi . Retrieved November 11, 2010.
- ↑ Volcano Erupts Under Eyjafjallajökull ( Memento from January 11, 2014 in the Internet Archive ) Reykjavík Grapevine, accessed: March 21, 2010
- ↑ Gos hafið í Eyjafjallajökli , Visir, March 21, 2010
- ↑ Volcanic eruption in Eyjafjallaglacier - flights to Iceland are on hold . Icelandair, accessed March 21, 2010.
- ↑ Fyrsta vél frá Boston í loftið klukkan hálf fimm . In: Vísir . Retrieved November 11, 2010.
- ↑ Rýmingu aflétt . In: Morgunblaðið . Retrieved November 11, 2010 (March 22, 2010)
- ↑ Gossprungan around 1 km að lengd . In: Morgunblaðið . Retrieved November 11, 2010.
- ↑ Hraunflæði niður í Hrunagil . In: Morgunblaðið . March 22, 2010. Retrieved November 11, 2010.
- ↑ Viðtal við Ármann Höskuldsson eldfjallafræðing In: Fréttastofa Stöðvar Tvö , oA
- ↑ Veðurstofa Íslands (March 24, 2010) GPS mælingar . In: Veðurstofa Íslands . Retrieved November 11, 2010.
- ↑ Eldgosið er lítið . In: Morgunblaðið . Retrieved December 20, 2010.
- ↑ Eldgos í Eyjafjallajökli . Retrieved November 11, 2010.
- ↑ cf. Map: Geol. Institute, Univ. Iceland (PDF; 14.2 MB)
- ↑ cf. Morgunblaðið newspaper website Accessed March 27, 2010
- ↑ cf. Morgunblaðið newspaper website Accessed 28 March 2010
- ↑ Tímabundinn kraftur í gosinu . In: Morgunblaðið . Retrieved December 20, 2010.
- ↑ Ríkisútvarpið fréttavefur Krafturinn ekki aukist . In: RÚV . Archived from the original on July 22, 2011. Retrieved November 11, 2010.
- ↑ Meteorological Institute of Iceland: Eruption in Fimmvörðuháls mountain pass Elsdgosið í Fimmvörðuhálsi . In: Veðurstofa Ísland . Retrieved November 11, 2010.
- ↑ Geological Institute, Univ. v. Iceland (PDF; 107 kB) Accessed March 28, 2010
- ↑ Eyjafjallajökull 2010 ( Memento from August 14, 2010)
- ^ A b Geological Institute, University of Iceland - Chemical Composition Retrieved April 17, 2010
- ↑ Landbúnaður skiptir Máli . In: Bændasamtök Íslands . Archived from the original on July 22, 2011. Retrieved November 11, 2010.
- ↑ a b c See report Guðrún Larssen, Geol. Inst. Univ. Iceland (Icelandic) and map Öskulag úr Eyjafjallajökli April 17, 2010 ( memento dated 20100814153504)
- ↑ Sex tonn af hrauni á sekúndu. April 8, 2010, accessed April 17, 2010
- ↑ NASA Sensors Providing Rapid Estimates of Iceland Volcano Emissions. April 7, 2010, accessed April 17, 2010
- ↑ Hitamyndir teknar við eldstöðina á Fimmvörðuhálsi. ( Memento of April 9, 2010 in the Internet Archive ) March 29, 2010, accessed on April 8, 2010
- ↑ 800 ° C hiti í hrauninu. Retrieved March 31, 2010, April 9, 2010
- ↑ after Magnús Tumi Guðmundsson ( memento of August 14, 2010) Accessed: April 9, 2010
- ↑ after Freisteinn Sigmundsson ( memento of August 14, 2010) Accessed: April 9, 2010
- ↑ Ný gossprunga. Retrieved April 1, 2010, April 17, 2010
- ↑ Hraun rennur í Hvannárgil ytra . Mbl.is. April 8, 2010. Retrieved December 20, 2010.
- ↑ Page no longer available , search in web archives: See map of the Geological Institute of Univ. Iceland (PDF) Accessed April 8, 2010
- ↑ Eldgosið á Fimmvörðuhálsi. April 12, 2010, accessed April 8, 2010
- ↑ Iceland Meteorological Office on April 12, 2010, accessed on April 13, 2010
- ↑ Isl. Weather Bureau
- ↑ a b c d e f g h i Geol. Institute, Univ. Iceland, reports as of May 3, 2010 and May 4, 2010, respectively
- ↑ Isl. Weather Office, April 14, 2010 Accessed: May 1, 2010
- ↑ visir.is
- ↑ hraun vellur ur sprungu , mbl.is, April 14, 2010
- ↑ gosid adeins oflugra en vatnsbradnun minnkad , mbl.is, April 14, 2010
- ↑ storflod vid Thorvaldseyri , mbl.is 14 April, 2010.
- ↑ nadu ad rjufa veginn , mbl.is, April 14, 2010
- ↑ Veðurstofa Íslands: Eldsumbrot í Eyjafjallajökli . vedur.is. Retrieved December 20, 2010.
- ↑ Ari Trausti Guðmundsson : Living Earth . Reykjavík 2007, p. 166 ff.
- ↑ He does not come to rest . SF daily news. April 18, 2010. Retrieved November 11, 2010.
- ↑ Aska nær ekki niður í byggð , mbl.is
- ↑ cf. also Geol. Inst., Univ. Iceland: "Loftborna gjóskan hefur aðallega borist til austurs og suðurs." Gosið í Eyjafjallajökli - April 18, 2010 . Accessed April 22, 2010
- ↑ . Isl Weather Bureau, April 15, 2010 Access: 1 May 2010
- ↑ Geol. Inst., Univ. Iceland, April 15, 2010 Accessed May 1, 2010
- ↑ Isl. Weather Office, April 16, 2010 http://www.vedur.is/skjalftar-og-eldgos/frodleikur/greinar/nr/1863 Access: May 1, 2010
- ↑ Isl. Weather Office, April 17, 2010 ,. Geol. Inst., Univ. Iceland April 17, 2010; archived from the original on March 30, 2010 ; Retrieved May 1, 2010 .
- ↑ Isl. Weather Office, April 18, 2010 http://www.vedur.is/skjalftar-og-eldgos/frodleikur/greinar/nr/1863 Access: May 1, 2010
- ↑ Isl. Weather Office, April 18, 2010 http://www.vedur.is/skjalftar-og-eldgos/frodleikur/greinar/nr/1863 Access: May 1, 2010
- ↑ Isl. Weather Office, April 28, 2010 http://www.vedur.is/skjalftar-og-eldgos/frodleikur/greinar/nr/1863 cf. also DLR website: http://www.dlr.de/desktopdefault.aspx/tabid-6449/ Access: May 1, 2010
- ↑ Isl. Weather Office, April 19, 2010 http://www.vedur.is/skjalftar-og-eldgos/frodleikur/greinar/nr/1863 Access: May 1, 2010
- ↑ Isl. Weather Bureau . Vedur.is. January 5, 2010. Retrieved December 20, 2010.
- ↑ Isl. Weather Bureau, April 30, 2010 ,. Geol. Inst., Univ. Iceland April 30, 2010; archived from the original on March 30, 2010 ; Retrieved April 30, 2010 .
- ↑ Isl. Weather Office, April 20, 2010 http://www.vedur.is/skjalftar-og-eldgos/frodleikur/greinar/nr/1863 Access: May 1, 2010
- ↑ Isl. Weather Office, 21. – 30. April 2010 ,. Geol. Inst., Univ. Iceland April 30, 2010; archived from the original on March 30, 2010 ; Retrieved May 1, 2010 .
- ↑ The measurements use devices that are also used to monitor the neighboring volcano Katla , hence the name. Órói á stöðvum við Eyjafjallajökull
- ↑ Iceland Meteorological Office, May 5, 2010, 1.40 p.m.
- ^ Update on activity in Eyjafjallajökull . En.vedur.is. May 5, 2010. Retrieved December 20, 2010.
- ↑ Gos í Eyjafjallajökli - staða May 10, 2010 kl. 15:00. (PDF) (No longer available online.) Archived from the original on August 14, 2010 ; Retrieved December 20, 2010 .
- ↑ cf. z. B. Gos í Eyjafjallajökli - staða 13 May 2010 kl. 16:00. Minnisblað frá Veðurstofu Íslands og Jarðvísindastofnun Háskólans (PDF) accessed November 27, 2010
- ↑ Gos í Eyjafjallajökli - staða 15 May 2010 kl. 15:00. (PDF) (No longer available online.) Archived from the original on August 14, 2010 ; Retrieved December 20, 2010 .
- ↑ Gos í Eyjafjallajökli - staða 16. May 2010 kl. 17:00. (PDF) (No longer available online.) Archived from the original on August 14, 2010 ; Retrieved December 20, 2010 .
- ↑ Gos í Eyjafjallajökli - staða May 17, 2010 kl. 17:00. (PDF) (No longer available online.) Archived from the original on August 14, 2010 ; Retrieved December 20, 2010 .
- ↑ Gos í Eyjafjallajökli - staða 18th May 2010 kl. 17:00. (PDF) (No longer available online.) Archived from the original on August 14, 2010 ; Retrieved December 20, 2010 .
- ↑ Gos í Eyjafjallajökli - staða May 20, 2010 kl. 17:00. (PDF) (No longer available online.) Archived from the original on August 14, 2010 ; Retrieved December 20, 2010 .
- ↑ Gos í Eyjafjallajökli - staða May 21, 2010 kl. 19:00. (PDF) (No longer available online.) Archived from the original on August 14, 2010 ; Retrieved December 20, 2010 .
- ↑ Gos í Eyjafjallajökli - staða 22 May 2010 kl. 14:00. (PDF) (No longer available online.) Archived from the original on August 14, 2010 ; Retrieved December 20, 2010 .
- ↑ Gos í Eyjafjallajökli - staða 23 May 2010 kl. 14:00. (PDF) (No longer available online.) Archived from the original on March 29, 2011 ; Retrieved December 20, 2010 .
- ↑ Gos í Eyjafjallajökli - staða May 25, 2010 kl. 17:00. (PDF) (No longer available online.) Archived from the original on March 29, 2011 ; Retrieved December 20, 2010 .
- ↑ Eyjafjöll classified as "inactive" ( Memento from May 25, 2010 in the Internet Archive ) at tagesschau.de, May 24, 2010 (accessed on May 24, 2010)
- ↑ cf. Gos í Eyjafjallajökli - staða 4th júní 2010 kl. 12:00. Minnisblað frá Veðurstofu Íslands og Jarðvísindastofnun Háskólans accessed on November 27, 2010
- ↑ Gos í Eyjafjallajökli - staða 7. júní 2010 kl. 11:00. (PDF) (No longer available online.) Archived from the original on March 29, 2011 ; Retrieved December 20, 2010 .
- ↑ Gos í Eyjafjallajökli - staða 10 júní 2010 kl. 15:00. (PDF) (No longer available online.) Archived from the original on March 29, 2011 ; Retrieved December 20, 2010 .
- ↑ cf. z. B. Gos í Eyjafjallajökli - staða 15 júní 2010 kl. 17:00. Minnisblað frá Veðurstofu Íslands og Jarðvísindastofnun Háskólans (PDF) accessed on November 27, 2010
- ↑ Veðurstofa Íslands: Eldsumbrot í Eyjafjallajökli . Vedur.is. Retrieved December 20, 2010.
- ↑ Icelandic State Radio RUV; Retrieved on November 27, 2010 ( Memento from September 15, 2010 in the Internet Archive )
- ↑ Icelandic Civil Protection Authority ( Memento from April 2, 2012 in the Internet Archive ) Accessed January 2, 2011
- ↑ Freysteinn Sigmundsson et al .: Satellite radar inferometric observations 1992-2919 of Eyjafjallajökull volcano: Relating deformation sources to volcano behavior. (PDF) University of Iceland, RVoN-2010, School of Engineering and Natural Sciences, Research Symposium, Oct. 8-9, 2010, Book of Abstracts, p. 34 Accessed January 6, 2011
- ↑ a b Geol. Inst., Explosive eruptive phase of the Eyjafjallajökull volcano, Iceland, begins April 14, 2010 ; see. also a more detailed analysis by the Geological Institute of the University of Iceland. Accessed May 1, 2010
- ↑ Geol. Inst., ELDGOS í Eyjafjallajökli ( Memento from August 14, 2010), April 18, 2010, accessed on May 1, 2010
- ↑ Eyjafjallajökull eruption history in the Global Volcanism Program of the Smithsonian Institution (English)
- ↑ cf. also Freysteinn Sigmundsson, et al .: Intrusion triggering of the Eyjafjallajökull 2010 explosive eruption . In: Nature 468 , pp. 426-430 (November 18, 2010). http://www.nature.com/nature/journal/v468/n7322/full/nature09558.html Retrieved November 28, 2010
- ↑ cf. also: Magnús T. Gudmundsson , ea: Eruptions of Eyjafjallajökull volcano, Iceland. (Abstract) In: EOS, TRANSACTIONS AMERICAN GEOPHYSICAL UNION, VOL. 91, NO. 21, P. 190, 2010 Accessed January 6, 2011
- ↑ cf. z. BR Pedersen, F. Sigmundsson: Temporal development of the 1999 intrusive episode in the Eyjafjallajökull volcano, Iceland, derived from InSAR images . In: Bull. Volc. , 68, 2006, pp. 377-393.
- ^ Charles Q. Choi: Why Iceland's Eyjafjallajökull volcano erupted. Magna meetup cited as source of disruptive event, volcanologist says . In: Science. Retrieved from MSNBC.com : November 28, 2010
- ↑ Jill Sakai, ea: Intrusion triggering of the 2010-Eyjafjallajökull explosive eruption . Dept. of Geoscience, Univ. of Wisconsin, Nov. 17, 2010. Accessed February 26, 2011
- ^ Leibniz Institute for Atmospheric Physics, vertical profile from RMR lidar measurements from April 18 . Spiegel.de. April 19, 2010. Retrieved December 20, 2010.
- ↑ ETH Zurich Aerosollidar measurement profiles from 16./17. April . Spiegel.de. April 19, 2010. Retrieved December 20, 2010.
- ^ Ashes stories about Leipzig ( Memento from January 11, 2012 in the Internet Archive ). IfT lidar profile, Spektrumdirekt.de
- ↑ Sonnblick: volcanic ash colors air filters gray . In: Salzburger Nachrichten . April 21, 2010, volcanic ash, p. 7 .
- ↑ Federal Environment Agency: daily mean values of particle concentration April 19, 2010 ( Memento from January 11, 2014 in the Internet Archive )
- ↑ www.dlr.de: DLR research aircraft “Falcon 20E” started for measurement flight , accessed on April 19, 2010
- ↑ DLR: Report of Falcon Flight April 19, 2010 (PDF; 1.5 MB)
- ↑ Compare also with ash cloud # limit values
- ↑ a b Michael Staudinger, Reinhard Böhm ( Central Institute for Meteorology and Geodynamics ), quoted in. n. Gerhard Schwischei: Impact on the climate low . In: Salzburger Nachrichten . April 17, 2010, Chronicle, p. 10 ( article archive ).
- ↑ Handelsblatt: Volcanic ash also allows fine dust levels to climb . April 19, 2010
- ↑ German airports closed. (No longer available online.) Archived from the original on April 18, 2010 ; Retrieved April 19, 2010 .
- ↑ All international airports in Germany closed. Retrieved April 19, 2010 .
- ↑ Volcanic ash cloud reaches Spain - Northern Spanish airports closed. Retrieved April 19, 2010 .
- ↑ Icelandic volcano disrupts international air traffic ( memento from April 15, 2010 in the Internet Archive ), tagesschau.de, April 15, 2010
- ↑ Austro Control prepares airspace closure at ORF.at on April 16, 2010
- ↑ Nightmare of all pilots . Spiegel.de. April 15, 2010. Retrieved April 18, 2010.
- ↑ a b St. Galler Tagblatt, April 17, 2010
- ^ Finnish F-18 engine check reveals effects of volcanic dust ( en ) April 16, 2010. Retrieved April 18, 2010.
- ^ Mdr: Ash chaos in air traffic . Mdr.de. April 16, 2010. Archived from the original on April 19, 2010. Retrieved on December 20, 2010.
- ↑ Flight chaos also amazes experts ( memento from April 19, 2010 in the Internet Archive ), St. Galler Tagblatt from April 16, 2010
- ↑ Spiegel Online: Wild West under the clouds May 10, 2010
- ↑ Flightglobal: Ash Cloud → What does it mean?
- ↑ USGS Volcano Hazards Program Site: transportation #aircraft
- ↑ Christopher Schrader, sueddeutsche.de: Volcanic eruption on Iceland - cleaning the ashes from the sky . April 18, 2010, 5:13 pm
- ↑ MetOffice UK: distribution of volcanic ash
- ↑ Almost normal operation in the sky . In: Salzburger Nachrichten . April 23, 2010, Chronicle, p. 22 ( article archive ).
- ↑ Spiegel-online "Ireland stops air traffic because of volcanic ash"
- ↑ cf. Again obstructions in the airspace: Ash cloud moves on to Italy ( Memento from May 12, 2010 in the Internet Archive ) at tagesschau.de, May 9, 2010 (accessed on May 9, 2010)
- ↑ cf. Obstruction by ash cloud from Iceland: Munich airspace completely closed ( Memento from May 11, 2010 in the Internet Archive ) at tagesschau.de, May 9, 2010 (accessed on May 9, 2010)
- ↑ Munich Airport was also closed , May 9, 2010 (accessed on May 9, 2010)
- ↑ Christopher Schrader: Ash cloud over Europe: Unnecessary flight bans. Süddeutsche.de, May 20, 2010.
- ↑ Spiegel Online: Flight ban ash chaos burdens airlines . April 16, 2010
- ↑ Klaus Schmittke ( Munich Re ), quoted in n. Richard Wiens, Karin Zauner: More challenge than harm . In: Salzburger Nachrichten . April 20, 2010, Wirtschaft, p. 15 , col. 5 ( article archive ).
- ↑ a b Eyajafjalla hits airlines harder than 9/11 . In: Salzburger Nachrichten . April 20, 2010, Wirtschaft, p. 15 .
- ↑ Billion hole through ash. Up to 2.5 billion sales losses - the consequences . In: Salzburger Nachrichten . April 29, 2010, Chronicle, p. 20 ( article archive ).
- ↑ a b Markus Marterbauer ( Institute for Economic Research Wifi), quoted in n. More challenge than harm . In: Salzburger Nachrichten . April 20, 2010.
- ↑ Rail traffic information . Accessed on April 17, 2010: “SBB asks all international passengers to make a seat reservation. SBB advises all travelers without a valid international seat reservation against a trip. "
- ↑ Morgunblaðið of May 11, 2010 Accessed: May 15, 2010
- ↑ showmetheworld.de , luftpost-podcast.de A tourist in Iceland in the year of the outbreak reports u. a. about the tourist impact.
- ↑ Svaðbælisá færð til að auka strauminn. Article in Morgunblaðið from 1.3.2012. Retrieved September 5, 2019 .
- ^ Experts update ash health advice , BBC News, April 16, 2010
- ^ Website of the state television broadcaster RUV - Áfram tjón vegna gossins ( Memento from January 11, 2014 in the Internet Archive )
- ↑ a b Website of the state television station RUV - Hafa áhyggjur af heilsu og afkomu ( Memento from January 11, 2014 in the Internet Archive )
- ↑ cf. z. B. https://skemman.is/bitstream/1946/23130/1/meistararitger%C3%B0_HeidrunHpdf.pdf
- ↑ Accessed January 5, 2011
- ↑ Bernd Zimanowski (Physical Geography, University of Würzburg), quoted in. According to Hans-Edzard Busemann: volcano eruption could last for months. In: science.orf.at → Geology. ORF / Reuters, April 16, 2010, accessed on April 21, 2010 .
- ↑ Stefen A. Nelson, Tulane University: Volcanoes, Magma and Volcanic eruptions. Chapter: Explosive Eruptions Accessed: January 6, 2011
- ↑ The Icelandic geologist Freysteinn Sigmundsson (Vulkanolog. Inst., Univ. Iceland) z. B. explained in an interview with the magazine Nature that the interaction with the ice would only have increased the explosiveness; he assumes a magma mixture : The second eruption occurred within the ice-capped caldera of the volcano, with explosivity amplified by magma– ice interaction. Accessed January 6, 2011
- ↑ Steve Sparks on the SO2 amount ( memento from March 24, 2012 in the Internet Archive ), aussmc.org
- ↑ cf. z. B. Tremor measurements from January 5, 2010 Accessed: January 5, 2011
- ↑ cf. z. B. Ari Trausti Guðmundsson: “Eyjafjallajökull gýs sjaldan en Katla often. Á sögulegum tíma Höfum við tvö dæmi þess að Katla rumskar um leið og eldgosi lýkur. Kannski verður þetta með svipuðum hætti núna en það er aldrei hægt að ráða í hegðun eldfjalla. Ástæðan fyrir þessu liggur ekki fyrir og hefur lítið forspárgildi. "(Own translation:" Eyjafjallajökull seldom breaks out, Katla, however, often. In historical times (ie since the 9th century, translator's note) we have two examples for Katla to move as soon as the eruption stops. Perhaps it will be the same again, but it is never possible to interpret the behavior of volcanoes. The reason for this is unknown and has therefore little validity with regard to predictions. ”) http://www.visir.is/article/20100322/FRETTIR01/281764126 Accessed: January 6, 2011
Coordinates: 63 ° 38 ′ 0 ″ N , 19 ° 36 ′ 0 ″ W.