
Computed Tomography

The computed tomography and computed tomography (from ancient Greek τομή tomé , German , cut ' and γράφειν Graphein , German , write' ), abbreviation CT is an imaging procedure in the radiology .
In contrast to X-ray tomography, a computer is used in computed tomography in order to be able to generate sectional images calculated from the absorption values of X-ray signals passing through the body. Digital cross- sectional images are reconstructed through the computer-based evaluation of a large number of x-ray images of an object taken from different directions . Alternative names are CT scan, CAT scan (from computer-assisted tomography or computed axial tomography ) or slice x-ray.
Although the first devices in 1972 only had very limited functionality compared to today's devices, computed tomography was immediately accepted because, in contrast to a normal X-ray, the images offer an overlay-free representation of the body structures. In addition, it was possible for the first time to display types of tissue with different attenuation for X-rays, which was only possible to a very limited extent until then.
Related procedures are digital volume tomography and rotational angiography .
functionality

In the conventional X-ray process , the object to be imaged is transilluminated by an X-ray source and imaged on an X-ray film. The result is a projection of the volume onto a surface. Image parts of the illuminated body lying one behind the other in the direction of the beam are inevitably superimposed. As a result, it is not possible to differentiate, for example, whether the weakening visible in the X-ray image (light areas in the image) was caused by a material of higher absorption or by a greater layer thickness (see Lambert-Beer law ).
In computed tomography, absorption profiles of the object are created from many directions and the volume structure is reconstructed from them. In contrast to classic X-rays, the measured data does not consist of a two-dimensional image, but is a one-dimensional absorption profile. (In today's devices, however, several, up to 320 such lines are read out with one tube cycle.)
Only through the computer-aided image reconstruction, which today is often done with the algorithm of filtered back projection , can the degree of absorption be determined and the image calculated for each volume element of the object (so-called voxel , corresponds to a three-dimensional pixel ) .
The calculated image is a transversal section through the examination subject. Adjacent cuts can be created with several successive tube circulations. Volume graphics are made up of several dozen to several hundred individual cuts.
A computer is an essential prerequisite for the creation of an image with a computer tomograph, as the image is not created directly, as is the case with classic X-ray procedures, but must first be calculated from the measured data. To calculate a CT image, projections are required that cover at least a 180 ° rotation around the object to be imaged.
construction
Each CT scanner has a short ring tunnel, also known as a gantry, as well as an electromotive movable table on which the patient or the examination object lies. As part of the examination, the body part or object to be examined is driven through this tunnel parallel to the recording process. One or more control cabinets are usually still available for generating the high voltage, calculating the data and controlling the device, but these can be positioned variably. They can be located in the examination room, in the control room or in a separate room. Outside the examination room is the control console with which the staff controls the examination process.

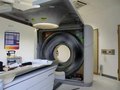
Typical CT scanner: the gantry and patient table can be seen in the foreground and on the right. The device mounted on the tube immediately to the left of the gantry is the contrast medium pump, which can be used to administer a contrast medium to the patient. The power supply unit with the transformers is placed in the corner of the room, with an equipment cabinet to the right.
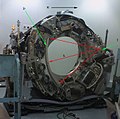
The gantry with the housing removed: "D" marks the D etektorkranz, wherein "T" is the tube (English Tube), which emits its fan beam in the direction of the red lines. "R" indicates the R otationsrichtung of tube and detector.
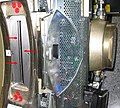
The red arrows mark the beam exit window of the tube of a 16-line CT. The tubular tank can be seen on the right in the picture; The cooling liquid runs in the pipes connected at the top and bottom to cool the tube.

Operating console of a 16-line CT: On the left screen, playback of the overview image, which the operating staff uses to plan the examination. The monitor on the right shows the local image data archive.
Video of a running CT with the housing cover removed. In everyday examinations, the detector and tube rotate invisibly and only slightly audibly within the housing while the patient or the object is moved through the gantry.


history

The mathematical foundations of the computer tomography used today were developed in 1917 by the Austrian mathematician Johann Radon . The Radon transformation forms the basis for calculating spatial recordings of an object and its internal structure that can be penetrated by X-rays with the help of filtered back projection .
In the 1930s, tomographic methods were developed as part of conventional radiology.
Between 1957 and 1963 Allan M. Cormack worked on studies on the absorption of X-rays by human tissue and developed appropriate mathematical methods for this independently of Radon's work; Building on this, he postulated that small differences in absorption could also be represented. As Cormack recalled in 1992, however, he had to solve the mathematical problem himself, since he only found out about Radon's fundamental work by chance in 1972. In the course of his research, he also discovered that radon, for his part, could have resorted to previous work by Hendrik Antoon Lorentz , which he was also not aware of. Due to the lack of a computer, among other things, Cormack was unable to implement his ideas in the form of concrete apparatus.
It was not until the electrical engineer Godfrey Hounsfield employed at EMI that prototypes were realized in 1969 and brought to market maturity. He was not familiar with Cormack's preparatory work and had to develop the algorithms for the image reconstruction himself, which was a complex process.
In 1969, Hounsfield's first laboratory equipment still used an isotope source as the radiation source, and the scan time was nine days.
After a series of animal examinations to prove the safety, the first CT image was taken on a human in 1971. As early as 1972, the first commercial computer tomograph, the EMI Mark 1, was installed for clinical use in London's Atkinson Morley Hospital. By the end of 1974, EMI had sold and installed 60 such scanners. Cormack and Hounsfield received the 1979 Nobel Prize for Physiology or Medicine together for their work .
Milestones in CT development
The history of computed tomography is full of innovations that affect all areas of the device. They concern the arrangement and design of the gantry, tube and detector, but also the algorithms used for image reconstruction. The development steps were particularly large in the early years of computed tomography and during this time they were primarily aimed at shortening the examination time.
Device generations
The changes in the type of data acquisition (arrangement, movement and design of the tube and detector) were so fundamental that they were described with the term "device generation". However, this count ended with the fifth generation. Practically all of the computer tomographs available on the market today for diagnostics on humans are rotate-rotate devices , i.e. devices of the third generation.

- Translation Rotation Scanners - These first generation devices had an x-ray tube that emitted a needle beam associated with a single detector. The detector and the tube moved in a translatory manner at a fixed distance from one another and scanned the layer to be examined like - figuratively speaking - a band saw saws through a piece of wood. The piece of wood corresponds to the object to be examined (= head of the patient) and the saw blade to the X-ray beam. After each such recording, in which 160 measured values were recorded, the tube and detector rotated 1 ° around the center of the examination object and scanned a line again. The EMI Mark 1 recorded 180 projections in 5 minutes. The detector had two lines, the slice thickness was 13 mm, the resolution 3 line pairs / cm. After a computing time of 35 minutes, 6 × 2 images in a matrix of 80 × 80 = 6400 pixels, calculated from a total of 28,800 data, could be displayed.
- Devices of this generation were mostly pure skull scanners, i.e. devices with which only images of the head were possible. ACTA (automated computerized transverse axial), the first "body scanner" installed in Washington in 1973, made it possible for the first time to record images of the chest and abdomen. It also worked according to the translation-rotation principle and had an axial field of view of 48 cm, which it scanned during a 6-minute exposure.
- Second-generation devices , which also came on the market as early as 1972, scanned the object to be examined in the same way, but using a fan beam that projected onto ten detectors. Almost all devices of the second generation were also pure skull scanners, which only enabled images of the head.
- Rotate-Rotate devices - the tube no longer has to carry out a translatory movement, as a fan of rays is emitted, which illuminates the entire area. It is only rotated around the patient; a circular segment of detector cells attached to the opposite side of the rotating part accommodates the fan. These third generation devices came onto the market in 1975 and made it possible for the first time to record data from a shift within 20 seconds. This made it possible to record the chest and stomach area during a breath-holding phase and thus to avoid the hitherto unavoidable blurring of breath.
- Rotate Stationary Devices - With these devices, only the X-ray tube rotates around the patient, while the detectors are attached in a full 360 ° circle around the patient. This fourth generation followed in 1978, but could not prevail and soon disappeared from the market.
- Electron beam scanners - These fifth generation devices were built around the turn of the millennium. There are no longer any mechanical components moving here. Around the patient there is a 360 ° circle with detectors and a ring made of a material such as tungsten, which serves as a target for the electron beam from an electron gun . According to the principle of a Braun tube , this electron beam is directed to the desired position on the target ring by means of electromagnetic fields. Wherever it strikes, X-rays are generated that x-ray the patient. In order to be able to cover the full 360 degrees of the ring, several electron guns and deflection assemblies are used, which are arranged at regular intervals around the target. With this technology, images could be generated extremely quickly, even real-time recordings of the beating heart were possible, since no mechanical parts moved during the recording, only the electron beam had to be guided around the patient. This was possible in the millisecond range, while even today the fastest CTs still need several tenths of a second for a 360 ° image. These devices have probably not established themselves in everyday medical practice due to the high technical complexity and thus the high price, but have been used for a very long time in cardiology due to their high temporal resolution of up to 30 ms. High-quality CT images of the heart can now be made with high-line spiral CTs (64–640 lines) of comparable or better quality at far lower costs.
Slip ring technology
In the 3rd generation CTs, too, the tube and detector were initially connected to the gantry via cables, which is why the tube had to be turned back after a 360 ° rotation. The shortest possible recording time with this technology was two seconds for the fastest devices. However, clinicians wanted even faster images and so the first computed tomographs with slip ring technology came on the market. The first "continuous rotators" were brought onto the market in 1987 by Siemens (Somatom Plus) and Toshiba (TCT 900S). The shortest time for a full 360 ° rotation was around one second for these devices.
Spiral or helix CT

In the early days of computed tomography, only axial scanning was used. With this exposure procedure, the table was shifted a little after each full 360 ° rotation of the tube around the patient. The displacement path was as great as the selected layer thickness, ie approx. 5–15 mm. There was more than enough time to move the table, as the tube had to turn back in the opposite direction, after all, the tube and detector system were connected to the gantry by cables. However, this mode was initially retained after the introduction of the "permanent rotator" in 1987. All that was needed was to turn back the tube. A recording therefore consisted of a continuous tube rotation with a step-by-step table feed, which took place after each full tube revolution. A spiral mode, in which both the tube and the detector system move continuously, had been discussed and published on various occasions, but the majority of manufacturers rejected this type of recording technology. Movement of the patient during tube rotation was considered a source of severe image artifacts, and spiral CT was derisively referred to as the "method of creating artifacts in CT".
Nevertheless, the German physicist Willi A. Calendar successfully introduced spiral CT in 1989. The first device that worked in this mode was the Siemens Somatom Plus. The dreaded artifacts could be eliminated with the algorithm of "Z-interpolation". Within two years, all other major CT manufacturers were also bringing out devices that work in spiral mode, and the method was accepted. The rapid distribution was possible because at that time algorithms were not patentable, the Z interpolation could therefore be adopted by all manufacturers. All of today's devices work in the spiral process, in which the patient is moved at a constant speed along his longitudinal axis through the radiation plane, while the radiation source detector unit rotates at a constant angular speed . Depending on the device a plurality of axial planes - can be read simultaneously ((2009 Toshiba, Stand) - 2 to a maximum of 320 multi-layer or multi-slice method / multi-layer or multi-line spiral CT [MSCT]). This makes the process faster and movement artifacts (e.g. due to breathing) can be reduced. In addition to the high speed, another advantage of modern multi-slice spiral CT is the acquisition of data sets with isotropic voxels . Isotropic voxels are shaped like cubes. This enables a multiplanar reformation in any image planes ( axial , sagittal , coronal ) without a loss of (detail) resolution or even oblique and curved ( curved ) and high-quality 3D reconstruction. High-performance rotating anode tubes are used in spiral CTs .
Multi-line CT
In 1992, Elscint was the first manufacturer to introduce a third-generation computer tomograph that recorded two sections at the same time with one tube rotation. All other manufacturers of clinical CTs followed suit and the number of slices doubled to 4 in 1998, grew over 6 and 8 lines to 16 in 2001, further to 20, 32 and 40 lines to 64 in 2006 and reached 640 (320 lines , read twice) at the same time image lines that can be acquired at the Toshiba Aquilion ONE peaked in 2011 until today. The decisive advantages of the multi-layer systems are the reduced scan time, the reduction in the layer thickness and the increase in the scan length.
Dual source computed tomography


A dual-source computer tomograph was presented by Siemens in 2005. In contrast to the conventional computer tomograph, two rotating x-ray sources offset by 90 degrees work at the same time in the dual source computed tomograph . This enables the recording time to be halved, which is particularly useful for cardiac imaging. The two tubes can be operated with different voltages.
Two-spectra CT or multi-energy computed tomography
The visible light used for imaging in photography consists of electromagnetic waves of different wavelengths; analogously, the X-ray spectrum of an X-ray tube used for computed tomography also consists of electromagnetic rays of different wavelengths. Conventional computed tomographs quantified the attenuation of the entire incident X-ray spectrum; the different absorption characteristics of a tissue for different wavelengths are not taken into account.
The attenuation properties of tissues and contrast media depend on the photon energy of the X-ray radiation used. Since the Hounsfield values of contrast agents in the CT image are similar to those of calcifications, it is sometimes difficult, for example, to differentiate between coronary calcification and contrast agent in the conventional CT image. However, since contrast media in the low-energy spectrum shows a significantly higher absorption than in the higher-energy spectral range, multi-energy computed tomography can be used to differentiate between calcium or bone and contrast medium. Bones and calcium can be removed easily and reliably from the image if they hinder the display and diagnosis of other areas. Since the composition of the examined tissue can also be analyzed with the two-spectra CT, it is possible to characterize kidney stones with regard to their composition. With this technology, bleeding can also be better assessed and the perfusion of the myocardium can be visualized.
In the 1990s, Siemens offered the Somatom DR, a device that could be used to overlay and evaluate two images obtained with different radiation spectra. This process, called “two-spectra CT” by Siemens, made it possible to carry out precise bone density measurements and to calculate images that looked as if they had been created with monochromatic X-rays. They were also completely free of artifacts caused by beam hardening . However, the procedure did not prevail. It resulted in double radiation exposure and double examination time, which was not considered appropriate to the clinical gain.
Devices from Siemens, General Electric and Toshiba offered the possibility of two-spectra CT in 2013.
The implementation of this technology varies today (2018) depending on the price segment and manufacturer. There are solutions in which two X-ray tubes are used that are controlled with different voltages, solutions in which the same section is recorded one after the other with the same tube but different tube voltages, and solutions in which the X-ray tube switches quickly between two tube voltages during a revolution in the millisecond range . A third variant is the so-called "spectral CT". In this case, a special yttrium detector is used which evaluates two energy levels at the same time. The advantage here is the permanent availability of multi-energy data sets, as well as the lower patient dose compared to systems with 2 tubes, as only one radiation source is used. This also eliminates the time lag when recording the different energy levels. Philips is currently the only provider that offers this technology on the market.
Iterative image reconstruction
With the exception of the very first devices (EMI Mark1), raw data recorded by the CT were converted into cross-sectional images with the help of filtered back projection . With iterative image reconstruction algorithms that are considerably more computationally intensive, the radiation dose required for an examination can be reduced by 30 to 60% while maintaining the same image quality. At GE, the algorithm is called ASIR (Adaptive Statistical Iterative Reconstruction) or MBIR (Model based iterative reconstruction); ASIR has been available in commercially available devices since 2009, MBIR is still in development; Philips calls its algorithm iDose or IMR, at Siemens it is called IRIS (Iterative Reconstruction in Image Space) and at Toshiba AIDR (Adaptive Iterative Dose Reduction). In the first studies, ASIR examinations could be carried out with an average of 2.6 mSv instead of the previous 3.8 mSv. According to the manufacturer, the potential of the process has not yet been fully exploited (as of 2010); In the future, radiation exposure can be further reduced by using considerably more computing power while maintaining the same image quality.
AI-based image reconstruction
AI -based image reconstruction has also been available since 2019 . The manufacturer advertises a radiation dose that is reduced compared to partially iterative methods with reduced noise and improved detail resolution. With the help of this algorithm, it is possible to obtain the image quality of a model-based reconstruction (MBIR) at the reconstruction speed of a partially iterative method.
mobile devices
Since the 1990s, in addition to the originally permanently installed devices (English Fixed CT Scanners ) with separate rooms for the computer technology, own power supply and large rooms lined with lead, mobile devices (English Mobile CT Scanners ) have also been developed. These are much smaller and lighter, have built-in lead shielding and are operated using batteries or standard power supplies. For example, they are transported on trucks or trailers.
In November 2008, a Mobile Stroke Unit was put into operation at Saarland University Hospital as the world's first ambulance with integrated CT for pre-hospital stroke treatment. Since February 2011, a device built into a fire engine has been used in the Stroke-Einsatz-Mobil ( STEMO ) of the Berlin fire brigade as part of a stroke research project .
Applications
Computed tomography is used in many areas. For the examination of trees, for the non-destructive examination of archaeological finds such as mummies or musical instruments, for material testing in industrial computer tomography or for diagnosing animal diseases in veterinary medicine .


However, the largest number of devices can be found in human medicine .
Computed tomography in human medicine
Today, the CT is one of the most important tools of the radiologist, with which a variety of diseases can be diagnosed. In 2009 around 4.88 million people in Germany received at least one computer tomography. The method can be used wherever a condition or clinical picture leads to a change in the structure of the body. It can be used to diagnose broken bones, bleeding, bruises, swellings (e.g. of lymph nodes) and often inflammation. Since it is also a very fast imaging process, computer tomographs can almost always be found near the emergency room of an accident hospital.
Soft tissue organs, nerve tissue, cartilage and ligaments can be easily assessed on CT. The representation of these tissue groups is, however, a clear strength of magnetic resonance tomography , which is why this - more expensive and significantly more time-consuming, but X-ray-free - method is often preferred for issues relating to these organ groups.
In principle, tumors and metastases from cancer can also be detected. One difficulty, however, is that a tumor presents itself as a mass, but it is not visible in the image whether the cause of this mass is actually a tumor (or metastasis). It is possible that an enlarged lymph node has metastasized from the tumor or is just inflamed. Similarly, a tumor is sometimes clearly recognizable in its shape, but it is not clear whether the tumor tissue shown in the picture is still vital (i.e. alive) or has already died due to the therapy after a therapy (chemotherapy or radiation therapy) has taken place. Small metastases and tumors are also often easy to overlook or cannot be differentiated with sufficient certainty from normal tissue structures. The combination of computed tomography and positron emission tomography , the so-called PET / CT, brought great progress for diagnostics in oncology . PET supplemented what CT could not deliver - and vice versa.
Computed Tomography in Materials Science
In addition to medicine, computed tomography is also used in material science topics. Since in this case it is often necessary to penetrate materials that have a stronger absorption than in medicine, e.g. B. metal housing, higher radiation energies are often used in materials science.
Recording modes


An overview image is always taken before each exposure. Here the X-ray tube stands still. The patient is driven past the fan beam of the tube with the aid of the movable table. The result is an image that looks very similar to a classic x-ray. However, this image is only used to plan subsequent recordings.
Until the mid-1990s, purely axial recording was the only possible type of recording. The tube rotated a full 360 ° around the patient with the table stationary. The table was then moved and the next shift was recorded. Every clinical CT has this mode to this day, as it offers a better slice sensitivity profile and thus better detail recognition. However, it is now rarely used.
With CT fluoroscopy , axial scanning is also used; it is acquired at a certain position in time intervals. The recording mode is used to e.g. B. to guide the biopsy needle during a puncture .
As with CT fluoroscopy, dynamic CT scans repeatedly at the same position. The course of a physiological process over time can be determined from the image sequence. This is mostly the flooding of CT contrast media. The blood flow to an organ or part of an organ can be determined from the speed at which the contrast agent is distributed in the examination area. For visualization, the sequence of images can be shown as a cinema sequence.
Since the late 1990s, the anatomy of the heart can also be visualized with the aid of multi-line CTs. In the computed tomography of the heart can be both the axial and the scroll mode can be used. Although the heart rests for about 70% of the heartbeat phase, arrhythmias and extrasystoles can still make a recording unusable. Most CTs today (2011) have to compose a complete image of the heart from image data obtained over the course of five to ten heartbeats.
By far the most common recording technique today (2011) is sequential recording in spiral mode. It can be carried out with or without the simultaneous use of contrast media .
Typical CT examination process
As a rule, little time is required for a CT examination, as the technology is now very sophisticated and fast. A routine exam can be conveniently completed in 3 to 10 minutes.
Patient preparation, contrast media and laboratory values
The majority of all examinations are carried out using an iodine-containing contrast agent that is injected intravenously. Since contrast medium weakens X-rays more than water, it makes blood vessels and well-perfused areas appear lighter, as it is in the blood, which contrasts with areas with little or no blood. In rare cases, however, it can lead to complications.
Before a planned CT examination, the radiologist is therefore usually asked for two values from the laboratory blood test. These are the creatinine - and thyrotropin value or just the "cre- and TSH level".
In the case of an existing iodine deficiency trying pituitary gland , the thereby caused thyroxine deficiency (iodine for thyroxine formation essential) to be compensated by an increased secretion of TSH. In such a situation, the administration of the iodine-containing contrast agent would lead to a sudden increase in thyroxine production and trigger sudden hyperthyroidism , in the worst case a thyrotoxic crisis . A lowered TSH value indicates hyperthyroidism and must therefore be examined further before the administration of contrast medium in order to avoid complications.
The contrast agent can also cause a pseudo-allergic reaction that can be life-threatening. If a contrast agent allergy is known, medication can be used in emergency situations to try to prevent a contrast medium reaction. Otherwise, contrast media should not be administered. Possibly. in such a case, alternative procedures must be used. Sonography or magnetic resonance tomography are often suitable for this purpose.
As a contrast agent reaction often causes nausea and vomiting, it is recommended that the examination be carried out on an empty stomach so that the stomach is empty and vomit cannot get into the airways.
The CT contrast agent is excreted via the kidneys and puts a strain on these organs. This is not a problem in healthy people, but previously damaged kidneys could be overwhelmed with the additional burden. The creatinine value is used to check whether there is any dangerous pre-existing kidney damage.
The contrast agent is injected using a high pressure pump. A peripheral venous catheter is placed over which it is inserted before the examination . A typical setting would be e.g. B. 50 ml of contrast medium administered at a flow rate of 3 ml / second. In the jargon, contrast medium is also abbreviated with "KM" and the intravenous method of introduction with "iv"; When using intravenously administered contrast media, the specialist staff then briefly refer to the "IV contrast medium", the recording is referred to as contrast medium recording. An image without the use of contrast medium is called a "native image".
In addition to the intravenous contrast agent described, contrast agent for drinking is often used in examinations of the abdomen. This essentially remains in the interior of the gastrointestinal tract and thus serves to better illustrate the same. The substance containing iodine or barium sulfate is dissolved in water and drunk by the patient before the examination. Flavorings are usually added so that it tastes like aniseed, for example . Typically, one liter of contrast medium is given to drink. In the case of questions that concern the last part of the intestine, an enema with contrast agent may also be necessary.
Before the examination, the patient should undress as much as possible in the area of the body to be examined (e.g. chest). This is not absolutely necessary because the X-rays penetrate clothing. Metal objects in clothing can cause artifacts in the radiation field and should therefore be removed before the examination.
Patient positioning and reference point
The patient lies down on the height-adjustable examination table, which can be lowered for easy positioning. During examinations of the head, the patient's head is fixed in order to prevent image blurring caused by involuntary head movements. The patient's arms lie comfortably against the body.
In order to be able to plan the area to be examined, it is necessary to define a zero point, to which all coordinate information relates. For this purpose, the operating staff moves the patient table up into the examination level and into the gantry. For a more precise planning of the reference point, a CT has a positioning laser so that it can be seen exactly where the selected reference point is projected onto the patient's body. A popular reference point is e.g. B. the German horizontal . So that the patient is not inadvertently blinded by the laser when setting this reference point, he or she is allowed to close his eyes for a short time. In principle, the location of the reference point can be freely selected and it makes sense to refer to the region to be examined. If the ankle is to be examined, it is therefore advisable to set the reference point near the ankle. Once the location has been determined, the coordinate system of the device is "zeroed" to this point by pressing a corresponding button on the device. All information in the examination protocol as well as in the later picture refer to this zero point.
Planning the investigation area
As a rule, preconfigured, so-called "examination protocols" are stored on the device for each possible examination, which the user selects depending on the medical question. Among other things, it is specified in the protocol where the reference point for the examination is to be set. The first image of every examination is the overview image. The technician draws the area to be depicted in this overview image with the help of movable image cursors. Alternatively, position information can also be entered numerically manually, whereby the position and direction designations customary in medicine are used. For a recording of the lungs with a reference point in the sternum , z. For example, an overview image is made that extends from superior 300 to inferior 200, which means that it extends from 300 mm “headward” from the zero point to 200 mm “footward” from the reference point. The following sectional drawing will be located within this area.
The recording (s)
The procedure and duration of the CT scan (s) depend heavily on the examination region and the question. For example, if an arm or leg fracture is to be diagnosed, only a single series of images is usually recorded.
No contrast agent is required to visualize the bone or kidney stone. If the ability to assess the soft tissue is not desired, no contrast agent is injected. In contrast, contrast media is almost always used for questions relating to the chest and / or abdominal cavity (such a contrast medium allergy or renal insufficiency do not prohibit this). Depending on the question, a region is scanned one or more times. The following recording types are typically used:
- Native image without administration of contrast agent
- Arterial image showing the arteries being filled but not the veins; It is not very suitable for assessing the tissue and is started approx. 20 to 30 seconds after administration of the contrast medium.
- Venous image showing veins and tissue in good contrast and taken approx. 60 to 70 seconds after administration of the contrast medium.
- Occasionally also: late exposures (LVCT = late venous CT), which are taken 90 seconds to a few minutes after administration of the contrast medium.
Since a CT scan of the chest and / or abdomen takes several seconds even with the fastest devices, the patient is asked to hold their breath during the scan. Otherwise image disturbances can be the result, comparable to the "blurring" in photography. Stored voice commands are now issued fully automatically by the device, the operating personnel usually do not speak them themselves (but can still do this in individual cases). In addition, there is a numerical display on some devices that informs the patient about the remaining breath hold time. If several images are taken over the same region, the patient is asked several times to hold their breath. An example of such a recording sequence is the search for metastases in the liver.
Images of the lungs are taken while the patient is breathing to ensure that the lung tissue has fully expanded. Consequently, the patient is asked to inhale and then hold their breath. Since it is more comfortable for the patient to first exhale and then hold their breath and the breathing position is irrelevant for images of the abdominal cavity, these sequences ask to hold their breath after exhaling.
The CT image
In the first few years, CT images showed a significantly higher resolution in the transverse image plane than in the sagittal or coronal plane. Transversal sections were therefore the only sensible form of image representation at that time; Until today, radiology has preferred to find transversal sections. For orientation: the viewer looks from below (as seen from the patient) at a transverse section, which is why what is on the left from the patient's point of view is on the right in the image.
Hounsfield scale and windowing
In the CT image, the weakening of the tissue for the X-ray spectrum emitted by the tube is shown in the form of gray values. The attenuation values are converted into so-called CT numbers and displayed on the Hounsfield scale . By definition, air has the CT number −1000 and water has the value 0. The reason for the conversion is that the spectral composition of the X-ray radiation used varies depending on recording parameters such as tube voltage and pre-filtering. If the attenuation values were displayed directly in the CT image, the image would turn out differently in each case. A comparison of images, as is essential for diagnosis in medicine, would not be possible in this way. This problem is avoided by normalizing the measured attenuation to the attenuation values of water and air.
A gray value is assigned to each CT number for the visual representation. However, since the human eye is not able to resolve the 4000 gray values that can be differentiated by the device, a dynamic range of the image that is optimized for the respective question is displayed with the help of the windowing .
In medical terminology , a fabric that has a lower than expected degree of absorption is called hypodense ( hypodensity ); if the attenuation coefficient is higher than hyperdense ( hyperdensity ). Two pixels that represent tissue with the same degree of absorption are isodense to one another .
Multiplanar reformation and 3D representations

Only with the introduction of multi-line spiral CTs in the mid-1990s did isotropic voxels appear in computed tomography . Since all current (2011) clinical CTs can generate small isotropic voxels, a high spatial resolution is possible in any spatial direction. The multiplanar reformation also enables sagittal and coronal representations in high quality, which are much easier for the non-radiologist to understand. The maximum intensity projection represents the maximum values from a freely selectable data volume, which are projected onto a plane, comparable to a shadow image. Thanks to the computing power available today on evaluation or PACS workstations, high-quality 3D representations in the form of MIP , surface rendering or - the most complex and impressive - raycasting can also be generated from the data.
For the radiologist in the clinical routine, the MIP is very helpful for vascular imaging and the search for lung metastases. A 3-D display is useful for the surgeon to visualize multi-fragment fractures preoperatively. Ray tracing and MIP are also used in the context of special applications for visualizations in computer tomography of the heart and virtual colonoscopy .
Sliding thin slab
The smallest possible slice thickness of today's CTs is around 0.3 mm. Although thin layers allow the display of the smallest image details, they are the reason for the - despite all the technical progress - still high radiation exposure due to computer tomographic examinations, because the level of image noise is largely determined by the layer thickness selected. Only in rare cases does the radiologist need a layer thickness of 1 mm or less for the diagnosis. On the other hand, images of a (low-noise) thick-layer reconstructed examination can only be converted into thin layers to a limited extent and only if the raw data is available. The greater the slice thickness in a CT image, the lower the noise it is, but the greater the probability that artifacts will appear in the image due to the partial volume effect . This dilemma can be circumvented by the sliding thin slabs representation (abbreviated sts). The images are reconstructed in thin layers (e.g. 1 mm thick and less), but displayed in thick layers (e.g. 5 mm). Example: Assuming a 1 mm reconstruction with a 5 mm representation, 5 slices are added. If the radiologist scrolls through the image, the next 1 mm section is added to the display and the last 1 mm section is removed. An image with an effective thickness of 5 mm is displayed again. The viewed image is low-noise like an image that would have been recorded with a thickness of 5 mm, but it is possible to scroll with an increment of 1 mm. In addition, the layer thickness can be reduced to 1 mm or increased beyond 5 mm at any time. In some post-processing workstations, averaging in the sts representation can take the form of averaging (classic STS), MIP, Min-IP or VR (Volume Rendering = Raycasting). It is also sometimes possible to convert the views of multiplanar reformatted images into sts representations.
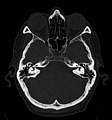
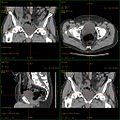
Cranial computed tomography The temporal bone and paranasal sinuses are shown . Due to the high resolution of the image of the 64-line CT, even the ossicles can be recognized.

Coronally reformatted representation of the abdomen and pelvis; are easy to recognize u. a. the liver and the two kidneys.
Combination of multiplanar reformatting and sliding thin slab . The image cursor is located in the urinary bladder . The original layer thickness is 1.25 mm, all views are shown as averaged (= average) in 3.7 mm or 3.8 mm thickness.

Combination of multiplanar reformatting and sliding thin slab . The image cursor is located in the right lung. The sts image stacks are shown in the form of MIP representations (STS-MIP). At the top left is a VR representation of the lungs; it shows a view of the lung cut coronally at the cursor position.
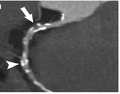
CT angiography; by means of multiplanar reformation (here the so-called curved MPR ), sectional representations along any desired vascular courses are possible, whereby the arteriosclerosis shown can be visualized very well.


Radiation exposure
Radiation exposure is a disadvantage of computed tomography . For example, if a CT image is compared with natural radiation exposure , a typical abdomen image leads to an exposure that corresponds to 2.8 years of natural background radiation. Although this about 500 times higher than in a chest - X-ray image , it is also in this dose range statistically not possible to return a later occurring disease with reasonable assurance to the previous radiation exposure. So far, the frequency of illnesses resulting from a much higher radiation exposure has been extrapolated linearly to the expected cases with low radiation exposure, although no reliable statistics are available for this assumed risk. Conceivable - but still not statistically proven - would also be hormesis effects (i.e. positive effects) with low radiation doses. There are a number of studies that point in this direction. In addition, however, a mitohormesic effect is also possible, according to which particularly small doses tend to have a harmful effect.
However, as long as there is no conclusive evidence that there is no risk or a significantly lower risk with low radiation exposure than there is beyond doubt with high radiation doses, this assumed risk must be taken into account when establishing the indication . The high informative value of the CT can justify the implementation. According to Heyer, doctors underestimate the radiation exposure of computed tomography: In 2003, this accounted for a good 6% of all X-ray examinations , but was responsible for more than 50% of medical X-rays . More than 62 million CT scans are performed annually in the United States . According to experts, every third of these examinations is not necessary. A review in the New England Journal of Medicine warns that CT scans now being performed could account for 1.5–2% of all cancers in a few decades. However, the authors of the review also made it clear that the benefits outweigh the risks in the established indications . A study published in 2009 puts 70 million CT scans in the US responsible for 29,000 cancer cases and puts the annual CT deaths in the US at 14,500. According to a new study, children who have had multiple CT scans of the head have a slightly increased risk of cancer later on. In girls, every 300th to 390th CT scan of the abdomen and pelvis would lead to an additional cancer; with spinal scans, depending on age, every 270th to 800th scan would lead to an additional cancer; Head CTs in particular would increase the risk of leukemia . Another study showed that children who had a CT scan had a 24 percent increased risk of developing cancer later; every additional CT scan would have increased the risk by 16 percent.
The radiation exposure from a CT image is described quantitatively by the parameters CTDI and DLP . If you multiply the CTDI by the length of the irradiated area, you get the DLP. If the irradiated region is known, the organ doses of the affected organs can be calculated from this and, in turn, the effective dose . The following table shows the effective doses of typical examinations based on 75 kg standard patients. The dose actually used for a CT examination can, however, be many times higher in individual cases due to the strong dependency on body mass (thickness of the layer to be irradiated), especially on the trunk (thorax / abdomen).
| examination | Effective dose ( mSv ) | Absorbed dose ( mGy ) |
|---|---|---|
| Natural radiation exposure per year | 2.1 | 2.4 |
| Head CT | 1.5-2.3 | 56 |
| Abdomen CT | 5.3-10 | 14th |
| Chest CT | 5.8-8 | 13 |
| Chest, abdomen, and pelvic CT | 9.9 | 12 |
| Screening mammography | 0.2-0.6 | 3 |
| Chest x-ray | 0.02-0.1 |
The underlying unit Sievert does not take into account differences in the intensity curve and the spectral composition between artificially generated and natural X-rays.
Parameters influencing radiation exposure
One of the most important parameters for the image quality of a CT is the image noise , which is mainly caused by quantum noise in the detector. An improvement in the image quality is associated with changes in the recording parameters, which usually lead to an increase in the patient's radiation exposure. For reasons of radiation protection, the examination parameters should be selected so that the noise component in the image is sufficiently low that a reliable diagnosis is still possible. Consequently, in accordance with the ALARA principle, the aim here is not as good a picture as possible, but only a sufficiently good picture.
The relationship between the image noise , the selected reconstruction algorithm , the attenuation , the system efficiency , the milliampere-second product and the slice thickness is:


This equation shows, among other things, that if the attenuation is quadrupled, the image noise doubles. The selected reconstruction algorithm can change the radiation dose required for a certain image quality by 30–40 percent.
Pre-filtering the X-rays
The emission spectrum of every X-ray tube contains low-energy radiation components that are completely absorbed by the examination subject and therefore do not contribute to the imaging. To reduce radiation exposure, an X-ray filter made of sheet metal several millimeters thick (e.g. made of aluminum, copper or beryllium) is installed; a minimum pre-filtering has even been required by law for years. The sheet completely absorbs the low-energy components of the X-ray spectrum, but also reduces the intensity of the spectral components used for imaging.
The dose rate of a tube can therefore only be described with the specifications of tube voltage and tube current if the pre-filtering is known in addition to the focus-object distance and is included in the calculation.
Tube voltage
An increase in the tube voltage increases the radiation exposure for the patient with the same tube current. In classical radiography , this also reduces the image contrast ; in CT, on the other hand, only the Hounsfield values of dense bone structures are slightly reduced, since the image contrast is determined purely by the choice of the Hounsfield window.
Photons of higher energy are weakened less by the tissue than low-energy photons, but the total energy deposited in the tissue increases sharply. With tube pre-filtering through 2 mm copper, the equivalent dose rate constant at 100,000 volts = 100 kV tube voltage is 0.35 mSv · m² / mA · min - at 140 kV tube voltage, however, it is already approx. 1.4 mSv · m² / mA · min. It follows that an X-ray tube at 140 kV delivers a dose rate that is 4 times higher than at 100 kV if the tube current is left unchanged.
For reasons of radiation protection it would therefore be desirable to work with low tube voltages of around 60–80 kV, which is seldom possible. For imaging in computer tomography, a high intensity (= dose rate) of the X-rays is required. When using the most powerful rotating anode tubes, the required dose rate is unfortunately still generally higher than can be achieved with the highest adjustable tube current at an anode voltage of, for example, 80 kV. In order to ensure a sufficiently low image noise, there is usually no other choice than to raise the tube voltage above the value that is optimal for radiation protection reasons, because the efficiency of an X-ray tube increases with the square of the tube voltage. Values of around 120 kV are usual, and 140 kV in corpulent patients.
Artifacts caused by beam hardening appear more pronounced the lower the tube voltage. This is another reason why more than 100 kV tube voltage is usually used.
Tube current
The tube current is linear to the dose; H. doubling the tube current doubles the radiation exposure.
Rotation time
It is the same with the rotation time. The two parameters are therefore usually combined. The product of rotation time and tube current is given in milliampere-seconds, abbreviated in the equation above with Q and the unit mAs. If the rotation time of the tube is halved, the tube current must therefore be doubled if the image noise is to remain constant.
Relationship between image noise and layer thickness
It also follows from the above equation that if the slice thickness is halved (with the same rotation time), the tube current must be doubled if the image noise is to remain constant. Conversely, the tube current can be halved if the layer thickness is doubled. In order to halve the image noise, the tube current must be quadrupled. Alternatively, the layer thickness can be quadrupled or both can be doubled.
Pitch, reconstruction filter and contrasting
The radiation exposure is also largely determined by the pitch factor chosen . The relationship is linear: if the pitch factor is doubled with otherwise the same parameters, the radiation exposure is halved.
In addition to the pitch factor, the parameter f A also contains the influence of the convolution kernel of the Radon transformation used for the image reconstruction : This can have a smoothing or contrast-enhancing effect. In addition to the contrast, the image noise is also increased. can differ by up to a factor of 5 depending on the convolution core. The convolution cores are named slightly differently depending on the manufacturer. Smoothing cores are called smooth or soft , the standard core is usually standard , contrast-enhancing are bone , edge , lung , high or ultra- high . By choosing a suitable folding kernel, the image for the tissue to be diagnosed can be calculated with optimal quality and thus unnecessary radiation dose can be avoided. A common contrast enhancement mode is called HR-CT (High Resolution CT).
Ways to Reduce Radiation Exposure
A number of measures can reduce the patient's exposure to radiation. A dose saving, which is desirable for reasons of radiation protection, also means a reduction in the tube load, which ultimately increases the service life of the tube. Since CT tubes cost higher 5-digit amounts, this creates a further incentive to reduce the dose - at least for the resident radiologist, who has to bear the costs of changing the tube himself.
Examination area and medical admission protocol
First and foremost, it is the duty of the radiologist, who must limit the number of CT examinations to the cases that are actually clearly indicated. Every additional exposure means an additional radiation exposure and all too often several exposures (native, arterial contrast medium phase, venous contrast medium phase, late phase) are taken over the same examination region. The dose can also be reduced easily and efficiently by limiting the scan area to the relevant examination region.
Technical recording protocol
With the choice of the correct examination protocol with the layer thickness, pitch factor, convolution core and image noise optimized for the question, the radiographer has another, very powerful option for saving doses. In the case of slim patients and children, work can and should be done in tube voltage ranges of 60 to 100 kV, which are optimal for radiation protection reasons.
Dose modulation
CTs from all major manufacturers now have dose modulation. The tube current is adapted to the existing weakening, both in the xy and in the z direction. This means that when recording the lungs, the performance is reduced compared to the abdomen. But the tube current is also modulated during rotation. Since the human body has an approximately oval cross-section, the tube load is adapted to this fact. The service is reduced if blasting is carried out from the front or from the rear (from the patient's perspective) and increased if blasting is carried out from the side. This dose control is usually combined with a second automatic system that regulates the tube current also depending on the patient's body mass index . Manufacturers use different names for these functions, e.g. B. Auto-mA, Smart-mA, Caredose 4D, Doseright or Sure-Exposure.
Layer thickness
If several layers are shown summed up, this reduces the resolution in the image, but also the image noise. If the doctor dispenses with a high resolution because he can recognize the findings sufficiently well in a representation with a slice thickness of, for example, five millimeters, a significant dose can be saved by choosing a recording protocol that is tailored to this. The use of the sliding thin slab representation can ultimately also contribute to reducing the dose.
Manufacturer of CT systems
- GE Healthcare
- Philips Germany
- Siemens Healthineers
- Mediso
- Canon (formerly Toshiba )
- Nikon
- Yxlon
- diondo
Alternatives
In 1977 the first studies on magnetic resonance imaging , or MRI for short, were published on humans.
This procedure, also known as magnetic resonance imaging , offers two major advantages:
- No potentially carcinogenic X-rays are used.
- Organs and tissue can also be imaged with high soft tissue contrast without the use of a contrast agent , which is a weighty argument, especially for patients with impaired kidney function. The soft tissue contrast is even significantly better than that of the most modern computer tomographs.
A disadvantage for a long time was the poor availability due to the higher purchase price of the MRT devices. The strong magnetic field , the confined space in the device and the examination time which is still long compared to CT bring further restrictions: For example, patients requiring intensive medical monitoring, patients with claustrophobia or patients who are B. can not lie quietly for a long time due to pain, can only be examined in the MRI to a limited extent. The considerably longer examination time is still a relevant disadvantage with regard to the uncertainty caused by physiological patient movement (heart, lungs, intestines). In addition, although MRT is able to display soft tissues with excellent soft tissue contrast, it has a disadvantage when it comes to displaying bones and teeth. MRI is therefore often not an alternative, but a complementary procedure.
In the dental field, an alternative imaging method is digital volume tomography (= DVT). For angiography systems and C-arms, software options are sometimes available that also enable spatial representation in the form of rotational angiography . In DVT as well as in rotational angiography, algorithms similar to those used in CT are used for image calculation.
Diagnostics in Germany
| Diagnosis | 2005 | 2010 | 2011 | 2012 | 2013 |
|---|---|---|---|---|---|
| Imaging diagnostics | 5,073,309 | 8,417,123 | 9,125,033 | 9,728,437 | 10.255.233 |
| Computed tomography (CT) | 2,972,307 | 4,183,728 | 4,450,125 | 4,709,286 | 4,957,593 |
| Magnetic resonance imaging (MRI) | 1,008,944 | 1,518,625 | 1,622,007 | 1,696,235 | 1,767,005 |
Literature on the history of CT
- Cornelius Borck: Computed Tomography. In: Werner E. Gerabek , Bernhard D. Haage, Gundolf Keil , Wolfgang Wegner (eds.): Enzyklopädie Medizingeschichte. De Gruyter, Berlin / New York 2005, ISBN 3-11-015714-4 , p. 268 f.
Web links
Individual evidence
- ↑ a b c d e f g h i j k l m n o p q r s t u W. A. Calendar: Computertomographie. Basics, device technology, image quality, applications with multi-slice spiral CT. Publicis MCD advertising agency, Munich 2000, ISBN 3-89578-082-0 .
- ↑ TM Buzug: Introduction to Computed Tomography: Mathematical-physical basics of image reconstruction. Springer, Berlin / Heidelberg / New York 2002, ISBN 3-540-20808-9 limited preview in the Google book search.
- ↑ WA Calendar: Computed Tomography. Basics, device technology, image quality, applications. 2., revised. and exp. Edition. Publicis Corporate Publishing, Erlangen 2006, ISBN 3-89578-215-7 .
- ^ Cornelius Borck: Computed tomography. 2005, p. 268.
- ^ Allen M. Cormack: My Connection with the Radon Transform. In: S. Gindikin, P. Michor (Eds.): 75 Years of Radon Transform. International Press, 1994, ISBN 1-57146-008-X , pp. 32-35.
- ↑ a b Philip Gabriel: Experimental study to compare the image quality of axial sectional images and multiplanar reformations of computed tomography using vertebral body preparations. (PDF; 9.5 MB) In: Dissertation. Medical Faculty of the Albert Ludwig University of Freiburg im Breisgau, 2004, accessed on April 24, 2009 (German).
- ↑ ACTA Model 0100 CT Scanner National Museum of American History
- ↑ GE Healthcare Product Features: eSpeed. GE Healthcare, 2009, archived from the original on September 28, 2007 ; accessed on June 11, 2019 (English, original website no longer available).
- ↑ Info on www.allbusiness.com ( Memento from December 4, 2008 in the Internet Archive )
- ↑ Toshiba website, Aquilion One ( Memento of March 28, 2013 in the Internet Archive )
- ↑ Siemens AG - First dual source computer tomograph in the world. (No longer available online.) November 17, 2005, archived from the original on March 2, 2019 ; Retrieved January 30, 2008 . Info: The archive link was inserted automatically and has not yet been checked. Please check the original and archive link according to the instructions and then remove this notice.
- ↑ Gabriele Wagner: CT with double tube: faster, sharper - and the radiation dose drops. Doctors newspaper online, November 30, 2006, accessed January 30, 2008 .
- ↑ Willy A. Calendar: Basic principles of Dual Energy CT. (PDF; 665 kB) IMP Uni Erlangen, March 4, 2011, accessed on June 12, 2013 .
- ↑ Use of two-spectrum CT to determine bone mineralization on the vertebral body . In: Biomedizinische Technik / Biomedical Engineering , 1985, Volume 30, Issue s1, pp. 189-190, ISSN 1862-278X (Online) / ISSN 0013-5585 , (Print) doi: 10.1515 / bnte.1985.30.s1.189 .
- ^ Siemens Healthcare website .
- ↑ Auntminnie News .
- ↑ a b Iterative Image Reconstruction Method (ASIR): Lowering CT Radiation Dose and Improving Image Quality Radiology Rounds ( Memento of the original dated August 12, 2011 in the Internet Archive ) Info: The archive link was inserted automatically and has not yet been checked. Please check the original and archive link according to the instructions and then remove this notice. .
- ^ GE Healthcare .
- ^ Dual Energy, Toshiba Medical Systems toshiba-medical.eu .
- ↑ IQon Spectral CT | Philips Healthcare. Retrieved December 7, 2018 .
- ↑ Toshiba Medical Systems Aquiliion ONE ( Memento of the original from September 17, 2011 in the Internet Archive ) Info: The archive link was inserted automatically and has not yet been checked. Please check the original and archive link according to the instructions and then remove this notice. .
- ↑ Iterative reconstruction slahes radiation dose diagnosticimaging.com ( Memento of the original from January 15, 2013 in the Internet Archive ) Info: The archive link was inserted automatically and has not yet been checked. Please check the original and archive link according to the instructions and then remove this notice.
- ^ Canon Medical Receives FDA Clearance for AiCE Reconstruction Technology for CT. In: itnonline.com. Imaging Technology News, June 18, 2019, accessed August 24, 2020 .
- ↑ Ramandeep Singh, Subba R. Digumarthy, Victorine V. Muse, Avinash R. Kambadakone, Michael A. Blake: Image Quality and Lesion Detection on Deep Learning Reconstruction and Iterative Reconstruction of Submillisievert Chest and Abdominal CT . In: American Journal of Roentgenology . tape 214 , no. 3 , March 2020, ISSN 0361-803X , p. 566-573 , doi : 10.2214 / AJR.19.21809 ( ajronline.org [accessed August 25, 2020]).
- ↑ Advanced intelligent Clear-IQ Engine (AiCE). In: Global website of CANON Medical Systems. CANON Medical Systems, 2019, accessed on August 24, 2020 .
- ↑ Archive link ( Memento of the original dated February 8, 2017 in the Internet Archive ) Info: The archive link was inserted automatically and has not yet been checked. Please check the original and archive link according to the instructions and then remove this notice.
- ↑ Stroke deployment mobile. Berlin fire brigade , accessed on May 17, 2019 .
- ↑ STEMO Stroke mobile application. In: schlaganfallforschung.de. February 18, 2011, accessed December 27, 2014 .
- ↑ GigaMesh Software Framework : Advanced documentation methods in studying Corinthian black-figure vase painting on YouTube , accessed on November 27, 2018 (computed tomography and unrolling of Aryballos No. G26 from the Archaeological Collection of the University of Graz , see also doi: 10.11588 / heidok. 00025189 ).
- ↑ hil / aerzteblatt.de: MRI is the most common in Germany according to the Barmer doctor report. In: aerzteblatt.de . February 1, 2011, accessed December 27, 2014 .
- ↑ N. Zhang, H. Tang (2012): Dissecting anode swelling in commercial lithium-ion batteries In: Journal of Power Sources 218: 52-55 doi: 10.1016 / j.jpowsour.2012.06.071
- ↑ T. Waldmann (2014): A Mechanical Aging Mechanism in Lithium-Ion Batteries In: Journal of The Electrochemical Society 161: A1742 doi: 10.1149 / 2.1001410jes
- ^ STS-MIP: A new reconstruction technique for the CT of the chest. In: Journal of computer assisted tomography. September / October 1993.
- ↑ Walter Willems: Experts warn against computed tomography. In: welt.de . February 13, 2008, accessed December 27, 2014 .
- ↑ ICRP 60 from 1990.
- ^ TD Luckey: Physiological benefits from low levels of ionization radiation. In: Health physics , 1982, 43 (6), pp. 771-789.
- ↑ Beautiful pictures tempt you to unnecessary examinations .
- ↑ RöFo. 2007, 179 (3), pp. 261–267, quoted from Der Allgemeinarzt , 8/2007, p. 18.
- ↑ Radiation exposure: warning of preventive CT. In: Focus Online . July 13, 2007, accessed December 27, 2014 .
- ^ The New England Journal of Medicine , 2007, 357, pp. 2277-2284.
- ↑ Amy Berrington de González et al. a .: Projected cancer risks from computed tomographic scans performed in the United States in 2007 . In: Archives of Internal Medicine . 169, No. 22, December 2009, pp. 2071-2077. doi : 10.1001 / archinternmed.2009.440 . PMID 20008689 . ; See also “We Are Giving Ourselves Cancer,” The New York Times, Jan. 30, 2014
- ^ Dennis Ballwieser : Computed tomography: Not every child has to go into the tube. In: Spiegel Online , June 7, 2012, accessed on June 9, 2012. The article states that the source is: Mark S. Pearce u. a .: Radiation exposure from CT scans in childhood and subsequent risk of leukemia and brain tumors: a retrospective cohort study . In: The Lancet , doi: 10.1016 / S0140-6736 (12) 60815-0
- ^ Alan R. Schroeder: The Harm in Looking. In: JAMA Pediatrics , p. 1, doi: 10.1001 / jamapediatrics.2013.356 .
- ↑ JD Mathews, AV Forsythe, Z. Brady, MW Butler, SK Goergen, GB Byrnes, GG Giles, AB Wallace, PR Anderson, TA Guiver, P. McGale, TM Cain, JG Dowty, AC Bickerstaffe, SC Darby: Cancer risk in 680,000 people exposed to computed tomography scans in childhood or adolescence: data linkage study of 11 million Australians. In: BMJ , 346, 2013, pp. F2360 – f2360, doi: 10.1136 / bmj.f2360
- ↑ a b Environmental radioactivity and radiation exposure in 2006 . Federal Ministry for the Environment, Nature Conservation and Nuclear Safety
- ↑ JM Cuttler, M. Pollycove: Nuclear energy and health: and the benefits of low-dose radiation hormesis . In: Dose-Response . 7, No. 1, 2009, pp. 52-89. doi : 10.2203 / dose-response.08-024.Cuttler . PMID 19343116 . PMC 2664640 (free full text).
- ↑ a b c d e f g h i P. C. Shrimpton, HC Miller, MA Lewis, M. Dunn: Doses from Computed Tomography (CT) examinations in the UK. 2003 Review ( Memento of the original from September 22, 2011 in the Internet Archive ) Info: The archive link was inserted automatically and has not yet been checked. Please check the original and archive link according to the instructions and then remove this notice.
- ↑ a b c d Orientation aid for radiological and nuclear medicine examinations . Recommendation of the radiation protection commission . In: Reports of the Radiation Protection Commission (SSK) of the Federal Ministry for the Environment, Nature Conservation and Nuclear Safety, Issue 51, Bonn 2006, ISBN 3-87344-130-6 PDF 850 kB
- ↑ CT volume reconstruction with the MUSCOT algorithm or TCOT algorithm, presentation by J.Blobel, Toshiba drg-apt.de (PDF; 1.6 MB).
- ↑ Hanno Krieger: Radiation Physics, Dosimetry and Radiation Protection. Volume 1: Basics. 5th edition. BG Teubner, Stuttgart / Leipzig / Wiesbaden 2002, ISBN 3-519-43052-5 .
- ↑ Radiation Dose Modulation Techniques in the Multidetector CT Era: From Basics to Practice . Radiographics.
- ^ R. Damadian, M. Goldsmith, L. Minkoff: NMR in cancer: XVI. Fonar image of the live human body . In: Physiological Chemistry and Physics . 9, 1977, pp. 97-100.