
List of the greatest empires and empires

The following list sorts historical empires and empires according to their size. The Estonian historian Rein Taagepera has defined an empire “as any major sovereign political unit whose constituent parts are not sovereign”. The area of an empire consists of the territory over which it has military and political control.

This article provides a list of the greatest empires in world history , but the list is not and cannot be final as deciding which entities to consider empires is difficult and controversial. There are several size terms that can be used to rank empires. For each of these terms, only estimates can be made for most historical empires. Furthermore, there is usually no clear consensus among historians about the best estimate - if only because there is often no clear information about the historical borders or the population of an empire. Therefore, the values given here should only be interpreted as indicative and not as an exact ranking.
According to area
Empires at maximum expansion
Imperial size is defined in this list as control over land area.
| Empire / State | Maximum expansion | ||
|---|---|---|---|
| Size in millions of km 2 | % of the world area | time | |
| British colonial empire | 35.5 | 23.84% | 1920 |
| Mongol Empire | 24.0 | 16.11% | 1270 or 1309 |
| Russian Empire | 22.8 | 15.31% | 1895 |
| Soviet Union | 22.3 | 14.97% | 1945 |
| Qing Dynasty | 14.7 | 9.87% | 1790 |
| Spanish colonial empire | 13.7 | 9.20% | 1810 |
| Portuguese colonial empire | 13.4 | 9.19% | 18201849 |
| Second French colonial empire | 11.5 | 7.72% | 1920 |
| Abbasid Caliphate | 11.1 | 7.45% | 750 |
| Umayyad Caliphate | 11.1 | 7.45% | 720 |
| Yuan Dynasty | 11.0 | 7.39% | 1310 |
| United States of America | 9.67 | 6.49% | 1899 |
| Xiongnureich | 9.0 | 6.04% | 176 BC Chr. |
| Japanese Empire | 8.5 | 5.71% | 1942 |
| Empire of Brazil | 8.337 | 5.60% | 1889 |
| Eastern Han Dynasty | 6.5 | 4.36% | 100 |
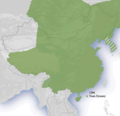
| Ming Dynasty | 6.5 | 4.36% | 1450 |
| Rashidun Caliphate | 6.4 | 4.30% | 655 |
| Khanate of the Gök Turks | 6.0 | 4.03% | 557 |
| Golden Horde | 6.0 | 4.03% | 1310 |
| Western Han Dynasty | 6.0 | 4.03% | 50 BC Chr. |
| Achaemenid Empire | 5.5 | 3.69% | 500 BC Chr. |
| Tang Dynasty | 5.4 | 3.63% | 715 |
| Macedonian Empire | 5.2 | 3.49% | 323 BC Chr. |
| Ottoman Empire | 5.2 | 3.49% | 1683 |
| Maurya Empire | 5.0 | 3.36% | 250 BC Chr. |
| Roman Empire | 5.0 | 3.36% | 117 |
| Tibetan Empire | 4.6 | 3.09% | 800 |
| Empire of Mexico (1821–1823) | 4,429 | 2.97% | 1821 |
| Timurid Empire | 4.4 | 2.95% | 1405 |
| Fatimid Caliphate | 4.1 | 2.75% | 969 |
| East Turkish Khanate | 4.0 | 2.69% | 624 |
| Rich in Hephthalites | 4.0 | 2.69% | 470 |
| Hunnenreich | 4.0 | 2.69% | 441 |
| Mughal Empire | 4.0 | 2.69% | 1690 |
| Seljuk Empire | 3.9 | 2.62% | 1080 |
| Seleucid Empire | 3.9 | 2.62% | 301 BC Chr. |
| Italian colonial empire | 3,798 | 2.55% | 1938 |
| Ilkhan | 3.75 | 2.55% | 1310 |
| Khorezm Shahs | 3.6 | 2.42% | 1218 |
| Chagatai Khanate | 3.5 | 2.35% | 1310 or 1350 |
| Gupta Empire | 3.5 | 2.35% | 400 |
| Sassanid Empire | 3.5 | 2.35% | 550 |
| West Turkish Khanate | 3.5 | 2.35% | 630 |
| Western Xiongnu | 3.5 | 2.35% | 20th |
| First French colonial empire | 3.4 | 2.28% | 1670 |
| Ghaznavid Empire | 3.4 | 2.28% | 1029 |
| Sultanate of Delhi | 3.2 | 2.15% | 1312 |
| German colonial empire | 3,199 | 2.15% | 1912 |
| Song Dynasty | 3.1 | 2.08% | 980 |
| Uyghur kaganat | 3.1 | 2.08% | 800 |
| Western Jin Dynasty | 3.1 | 2.08% | 280 |
| Khazar Khanate | 3.0 | 2.01% | 850 |
| Sui dynasty | 3.0 | 2.01% | 589 |
| Samanid Empire | 2.85 | 1.91% | 928 |
| Byzantine Empire | 2.8 | 1.88% | 450 |
| Eastern Jin Dynasty | 2.8 | 1.88% | 347 |
| Mederreich | 2.8 | 1.88% | 585 BC Chr. |
| Parthian Empire | 2.8 | 1.88% | 0 |
| Rouran | 2.8 | 1.88% | 405 |
| Indo-Scythian Kingdom | 2.6 | 1.75% | 20th |
| Liao Dynasty | 2.6 | 1.75% | 947 |
| Greco-Bactrian Kingdom | 2.5 | 1.68% | 184 BC Chr. |
| Kushana | 2.5 | 1.68% | 200 |
| Later Zhao | 2.5 | 1.68% | 329 |
| Maratha | 2.5 | 1.68% | 1760 |
| Belgian colonial empire | 2,366 | 1.59% | 1939 |
| Almohad dynasty | 2.3 | 1.54% | 1150 |
| Jin dynasty (1115-1234) | 2.3 | 1.54% | 1126 |
| Qin Dynasty | 2.3 | 1.54% | 220 BC Chr. |
| First French Empire | 2.1 | 1.41% | 1813 |
| Kievan Rus | 2.1 | 1.41% | 1000 |
| Sultanate of the Mamluks | 2.1 | 1.41% | 1300 or 1400 |
| Third Portuguese Colonial Empire | 2.1 | 1.41% | 1900 |
| Cao Wei | 2.0 | 1.34% | 263 |
| Previous Qin | 2.0 | 1.34% | 376 |
| Former Zhao | 2.0 | 1.34% | 316 |
| Inca Empire | 2.0 | 1.34% | 1527 |
| Liu Song Dynasty | 2.0 | 1.34% | 450 |
| Northern Wei Dynasty | 2.0 | 1.34% | 450 |
| Dutch colonial empire | 1,939 | 1.30% | 1930 |
| Buyid dynasty | 1.6 | 1.07% | 980 |
| Eastern Wu Dynasty | 1.5 | 1.01% | 221 |
| Northern Qi | 1.5 | 1.01% | 557 |
| Northern Xiongnu | 1.5 | 1.01% | 60 |
| Northern Zhou Dynasty | 1.5 | 1.01% | 577 |
| Assyrian Empire | 1.4 | 0.94% | 670 BC Chr. |
| Eastern Maurya Empire | 1.3 | 0.87% | 210 BC Chr. |
| Liang Dynasty | 1.3 | 0.87% | 502 549 or 579 |
| Aksumite Empire | 1.25 | 0.84% | 350 |
| Shang dynasty | 1.25 | 0.84% | 1122 BC Chr. |
| Franconian Empire | 1.2 | 0.74% | 814 |
| Srivijaya | 1.2 | 0.74% | 1200 |
| Indo-Greek Kingdom | 1.1 | 0.67% | 150 BC Chr. |
| Mali Empire | 1.1 | 0.67% | 1380 |
| Polish-Lithuanian Union | 1.1 | 0.67% | 1480 or 1650 |
| Almoravid dynasty | 1.0 | 0.67% | 1120 |
| Harshareich | 1.0 | 0.67% | 625 or 648 |
| Pratihara dynasty | 1.0 | 0.67% | 860 |
| Holy Roman Empire | 1.0 | 0.67% | 1050 |
| Khmer Empire | 1.0 | 0.67% | 1290 |
| New Egyptian Empire | 1.0 | 0.67% | 1450 BC BC or 1300 BC Chr. |
| Ptolemaic Empire | 1.0 | 0.67% | 301 BC Chr. |
| Shu Han | 1.0 | 0.67% | 221 |
| Tahirid dynasty | 1.0 | 0.67% | 800 |
| Western Xia Dynasty | 1.0 | 0.67% | 1100 |
| Akkadian Empire | 0.8 | 0.54% | 2250 BC Chr. |
| Avars | 0.8 | 0.54% | 600 |
| Chu | 0.8 | 0.54% | 300 BC Chr. |
| First Portuguese colonial empire | 0.8 | 0.54% | 1580 |
| Songhaire empire | 0.8 | 0.54% | 1550 |
| Hyksos | 0.65 | 0.44% | 1650 BC Chr. |
| 26th Dynasty of Egypt | 0.65 | 0.44% | 550 BC Chr. |
| Austria-Hungary | 0.625 | 0.42% | 1905 |
| Caliphate of Cordoba | 0.6 | 0.40% | 1000 |
| Visigoth Empire | 0.6 | 0.40% | 580 |
| Kosala | 0.5 | 0.34% | 543 BC Chr. |
| Lydia | 0.5 | 0.34% | 585 BC Chr. |
| Magadha | 0.5 | 0.34% | 510 BC Chr. |
| Middle Egyptian Empire | 0.5 | 0.34% | 1850 BC Chr. |
| New Babylonian Empire | 0.5 | 0.34% | 562 BC Chr. |
| Shatavahana | 0.5 | 0.34% | 150 |
| 25th Dynasty of Egypt | 0.5 | 0.34% | 715 BC Chr. |
| Kshaharatas | 0.5 | 0.34% | 100 |
| Empire of the Sikhs | 0.49 | 0.34% | 1799 |
| New Hittite Kingdom | 0.45 | 0.30% | 1250 BC Chr. |
| Xia Dynasty | 0.45 | 0.30% | 1800 BC Chr. |
| Middle Assyrian Empire | 0.4 | 0.27% | 1080 BC Chr. |
| Ancient Egyptian Empire | 0.4 | 0.27% | 2400 BC Chr. |
| Kathargo | 0.3 | 0.20% | 220 BC Chr. |
| Mitanni | 0.3 | 0.20% | 1450 BC Chr. |
| Old Babylonia | 0.25 | 0.17% | 1690 BC Chr. |
| Aztec Empire | 0.22 | 0.15% | 1520 |
| Elam | 0.2 | 0.13% | 1160 BC Chr. |
| Phrygia | 0.2 | 0.13% | 750 BC Chr. |
| 2nd dynasty of Isin | 0.2 | 0.13% | 1130 BC Chr. |
| Urartu | 0.2 | 0.13% | 800 BC Chr. |
| Middle Hittite Kingdom | 0.15 | 0.10% | 1450 BC Chr. |
| Old Assyrian Empire | 0.15 | 0.10% | 1730 BC Chr. |
| Old Hittite Kingdom | 0.15 | 0.10% | 1530 BC Chr. |
| Ashanti Empire | 0.1 | 0.07% | 1872 |
| Larsa | 0.1 | 0.07% | 1750 BC Chr. |
| New Sumerian Empire | 0.1 | 0.07% | 2000 BC Chr. |
| Sumer | 0.05 | 0.03% | 2400 BC Chr. |
According to population
List of different empires according to their maximum percentage of the world population. All data are to be regarded as estimates. The Guinness Book of Records shows the Achaemenid Empire to be the greatest empire of all time with a share of approx. 44% of the world population. Other sources assume a share of 20% of the world population.
| Empire / State | Share of world population | time |
|---|---|---|
| Achaemenid Empire | 20.0% - 44.0% | 480 BC Chr. |
| Sassanid Empire | 37.1% | 7th century |
| Qing Dynasty | 36.6% | 1820 |
| Roman Empire | 35.6% | 2nd century |
| Umayyad Caliphate | 29.5% | approx. 720 |
| Mughal Empire | 29.2% | circa 1700 |
| Ming Dynasty | 28.8% | circa 1600 |
| Tang Dynasty | 28.0% | about 850 |
| Gupta Empire | 26.4% | about 400 |
| Han dynasty | 26.0% | 2nd century BC Chr. |
| Mongol Empire | 25.6% | 13th Century |
| British colonial empire | 23.1% | 1938 |
| Song Dynasty | 22.0% | about 1000 |
| Abbasid Caliphate | 20.0% | 850 |
| Rashidun Caliphate | 19.1% | 7th century |
| Kushana | 19.0% | 140 |
| Sultanate of Delhi | 18.9% | 1330 |
| Yuan Dynasty | 17.1% | 1290 |
| Spanish colonial empire | 12.3% | 17th century |
| Russian Empire | 9.8% | 1913 |
| Ottoman Empire | 7.1% | 17th century |
| Japanese Empire | 5.9% | 1942 |
| Second French colonial empire | 5.1% | 1938 |
| German colonial empire | 3.7% | 1910 |
| Dutch colonial empire | 3.5% | 1907 |
| Austria-Hungary | 2.9% | 1910 |
| Italian colonial empire | 2.3% | 1938 |
cards

British Empire 1921

Largest extension of the Mongol Empire
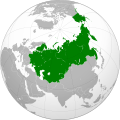
Russian Empire 1867

Spanish colonial empire 1790
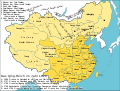
Qing Dynasty 1820
Yuan Dynasty 1294
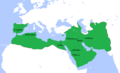
Umayyad Caliphate 750

First (green) and second (blue) French colonial empire

Largest expansion of the Portuguese colonial empire

Japanese Empire 1942

Ming Dynasty 1415
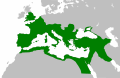
Roman Empire 117
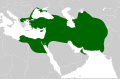
Achaemenid Empire 486 BC Chr.

Golden horde 1389
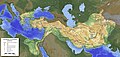
Macedonian Empire approx. 380 BC Chr.

Tibetan Empire around 800

Xiongnu 250 BC Chr.
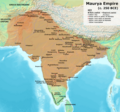
Maurya Empire 250 BC Chr.
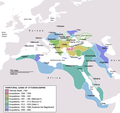
Ottoman Empire 1683

Khanate of the Gök Turks 572

Seleucid Empire approx. 300 BC Chr.

Timurid Empire 1405

Byzantine Empire 555

German colonial empire 1914


.svg)


.svg)


.GIF)


See also
- World history
- Timeline of historical state changes
- List of historical states in Asia
- List of historical states in Africa
- List of historical states in Africa
- List of historical states in Europe
Individual evidence
- ↑ Rein Taagepera: Size and Duration of Empires: Growth-Decline Curves, 600 BC to 600 AD . In: Social Science History . 3, No. 3/4, 1979, p. 117. doi : 10.2307 / 1170959 .
- ↑ a b c d e f g h i j k l m n o p q r s t u v w x y z aa ab ac ad ae af ag ah ai aj ak al am an ao ap aq ar as at au av aw ax ay az ba bb bc bd be bf bg bh bi bj bk bl bm bn bo bp bq br bs bt bu bv bw bx by bz ca cb cc cd ce cf cg ch ci cj ck cl cm cn co cp cq cr cs ct cu cv cw cx cy cz da db Rein Taagepera : Expansion and Contraction Patterns of Large Polities: Context for Russia . In: International Studies Quarterly . 41, No. 3, September 1997, pp. 492-502. doi : 10.1111 / 0020-8833.00053 .
- ↑ a b c d e f g h i j k l m n o p q r s t u v w x y z aa ab ac ad ae af ag ah ai aj ak al am an ao ap aq ar as at au av aw ax ay az ba bb bc bd be bf bg bh bi bj bk bl bm bn bo bp bq br bs bt bu bv bw bx by bz ca cb cc cd ce cf cg ch ci cj ck cl cm cn co cp cq cr cs ct cu cv cw cx cy cz da db dc dd Peter Turchin, Jonathan M. Adams, Thomas D. Hall: East-West Orientation of Historical Empires . In: Journal of world-systems research . 12, No. 2, December 2006, ISSN 1076-156X , pp. 222-223. Retrieved August 25, 2016.
- ^ A b Cesare Marchetti and Jesse H. Ausubel: Quantitative Dynamics of Human Empires. Accessed August 31, 2020 .
- ↑ a b c d e f g h i j k l m n o p q r s t u v w x y z aa ab ac ad ae af ag ah ai aj ak al am an ao ap aq ar as at au av aw ax ay az ba bb bc bd be bf bg bh bi bj bk bl bm bn bo bp bq br bs bt bu bv bw bx by bz ca cb cc cd ce cf cg ch ci cj ck cl cm cn co cp cq cr cs ct cu Rein Taagepera: Size and Duration of Empires: Growth-Decline Curves, 600 BC to 600 AD . In: Social Science History . 3, No. 3/4, 1979, pp. 121-122, 124-129, 132-133. doi : 10.2307 / 1170959 .
- ↑ a b c David H. James: The Rise and Fall of the Japanese Empire ( en ). Routledge, November 1, 2010, ISBN 978-1-136-92546-7 : "by 1942, this 'Empire' covered about 3,285,000 square miles"
- ↑ a b Área Territorial Brasileira ( pt ) Brazilian Institute of Geography and Statistics . Retrieved on October 16, 2016: “A primeira estimativa oficial para a extensão superficial do território brasileiro data de 1889. O valor de 8,337,218 km 2 foi obtido a partir de medições e cálculos efetuados sobre as folhas básicas da Carta do Império do Brasil , publicada em 1883. [The first official estimate of the surface area of the Brazilian territory dates from 1889. A value of 8,337,218 km 2 was obtained from measurements and calculations made on drafts of the Map of the Empire of Brazil, published in 1883. ] "
- ^ A b Jaime E. Rodriguez, Jaime E. Rodríguez O, Kathryn Vincent: Myths, Misdeeds, and Misunderstandings: The Roots of Conflict in US-Mexican Relations . Rowman & Littlefield, 1997, ISBN 978-0-8420-2662-8 , pp. 47 (English, google.com [accessed on June 14, 2020]): “When it was founded in 1821, the Mexican Empire extended over 4,429,000 km2 (not including the 445,683 km2 temporarily added by the short-lived union of the Central American provinces). "
- ^ A b Mark Harrison: The Economics of World War II: Six Great Powers in International Comparison . Cambridge University Press, 2000, ISBN 978-0-521-78503-7 , p. 3 (Accessed October 2, 2016).
- ^ Encyclopædia Britannica: Germany from 1871 to 1918 . Accessed on September 29, 2016: "At its birth Germany occupied an area of 208,825 square miles (540,854 square km) and had a population of more than 41 million, which was to grow to 67 million by 1914."
-
↑ a b c d Statistical information on the German colonies ( German ) Deutsches Historisches Museum . Accessed on September 29, 2016: "Unless otherwise noted, all information relates to the year 1912."
- German South West Africa : 835,100 km²
- Cameroon : 495,000 km²
- Togoland : 87,200
- German East Africa : 995,000
- German New Guinea : 240,000
- Marshall Islands : 400
- Kiautschou : 515
- Caroline Islands , Palau , and Northern Mariana Islands : 2,376
- German Samoa : 2 570
- ↑ a b c d Backpack-des-Oberkommandos-der-Wehrmacht-Soldiers-Atlas . ( archive.org [accessed June 14, 2020]).
- ↑ a b c d e f g h i j k l m n o p q r s t u v w x y z aa ab ac ad ae af ag ah ai aj ak al am an ao ap aq ar as at au Size and duration of empires growth-decline curves, 3000 to 600 bc In: Social Science Research . tape 7 , no. 2 , June 1, 1978, ISSN 0049-089X , p. 180–196 , doi : 10.1016 / 0049-089X (78) 90010-8 ( sciencedirect.com [accessed October 23, 2018]).
- ^ A b Various: Encyclopaedia Britannica, 11th Edition, "Austria, Lower" to "Bacon" Volume 3, Part 1, Slice 1 . October 12, 2008 (English, gutenberg.org [accessed June 14, 2020]): “It occupies about the sixteenth part of the total area of Europe, with an area (1905) of 239,977 sq. m. "
- ↑ Empire of the Sikh . In: Wikipedia . March 6, 2020 ( wikipedia.org [accessed April 18, 2020]).
- ↑ Empire of the Sikh . In: Wikipedia . March 6, 2020 ( wikipedia.org [accessed April 18, 2020]).
- ^ A b Obeng, J. Pashington: "Asante Catholicism: Religious and Cultural Reproduction Among the Akan of Ghana", p. 20. BRILL, 1996
- ↑ Largest empire by percentage of world population . In: Guinness World Records . ( guinnessworldrecords.com [accessed October 26, 2018]).
- ↑ a b McEvedy and Jones (1978).
- ↑ a b c d e f Maddison, op cit. Para estimativos alternos, ver la herramienta de búsqueda de USA / UK Economic History Services. ( Memento of the original from January 18, 2012 in the Internet Archive ) Info: The archive link was inserted automatically and has not yet been checked. Please check the original and archive link according to the instructions and then remove this notice.
- ↑ Existen distintos valores estimados para el Imperio romano. Scheidel (2006, p. 2) estima 60. Goldsmith (1984, p. 263) estima 55. Beloch (1886, p. 507) estima 54. Maddison (2006, p. 51, 120) estima 48. Roman Empire Population estima 65.
- ↑ Thomlinson (1975, Tabla 1).
- ↑ a b c d e f g h i j Maddison, USA / UK Economic History Services. ( Memento of the original from January 18, 2012 in the Internet Archive ) Info: The archive link was inserted automatically and has not yet been checked. Please check the original and archive link according to the instructions and then remove this notice.
- ↑ Harrison (1998, p. 3.7).
- ↑ Jean-Noël Biraben: Essai sur l'évolution du nombre des hommes . In: Population (French Edition) . tape 34 , no. 1 , 1979, p. 13-25 , doi : 10.2307 / 1531855 , JSTOR : 1531855 .
- ↑ Harrison (1998, p. 3.7).