Climate in Ostwestfalen-Lippe
The climate in Ostwestfalen-Lippe is determined by its location in the oceanic-continental transition area of Central Europe and by its location in the transition area between low mountain ranges and the North German lowlands . Ostwestfalen-Lippe lies in the area of the sub-Atlantic maritime climate, but has very weak continental influences in places.
description
The Atlantic climatic area is characterized by relatively evenly distributed and regular precipitation and relatively mild and a relatively balanced temperature over the year . The winters are mostly mild under the influence of the Atlantic and the summers are moderately warm. The climate is less continental . Under this influence, the temperature in winter tends to be colder, in summer tends to be warmer, and precipitation tends to be lower than under the influence of the predominantly sea climate. The topology of the area, however, causes a relatively uneven distribution of precipitation and temperatures within Ostwestfalen-Lippe.
The climate in Ostwestfalen-Lippe is on average significantly cooler and has more precipitation than most of North Rhine-Westphalia , but comparable to the climate of the northern Sauerland .
temperature
The basin locations of the Ravensberger Hügelland , the Weser Valley and the Westphalian Bight as well as the north in the North German Plain are on average up to 2 degrees Celsius warmer than the low mountain regions Wiehengebirge , Wesergebirge , Lipper Bergland , but especially the Teutoburg Forest , Eggegebirge and Paderborn plateau . In the basins and the Weser Valley, spring arrives up to two weeks earlier.
Rainfall
The prevailing wind direction from the southwest brings regular rainfall from the Atlantic . In particular, on the south (-western) side ( windward side ) of the above-mentioned low mountain range regions, in particular the Teutoburg Forest, the Egge Mountains and the Paderborn plateau, there are pronounced incline rain . The Teutoburg Forest and the Egge Mountains are "rain catchers". Here the amount of precipitation is 1000 mm, sometimes over 1200 mm. To the east of it are areas with little precipitation such as the Warburger Börde - with precipitation of only 700–750 mm. In particular, the basin areas are protected against the incline rain by their location. The prevailing wind direction from the southwest partially leads to the drying out of the soil , especially on the Paderborn plateau and encourages the spread of heather-like landscapes such as the Senne near Paderborn .
Selected climate stations
Detmold
For the Detmold district of Hiddesen , which is located relatively high up and directly on the Teutoburg Forest, the following data results, which are cooler and more humid compared to the city center:
|
Climate diagram for Hiddesen (180 m)
Source:
|
||||||||||||||||||||||||||||||||||||||||||||||||||||||||||||||||||||||||||||||||||||||||||||||||||||||||||||||||||||||||||||||||||||||||||||||||||
Gutersloh
Gütersloh is located in the Westphalian Bay south of the Teutoburg Forest at an altitude of around 75 m above sea level. NN . The long-term average from 1961 to 1990 is the annual temperature in Gütersloh 9.2 ° C and there was an average of about 762 mm of precipitation annually.
|
Average monthly temperatures and precipitation for Gütersloh (1961–1990)
Source: DWD
|
||||||||||||||||||||||||||||||||||||||||||||||||||||||||||||
Herford
Herford is located in the Ravensberger hill country in the Werre valley at an altitude of around 65 m above sea level. NN . Long-term average climate data (1971–2000):
|
Average monthly temperatures and precipitation for Herford (1971-2000)
Source: DWD
|
||||||||||||||||||||||||||||||||||||||||||||||||||||||||||||
Rödinghausen
Rödinghausen is located in the Ravensberger hill country on the southern slope of the Wiehengebirge at an altitude of around 135 m above sea level. NN . Long-term average climate data:
|
Monthly average temperatures and rainfall for Rödinghausen
Source: Shaker
|
||||||||||||||||||||||||||||||||||||||||||||||||||||||||||||||||||||||||||||||||||||||||||
On a long-term average (1961–1990) the region had an average of 1473 hours of sunshine per year (observation station: Herford). The overall climate of Rödinghausen can be described as a mild, low mountain range climate.
Selected precipitation charts
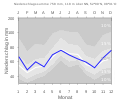
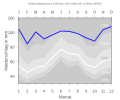
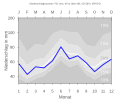
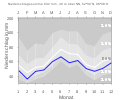
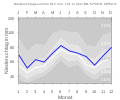
Average precipitation values for North Rhine-Westphalia (gray-white background) and one measuring station in each case in OWL (blue line) for the period from 1961 to 1990. Source: DWD
Bad Lippspringe -Wewa
Bielefeld- Brackwede
Bielefeld- Senne
Bielefeld- Sennestadt
Höxter steels
Petershagen (waterway)
Rahden- Varl
Warburg- Hohenwepel
swell
- ^ City of Detmold climate diagrams. (No longer available online.) Archived from the original on May 25, 2014 ; accessed on May 22, 2014 . Info: The archive link was inserted automatically and has not yet been checked. Please check the original and archive link according to the instructions and then remove this notice.
- ↑ DWD: mean values for the period 1961 to 1990
- ^ Adolf Schüttler: Rödinghausen in the Ravensberger Land. Ecological - economic structures and changes. Self-published by the municipality of Rödinghausen, Rödinghausen undated pages 25–28.
- ^ Adolf Schüttler: Rödinghausen in the Ravensberger Land. Ecological - economic structures and changes. Self-published by the municipality of Rödinghausen, Rödinghausen undated pages 25–28.
- ^ Meteorological information from the State Office for Data Processing and Statistics. Archived from the original on June 19, 2007 ; accessed on May 22, 2014 .
Web links
Coordinates: 51 ° 56 '30.2 " N , 8 ° 31' 53.7" E


