
Consequences of global warming in the Arctic


BE.jpg)
BE.jpg)
The consequences of global warming in the Arctic , the polar ice cap of the North Pole , are among the regional effects of global warming . These include rising air temperatures, receding glaciers, thawing permafrost and melting sea ice: they are hallmarks of the “ Anthropocene ”.
A warmer Arctic is accompanied by numerous feedbacks , i.e. changes triggered by warming , which in turn affect the amount of warming, including ice-albedo feedback , which leads to the melting of Arctic ice at an ever faster rate. In addition to ecological consequences, serious consequences for the people living in the Arctic are to be expected.
In addition, due to the decline in summer sea ice , a race has developed among neighboring countries for the valuable resources that are suspected to be under the seabed of the Arctic Ocean . The environmental changes therefore lead indirectly to political conflicts .
Temperature increase
The period 1995–2005 was the warmest since the 17th century at the latest, and 2005 was exceptionally warm at 2 ° C above the long-term mean from 1951 to 1990. In addition to the greenhouse gases that cause global warming , other components of the air, such as soot particles, have probably also contributed significantly to this local warming. Most of the soot probably comes from forest fires in boreal areas and to a lesser extent from burned fossil fuels .
Over the past few decades, the average air temperature in the Arctic has increased about twice as fast as the global average temperature (which increased by 0.74 ° C ± 0.18 ° C between 1906 and 2005). The area north of 60 ° N (about the height of Stockholm or Anchorage ) warmed by an average of 1 to 2 ° C by the end of the 20th century after a slight cooling in the 1960s and 1970s. Some regions, including Alaska and Western Canada, have warmed 3 to 4 ° C since 1950. Since 1980, the Arctic has warmed the most in winter and spring , around 1 ° C per decade. The warming is lowest in autumn . In addition, the inner regions of North Asia , which are part of the Arctic, and the northwest of North America are warming the most.

In the Arctic, air and water temperatures rise significantly faster than the global average. The water temperatures of the Arctic North Atlantic are higher today than they have been in at least 2000 years.
Higher temperatures due to polar amplification

An increase in global greenhouse gas concentrations warms the poles far more than other parts of the earth's surface. The main cause of this is the ice-albedo feedback : Snow and ice surfaces reflect most of the sun's energy radiated into space. The melting of the snow and ice surfaces reveals the land and water surfaces underneath, which, with their darker color, absorb a large part of the solar energy . This further heats the surface.
In the Arctic, the effect of polar amplification can be observed in climate simulations after just a few decades, and the reason for the strong warming that can already be measured there today. It is clearly recognizable in the form of receding glaciers, decreasing arctic snow cover and sea ice cover. The effect is not limited to the direct environment of the reduced albedo. A simulation showed a three and a half times increased warming of the western Arctic land areas in years with rapidly declining sea ice. The higher temperatures pull up to 1500 km into the interior.
The fact that, in contrast to the Antarctic, the Arctic ice masses are at sea level and even largely in the sea has a reinforcing effect. Due to the low altitude, the temperatures in large areas of the Arctic are therefore much closer to freezing point, which is why even small increases in temperature can initiate a melt. In addition, sea ice is melted not only from above (sun, air), but also from below, i.e. by warmed ocean currents. If the tundra warms up , this leads to a change in the vegetation. Dark forests absorb much more solar energy than moss and lichen vegetation, which can be completely covered by snow even when there is little rainfall. This also supports a warming trend. In addition to the greenhouse gases , which are responsible for global warming, soot is another problem locally . It is carried by the winds, precipitates in the Arctic and darkens the surface of the brilliant white snow and ice.
Future warming
The average air temperature in the Arctic is expected to rise further by 2 to 9 ° C by the year 2100. For the entire earth, the Intergovernmental Panel on Climate Change (IPCC, Intergovernmental Panel on Climate Change ) , which is decisive for questions of climate research, assumes a significantly lower warming of 1.1 to 6.4 ° C. In the (examined western) Arctic, comparable temperatures were last reached with the lower end of these estimates during the so-called Holocene temperature maximum 10,000 to 12,000 years ago. At that time the temperatures there were 1.6 ± 0.8 ° C higher than the average of the 20th century. At that time, however, the warming took place over the course of at least two millennia, occurred regionally at different times and was presumably “balanced” by the Laurentid Ice Sheet that was still in existence at that time over what is now Canada.
Increasing precipitation and "rain-on-snow" events
In the last century, there has been an approximately 8% increase in rainfall in the Arctic , mostly as rain . The increase was most pronounced in autumn and winter. However, the precipitation trends are very different locally and the measurements are still quite imprecise.
Precipitation in the Arctic is expected to continue to rise in the 21st century. The Arctic Climate Impact Assessment (ACIA) commissioned by the Arctic Council forecasts an increase in total precipitation of 20%. Precipitation will increase particularly strongly in the coastal regions in autumn and winter.
According to the Arctic Climate Impact Assessment , so-called "rain-on-snow events" are already occurring more and more frequently. The winter precipitation falls on the snow cover lying on the ground. This causes snowmelt more quickly and can lead to acute flooding in some regions . In western Russia, for example, such “rain-on-snow events” have occurred 50% more frequently over the past 50 years.
The melting Greenland ice sheet
The second largest ice sheet in the world (after Antarctica ) and the largest glaciers in the Arctic region are located on Greenland . The Greenland Ice Sheet is one of the last remnants of the Pleistocene inland glaciation. It has been preserved because the ice cools itself through two types of feedback: firstly, it reflects a large part of the solar energy without warming up (the so-called ice-albedo feedback ), and secondly, the surface of the kilometer-thick ice sheet is at high mountain level in colder air layers.
Mass loss in Greenland

Temperatures in the south of the island have risen by 2 ° C since the middle of the 20th century. As a result, there were significantly receding glaciers , larger inland melting areas and increasing mass loss.
In the higher central areas, the mass increased due to increasing snowfall in the mid-2000s.
A new island named Uunartoq Qeqertoq (in English Warming Island ), which was discovered on the east coast in 2005 , became a symbol for the loss of ice . After a large amount of mainland ice melted, it was found that Uunartoq Qeqertoq was not a peninsula connected to the mainland, as previously believed.
| Mass change in Greenland according to various studies | |||
|---|---|---|---|
| study | Mass change in Gt / a (= billion t / a) |
method | Period |
| Krabill et al. 2000 | −47 | Observation flights | 1994-1999 |
| Chen et al. 2006 | −239 ± 23 | GRACE | 2002-2005 |
| Velicogna et al. 2006 | −230 ± 30 | GRACE | 2002-2006 |
| Luthcke et al. 2007 * | −160 ± 15 | GRACE | 2003-2006 |
| Zwally et al. 2007 * | −90 ± 10 | ICESat | 2003-2005 |
| Wouters et al. 2008 | −179 ± 25 | GRACE | 2003-2008 |
| van den Broeke et al. 2009 | −237 ± 20 | GRACE | 2003-2008 |
| Helm et al. 2014 | −375 ± 24 | CryoSat | 2011-2014 |
| * Preliminary information. Source: NASA Earth Observatory , own additions | |||
The amount of melting ice is given in different units; one km³ (one billion m³) corresponds to one gigatonne (Gt) of ice.
The mass changes in Greenland are recorded with satellites (e.g. with GRACE , Cryosat and ICESat ). In the last 20 years, the melt in the frost-free months (May – September) has increased significantly. Overall, Greenland lost almost 100 billion tons of mass in 1996, a value comparable to the 1960s, while in 2007 almost 270 billion tons were lost. In 2007, a negative mass balance was determined for the first time for altitudes above 2000 m.
From 2000 to 2008 inclusive, the total mass loss was around 1500 billion tons.
Different research teams come to different results when evaluating the satellite data (see table), but they all come to the conclusion that Greenland's mass is decreasing sharply. The Danmarks Meteorologiske Institute (DMI in Narsarsuaq , South Greenland) now carries out its own daily balances. With the exception of 2011/2012, the average annual ice shrinkage since 1990 has been around 200 Gt.
The edges of Greenland in particular are affected by accelerated ice loss. The ice melt is also detectable inland. Between 1992 and 2005, the proportion of the Greenlandic area with detectable ice melt increased by around 40,000 km² per year, which means that over a quarter of the island now has melting ice. A 2011 study examined the mass loss of the Arctic and Antarctic and found that between 1992 and 2009, Greenland melted 21.9 billion tons more ice each year than the year before. In comparison: There are 48 billion tons of water in Lake Constance .
According to a study published in 2012, the limit for the melting of the Greenland ice masses is between 0.8 and 3.2 degrees. The most likely value is 1.6 degrees. If global warming could be limited to 2 degrees, the melting would take about 50,000 years, with a possible but unlikely warming of 8 degrees, however, only 2000 years.
From July 8-12, 2012, satellite data showed that 97% of Greenland's ice surface melted, even at 3000 meters above sea level. This had never been seen since the satellite observation began; normally about half of the ice melts at this time of year. Ice core analyzes show that the high altitudes of Greenland were last affected by the thaw in 1889. Such an event occurs on average every 150 years. If the melting observed remains an isolated case, it would not be unusual in terms of statistics. However, if this is observed again in the coming years, it means a previously unexpected effect of increased melting in this region.
According to a study published in 2016, the postglacial land uplift in studies based on GRACE satellite data has so far been incorrectly taken into account, so that the annual ice melt is around 20 gigatons higher than was stated in previous studies.
Data from an expedition by the Alfred Wegener Institute for Polar and Marine Research on board the German research icebreaker Polarstern showed, based on the " 79-degree north glacier " on the Fram Strait , that the ice in the northeast corner of Greenland is also melting.
Isostatic dynamics
As a result of the melting of the glaciers, Greenland is slowly rising. Because the island's ice mass is decreasing significantly, the weight on Greenland is reduced. In recent years the mainland has risen by up to 4 cm per year in places, especially in the coastal regions. Before 2004 this value was 0.5 to 1 cm. From this it can be concluded that the Greenland ice is currently melting four times faster than it was a few years ago, according to scientist Shfaqat Khan from the Danish National Space Center (DTU Space).
Glacier dynamics

A surprising dynamic is evident in individual glaciers in Greenland, which was previously generally unknown in glaciers (probably also due to less research). Within days or weeks, the flow speed of a glacier can quadruple, only to return to its original level. On average over many years, some west Greenland glaciers did not show any general acceleration of the flow velocity. Two of the largest glaciers on the island, the Kangerdlugssuaq glacier and the Helheim , which together contributed 35% to the mass loss of East Greenland in recent years, were examined in more detail by a team led by glaciologist Ian Howat . It turned out that the melting rate of the two glaciers had doubled between 2004 and 2005. By 2006, the mass loss had dropped back to its 2004 value. A similar dynamic can also be observed at Jakobshavn Isbræ on the west coast of Greenland, shown on the right . Its melting rate accelerated dramatically between 2001 and 2003 and fell significantly again in 2004. While the glacier retreated an average of 15 m per year between 1991 and 1997, this value had almost doubled by 2003. At the same time, the movement of its ice masses accelerated. While their speed was 6.7 km per year in 1985 and only 5.7 km from 1992 to 1997, this value increased significantly to 9.4 km per year for 2000 and further to 12.6 km in 2003. In 2004, the retreat had decreased significantly again, which illustrates the dynamic of Jakobshavn Isbræ, which is still hardly predictable today.
Sea level rise due to meltwater
Between 1993 and 2003 the global sea level rise according to satellite measurements averaged 3.1 ± 0.7 mm per year. The Greenland ice sheet contributed 0.21 ± 0.07 mm. By 2007 the global increase increased further to 3.3 ± 0.4 mm. The IPCC estimates that by 2100 sea level elevations between 0.19 m and 0.58 m are possible. The contribution of the ice sheets of Greenland and the Antarctic, which are difficult to model, is expressly excluded from this, however, because the scientific understanding of their dynamics does not allow a reliable estimate.
Greenland's ice mass is large enough to cause sea levels to rise above 7 meters worldwide. One of the greatest catastrophic consequences of global warming foreseeable today would therefore be a collapsing ice sheet. Over the past few years, estimates have been continuously revised downwards as to when an irreversible dissolution process would start and how long it would last until all of the Greenland ice had melted. At the beginning of the 2000s, such a scenario was considered possible over the course of thousands of years. Today there is more of a consensus that this should be calculated in centuries at most. The data on rapid changes in ice sheets that have become known in recent years indicate a dynamic that increasingly calls into question the image of sluggish, huge ice masses.
In addition, studies were published in 2006 and 2007 that consider the loss of considerable parts of the ice sheet within a few decades to be possible. This is the conclusion reached in an article by Jonathan Overpeck et al. in the journal Science . This searches for climatic conditions in the climatic history that are similar to those expected in this century. He found what he was looking for in the Eem warm period about 129,000 to 118,000 years ago. Back then, sea levels were at least 4 and possibly over 6 m higher than they are today. According to the authors, conditions in the Arctic could be similar to those during the Eem warm period towards the end of the 21st century. If large parts of the Greenland ice sheet had melted at that time, it could hardly be assumed that it would now withstand comparably high temperatures unscathed. NASA climatologist James E. Hansen warned in 2005 of a rapid rise in sea level as a result of ice sheets melting surprisingly quickly. Hansen refers to the meltwater pulse 1A that occurred at the transition to the current warm period more than 14,200 to 14,700 years ago. During the pulse, the sea level rose by 20 meters within 400 to 500 years, or by an average of one meter every 20 years. Hansen does not assume that a comparably rapid rise in the oceans is very likely, but he does assume an increase (in the plural) "in meters" to be measured by the end of the 21st century.
Possible changed ocean circulation
There are various mechanisms that transport the heat and flow energy generated by the sun from the equator to the poles. These include the globally interconnected movements of the water masses of the ocean: The thermohaline circulation arises due to differences in the temperature and salinity of the seawater .
In the past 120,000 years the North Atlantic Current has been interrupted several times. The reason for this was presumably the inflow of large amounts of fresh water , which weakened the compression process of the sea water and prevented the surface water from sinking. Theoretically, it is conceivable that the North Atlantic Current will be interrupted again by the increased influx of fresh water from the Greenland glaciers. Drying up of the Gulf Stream would, if not an ice age, result in a severe cold snap in all of Western and Northern Europe .
An interruption of the North Atlantic Current has so far been considered very unlikely by the participating scientists, at least in the medium term. According to simulations with climate models, a slight weakening of the North Atlantic Current is expected by the end of the 21st century. In the course of studies of the North Atlantic Current in the 2000s, it became clear that it is subject to strong natural fluctuations, but has so far not shown any weakening tendencies.
The heating power transported into the Arctic in the winter of 2005/2006 due to changed atmospheric flow patterns was 90 terawatts, which corresponds to the output of 90,000 conventional nuclear power plants.
Retreating glaciers outside Greenland
The glaciers are also beginning to melt in other places in the Arctic. Since 2000, all but one of the 40 glaciers of the 8100 km² Vatnajökull Ice Cap on Iceland have receded. In Iceland, between 1995 and 2000, of the 34 glaciers studied, 28 receded, four were stable and two were growing.

In the Canadian Arctic Archipelago- there are numerous large ice caps. These include the Penny and Barneseis caps on Baffin Island ( the fifth largest island in the world with 507,451 km² ), the Bylotei Cap on Bylot Island (11,067 km²) and the Devonian Cap on Devon Island (55,247 km²). These ice caps are losing thickness and slowly retreating. Since the 1950s, over 20 ice sheets on Baffin Island have shrunk by more than half as a direct result of global warming, according to a study by the University of Colorado at Boulder . According to the authors, this is the smallest expansion in at least 1,600 years. The decline is all the more remarkable, since natural factors such as the long-term inclination of the earth's axis have led to falling solar radiation in the Arctic and an increase in the ice mass was to be expected as a result. If the trend continues uniformly in the future, as in the past 50 years, the complete disappearance of the ice sheets is to be expected by 2070 at the latest - a state that was most likely in the middle Holocene 5000 to 8000 years ago. Between 1995 and 2000 alone, the Penny and Barneseis caps in lower altitudes (below 1600 m) have become over 1 m thinner annually. Overall, the ice caps of the Canadian Arctic lost 25 km³ of ice annually between 1995 and 2000. Between 1960 and 1999 the Devonian Ice Cap lost 67 ± 12 km³ of ice. The main glaciers that extend from the edge of the eastern Devonian Cap have retreated 1–3 km since 1960. The Simmon Ice Cap on the Hazen Highlands of Ellesmere Island has lost 47% of its area since 1959. If current conditions continue, the remaining glacial ice on the Hazen Highlands will have disappeared by 2050.
To the north of Norway lies the island of Svalbard , which is covered by many glaciers. The Hansbreen Glacier on Spitzbergen z. B. withdrew 1.4 km between 1936 and 1982. It lost another 400 m in length between 1982 and 1998. The Blomstrandbreen has also been shortened: in the past 80 years, the length of the glacier has decreased by around 2 km. Since 1960 it has retreated an average of 35 m per year, with the speed increasing since 1995. The Midre Lovenbreen Glacier lost 200 m in length between 1997 and 1995.
Shrinking arctic sea ice


Observing the development of the sea ice is not an easy task, as it fluctuates greatly in its thickness and density. Its area can be measured comparatively easily from satellites. Since the beginning of the satellite measurements, the extent of sea ice in the Arctic has declined sharply. Declining trends are observed in all regions and all months, with the months with the greatest decline being September, July and August, the regions with the greatest annual mean decline being the Barents Sea and Kara Sea . Reconstructions of the Arctic sea ice extent show that the current decline in ice extent, at least in comparison to the last several thousand years, seems extraordinary and cannot be explained by the natural causes of past changes.
At the beginning of the satellite observation in 1979 and in the following years the average extent of the ice surface was about 7.5 million km². Between 1979, the beginning of modern satellite observation, and 2005, the observed ice surface decreased by 1.5 to 2.0% per decade. The decline in ice surface is generally most pronounced in September, traditionally the month with the smallest extent; the ice rate in this month is 8.6 ± 2.9% per decade. If the examined period is extended backwards by years not observed with satellites up to 1953, the decrease is still 7.7 ± 0.6% per decade.
The loss of land accelerated considerably in the winters of 2005 and 2006. In these two years, the maximum extent of the sea ice fell by 6% each - an increase by a factor of 30 to 40 compared to the melt rate determined in the previous decades.
On September 16, 2007, at 4.13 million km², the low of the record year 2005 of 5.32 million km² was clearly undercut. The value for September 2007 was 4.28 million km², about 23% less than in 2005 and 39% less than the average value for the years 1979–2000.
There are greater uncertainties in determining the thickness of the ice sheet, which, however, is essential for assessing the situation. Here the figures vary between 40% and 8 to 15% decrease. In a press release from September 2007 on the occasion of the first results of an Arctic expedition with the research ship Polarstern , the Alfred Wegener Institute for Polar and Marine Research (AWI) writes : “Large areas of the Arctic sea ice are only one meter thick this year and therefore around 50 Percent thinner than in 2001. "
Zhang and Rothrock from the University of Washington use a complex numerical model (PIOMAS) fed with real data for currents, temperatures, cloud cover and tested with measurements of ice thickness from submarines and the ICESat satellite to determine the “white spots on the map ”. Their result shows that when looking at the ice volume, the situation is much more alarming than when looking at the ice surface alone. The graphic on the right speaks for itself.
Since March 2013, large-scale measurement data for the ice thickness and thus the volume have been available for the first time. The European satellite CryoSat 2 uses radar pulses to measure the height difference between the ice surface and the sea surface in open spaces between the ice floes. From this, taking into account the snow cover and the density of the ice, its thickness can be obtained. It is slightly larger than that calculated by PIOMAS, but decreases just as quickly.
As a result of the melting of the ice, the European Space Agency ( ESA ) reported on September 14, 2007 that the Northwest Passage was free of ice for the first time since satellite observations began . In 2008, both the Northwest and Northeast Passages were in principle navigable for the first time . The ice surface measured in summer 2008 was slightly larger than in 2007, but the ice thickness continued to decrease. While there is much speculation in the media about the possible future shortening of the sea route between Europe and Asia, the impassability of the passages in winter and the real risk of ramming an iceberg in the summer , the economic use of which will remain marginal in the near future.
In its fourth assessment report AR4 from 2007 (currently: AR5 from 2014), the IPCC assumed that the North Pole could be ice-free in summer by 2100. However, none of the climate models shown there showed a loss of sea ice for the next few years, as was already observed in the year the climate report was published. In a 2006 model study, a team led by researcher Marika Holland determined that the Arctic could be completely free of sea ice for the first time in the summer of 2040. Fears of an even more drastic decline, such as that the summer Arctic sea ice could melt completely as early as 2020, will, however, very probably not materialize. According to an estimate published in 2016, the emission of every additional ton of CO 2 corresponds to a loss of around three square meters of Arctic summer sea ice.
In 2008, an international team of researchers examined the circulation patterns of the atmosphere in the far north; these have changed drastically at the beginning of this decade - with a systematic relocation of air pressure centers to the northeast in the winter half-year. This results in a pronounced atmospheric and oceanic heat transport towards the poles. This is the driving force behind the current climate changes in the Arctic.
In September 2012 the area of the sea ice reached a new low, which fell below the previous minimum of 2007 by 18 percent. At 3.41 million square kilometers, the 2012 value was only half (51 percent) of the mean area of the years 1979-2000 at the time of the annual minimum. The six lowest values observed by satellites for the extent of the Arctic sea ice were measured between 2007 and 2012. Contrary to the multi-year trend, there were in some cases considerable sea ice gains in 2013 and 2014 (33% and 25% respectively compared to the average from 2010 to 2012). Thick sea ice in northwest Greenland resulted in a 5% decrease on days when ice melted. The massive increase in sea ice after just one cool summer suggests that sea ice is more resilient than previously assumed. In 2015 the minimum extent was 4.26 million square kilometers, so the ice cover decreased again. In 2016, on 8.9. with 4.02 million square kilometers, the second smallest area observed after 2012.

Another negative record was measured in February 2018: again, the ice cover in the Arctic was lower than ever before in February (since satellite measurements began in 1978). In addition, the trend of Arctic ice melt can now be put into figures: The decrease in the ice surface is around 2.8% per decade (for the month of February). A trend towards thinning can now also be determined for the ice thickness.
In spring 2020, the Arctic sea ice cover was 13.26 million square kilometers on April 19, the second lowest value since satellite records began. - The five first places in the negative statistics now occupy the current (2nd place) and the four previous years.
An overview study (" meta-analysis ") of 40 current climate models of the type CMIP6 published in mid-April 2020 comes to the conclusion that the Arctic Ocean will most likely be free of ice during many Arctic summers before 2050, even if climate protection measures intensify : "In An ice-free Arctic in summer would be the norm for 25 years ".
Tipping point
Systems with positive feedback can become unstable and sometimes behave non-linearly . It is assumed that the Arctic represents a so-called tipping element in the global climate system due to the ice-albedo feedback . If the tipping point is exceeded , the warming there accelerates in a strongly non-linear manner and the high temperatures are retained even after a high greenhouse gas concentration has been reduced ( hysteresis ). Current research contradicts this assumption, at least on short time scales: It has been shown that the radiation in the winter months is in the order of magnitude of the energy influx in summer and a recovery of the ice surfaces is possible with only a few years of low ice cover.
However, there are differences of opinion as to how an Arctic tipping point is defined: If this is viewed as a point at which a small change in the input parameters has a major effect, then the Arctic sea ice cover can definitely be viewed as a tipping point.
Political Conflict
The political status of the Arctic has not yet been conclusively clarified. As a result of the decline in Arctic sea ice and the resulting access to raw materials below the sea floor, the associated conflicts between the neighboring countries have become more topical. The Arctic Council was founded in 1996 to deal with political issues relating to the Arctic , but no agreement has yet been reached either in it or in the relevant UN bodies.

The (geographic) North Pole and the area surrounding it up to a distance of at least 300 km are so far removed from the mainland of the neighboring states that they are not owned by a state under current law. However, within ten years of ratification of the Convention on the Law of the Sea , every state has the option, under certain conditions, to apply for its control to be extended to the continental shelf and thus to more than 200 nautical miles from the mainland. Due to this regulation, Norway (UNCLOS ratified 1996), Russia (1997), Canada (2003) and Denmark (2004) have applied for such an extension of their area.
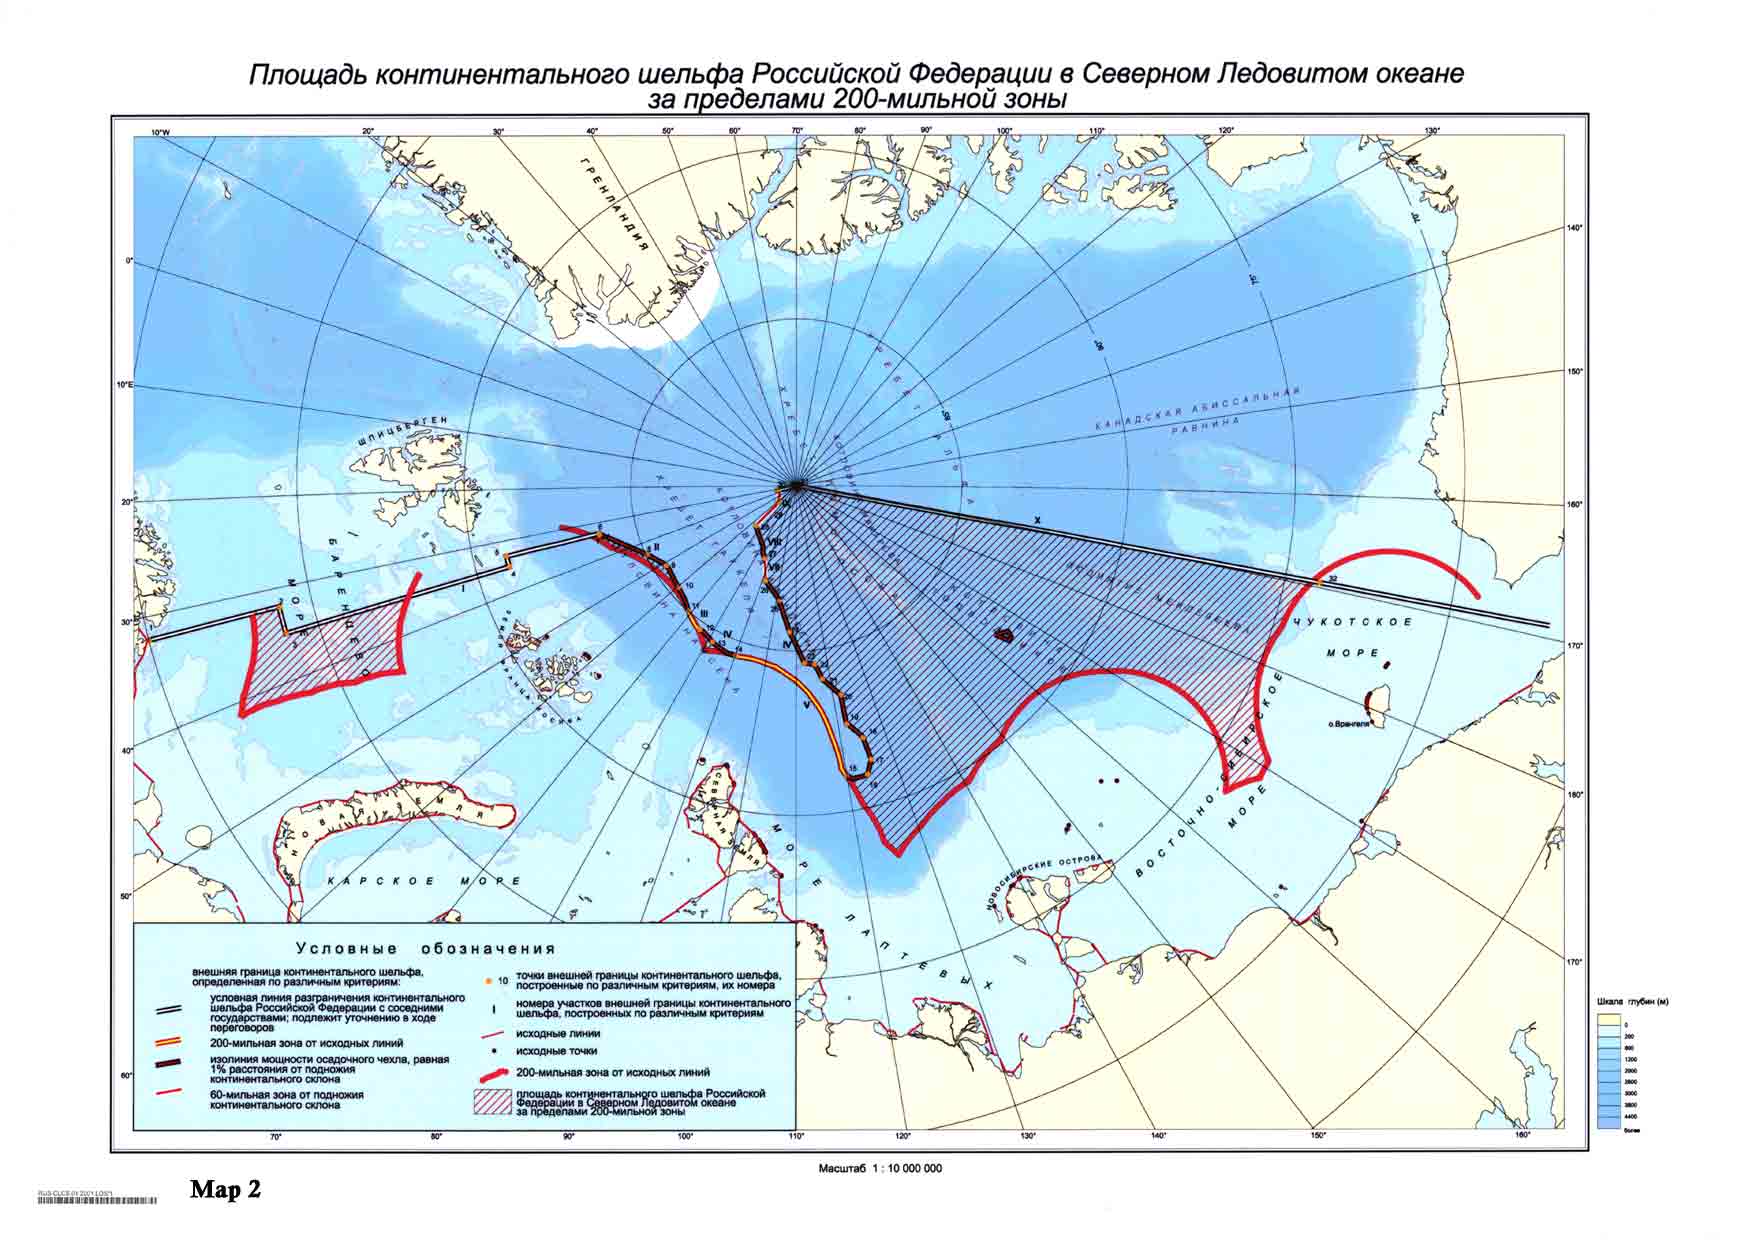
On December 20, 2001, Russia officially applied to the UN Commission for the Limitation of the Continental Shelf (CLCS) in accordance with the Convention on the Law of the Sea (Art. 76 Clause 8) to define new external borders for the Russian continental shelf beyond the 200 nautical miles of the exclusive economic zone, albeit within of the Russian Arctic Sector. The area claimed by Russia with an area of about 1.2 million square kilometers represents a large part of the Arctic including the North Pole. The application was justified, among other things, with the fact that both the Lomonosov and Mendeleev ridges were submarine continuations of the Eurasian Landmass . The United Nations has neither accepted nor rejected the application. To reinforce the Russian claim, two Russian Mir submarines dived to a depth of 4,261 meters below sea level at the beginning of August 2007 and planted a Russian flag on the seabed at the geographic North Pole . While the diplomatic impact of this action was minor, it generated considerable media coverage on who actually owns the Arctic.
The part of the Arctic Ocean around the Canadian coast and the Canadian-Arctic archipelago represents a special situation. Although some of these waters are actually Canadian according to international maritime law, the USA, the European Union and some other states do not recognize Canadian sovereignty, but use it they like international waters . For example, US submarines have already passed close to the Canadian islands several times through Canadian territory without prior request for permission from the government . The affected waters, including the Northwest Passage , are not yet very attractive for shipping due to the extensive glaciation over nine months of the year, but if the ice continues to melt, the Northwest Passage becomes a clear shortcut - up to 7,000 nautical miles - for many ships represent the toll-based Central American Panama Canal .
The autonomous region of Greenland, which belongs to Denmark, is geographically closest to the North Pole with its coastline. Denmark claims that the Lomonosov Ridge claimed by Russia is in fact a continuation of the island of Greenland. The Danish research on this began with the LORITA-1 expedition in spring 2006. It will be continued as part of the International Polar Year from August 2007 with the LOMROG company . On August 12, 2007, 40 scientists, including ten from Denmark, boarded the Swedish icebreaker Oden , which sailed from Tromsø towards the North Pole. While the Danish measurements are supposed to prove the Copenhagen view that the continental shelf is connected to the island of Greenland at the pole, the Swedish participants in the expedition are investigating the climatic history of the Arctic.
Norway initially stayed largely out of discussions about the status of the area around the North Pole. Rather, it focused on its dispute with Russia over part of the Barents Sea and the status of Svalbard . However, on November 27, 2006, Norway also submitted an application to the CLCS proposing to expand the Norwegian 200-mile zone into three areas of the Northeast Atlantic and the Arctic Ocean: the Loophole in the Barents Sea and western Nansen Basin and the Bananahole in the European Arctic Ocean . It is noted that a further application regarding the expansion of the continental shelf in other areas could be submitted later.
For the US government, possible territorial gains through the neighboring status of the northernmost state of Alaska play a subordinate role, because the comparatively short coastline would give it only a small area in all proceedings. Rather, US Arctic policy focuses on the Northeast and Northwest Passages. In the opinion of the governments under Bill Clinton and George W. Bush, these waters should be internationalized as far as possible in order to open up the most unhindered navigation and further economic use of them. This met resistance from Canada, Russia and the American Senate, which refused to ratify UNCLOS.
consequences
People
_edit_(15653586503).jpg)
The island of Sarichef Island off the Seward Peninsula on the Chukchi Sea in the north of the US state of Alaska is losing more and more space due to the ever-longer summer ice-free Bering Strait and the arctic autumn and winter storms that can strike unhindered . The village of Shishmaref on top of it, with almost 600 residents of predominantly indigenous Alaskan descent ( Inupiat - Eskimos ), has already lost individual houses. Since 2002 the residents have decided to resettle several times, most recently in 2016; they are considered the first environmental refugees in North America . The cost is estimated at around $ 300 million, but no concrete plans have yet been developed. The necessary resettlement is also associated with fears of the loss of their own indigenous language ( Inupiaq ) and culture.
Ecosystems
The primary production of biomass in the Arctic increased by 20% between 1998 and 2009. The cause is more ice-free water surfaces that have existed for a longer period of time. Phytoplankton flowering begins up to 50 days earlier in parts of the Arctic. Changes in physical parameters can cause cascading changes in biological systems. There is a trend towards smaller phytoplankton cells in the Canadian basin because the inflow of nutrients from deeper water layers is limited by the decreasing salinity of the uppermost water layer. In the future, this could favor the spread of communities with low demands on the energy density of their food, as characterized by the mass reproduction of jellyfish. In contrast, communities characterized by fish and marine mammals could be disadvantaged.
Should the Arctic sea ice actually disappear over the long term and completely seasonally, the disappearance of the polar bears is possible at least in some regions according to the Arctic Climate Impact Assessment. Arrive at a similar conclusion and Ian Stirling of the Canadian Wildlife Service and Claire L. Parkinson from the Goddard Space Flight Center of NASA in a 2006 published study conducted by increasing problematic confrontations between bears and humans as a result of diminishing habitat and verknappten food supply of polar bears goes out. The US Geological Survey expects the polar bear population to decline by two thirds by 2050, despite the still uncertain relationship between the ice surface and population size, should the sea ice decline as assumed in the models. Because the observed ice loss has so far been faster than the models suggested, this could still represent an underestimation. Polar bears would be the only way to mimic the way of life of the brown bears living on the mainland during the summer months .
Such a serious incision in the Arctic ecosystem would also have serious consequences for other mammals. These include, above all, marine mammals, which are very important for the surrounding human communities. In a survey of seven arctic and four sub-arctic mammals, hooded seals , polar bears and narwhals were identified as the animals most affected by climate change. Ringed seals and bearded seals are probably the least affected, primarily due to their large habitat . Such a change could potentially benefit some whale species that benefit from increasing open water areas.
Decreasing snow cover
Over the past 30 years, the snow-covered area of the Arctic land areas has decreased by about 10%. According to model calculations, snow cover will decrease by an additional 10–20% by the 2070s. The greatest decline is expected in April and May, which will shorten the snow season. The water discharges from rivers into the Arctic Ocean and the coastal seas are likely to start earlier than today. It is also assumed that the freezing and melting cycles increase in winter and lead to the increased formation of layers of ice instead of snow. This makes it difficult for land animals to reach feeding and rearing places.
Dwindling permafrost
The permafrost soil has become significantly warmer in the past few decades. In Alaska , surface temperature rises of 5 to 7 ° C have been recorded since the beginning of the 20th century, with warming of 2 to 4 ° C until the mid-1980s and a further 3 ° C since then. The upper soil layer heats up with the surface. In northwestern Canada, an average warming of the top 20 m of the permanently frozen ground there by 2 ° C has been determined over the past 20 years. Lower warming was also found in Siberia and Norway. Of twelve regions examined in the Arctic Climate Impact Assessment , only one showed a slight cooling between the late 1980s and the mid-1990s, while the other eleven warmed up in some cases significantly. In the course of the 21st century, the southern edge of the constantly frozen area is expected to shift several hundred kilometers north. According to calculations with various climate models, the constantly frozen ground area could have shrunk to 47 to 74% of today's area by 2080 .
Some of the consequences of thawing permafrost are coastal erosion, leaking or seeping ponds and lakes, newly developing wetlands and large-scale formation of thermokarst . In addition, forests are to be expected to be damaged by so-called "drunk trees", if trees that were previously firmly anchored in the frozen ground lose their grip in the thawing mud and become tilted. Considerable damage must be expected for infrastructure such as roads or pipelines built on permafrost, especially if continuous improvement measures are not carried out. In some cases, this damage is already occurring today, and it forces high expenditure in the regions affected.
It is estimated that Arctic permafrost soil contains approximately 30% of all carbon stored in soils worldwide. In connection with the dramatic sea ice melt that occurred in 2007, the resulting warming of arctic land areas during times of strong sea ice loss was investigated. During this time, climate models showed a warming of land areas that was 3.5 times faster than the average warming modeled for the 21st century. The affected area extended 1500 km inland.
Increasing methane emissions due to thawing permafrost
In the permafrost, large amounts of carbon are bound in the huge peat bogs of Siberia and parts of North America. The boreal forests and arctic tundra hold some of the largest land reserves of carbon in the world. These occur in the form of plant material in the forests and as soil carbon in the tundra. The decline in Arctic permafrost described above leads to the release of large quantities of the greenhouse gas methane, which in turn increases global warming.
Arctic ponds drying up

Presumably as a result of global warming, some so-called arctic ponds in Cape Herschel, Canada (located on Ellesmere Island ) dried up completely for the first time in the summer of 2006. The ponds observed by the scientists John P. Smol and Marianne SV Douglas since 1983 had, according to paleolimnological analyzes, held water continuously for at least several millennia. Arctic ponds are small and relatively shallow, particularly species-rich biotopes. They are also one of the most important sources of surface water and the habitat of numerous birds and insects. Their disappearance is attributed to the increased ratio of evaporation to precipitation, a phenomenon which, according to the authors, “may be related to global warming”. In the past, subarctic ponds have often disappeared, which could be explained by the decreasing permafrost . However, the arctic ponds have clearly evaporated, as the increased salt concentration in ponds that have not yet completely disappeared shows with greatly reduced water volumes.
Social consequences
About 3.8 million people live in the Arctic, of which about 10% are indigenous people. In the words of the Arctic Climate Impact Assessment , they are “confronted with major economic and cultural consequences” as a result of climate change and must reckon with dangers or restrictions on their food security , their health and their previous way of life. Due to the receding sea ice, Eskimo hunters , for example, can no longer rely on traditional knowledge and hunting routes. Allegedly, there is an increasing number of incidents in which people break and drown due to sea ice that has become too thin.
Since access to food always depends on safe travel routes, dwindling sea ice or thawing permafrost threaten the existence of some human settlements in the Arctic. Both influence the migration routes of reindeer and thus the way of life of the people who depend on them. The animals traditionally hunted by the Eskimos are also dependent on the prevailing conditions in the Arctic so far. These include seals and walruses in particular .
The first villages in the Arctic had to be abandoned due to coastal erosion caused by thawing permafrost and rebuilt several kilometers away inland (see also the section “People” ). In the future, increased coastal erosion is expected due to receding sea ice, rising sea levels and continued thawing soil. While the relocation of entire villages was previously limited to individual cases, the Arctic Climate Impact Assessment expects an increasing number of them in the future.
The Canadian Association of Physicians for the Environment's chairman, Courtney Howard, has noted symptoms of fear and sadness to post-traumatic stress related to climate change among Arctic residents. Such phenomena have recently been referred to as solastalgia .
literature
- Snow, Water, Ice and Permafrost in the Arctic (SWIPA) 2017 - Report of the Arctic Monitoring and Assessment Program (AMAP)
- Arctic Climate Impact Assessment - Report of the Arctic Council on the effects of climate change from 2004 ( summary at RealClimate.org )
- Arctic Human Development Report from 2004 (English)
- Roger G. Barry; Eileen A. Hall-McKim: Polar environments and global change. Cambridge, Cambridge University Press 2018, ISBN 978-1-108-39970-8
- John Turner; Gareth J. Marshall: Climate change in the polar regions. Cambridge, Cambridge University Press 2011, ISBN 978-0-521-85010-0
- Matthias Hannemann: The new north. The Arctic and the dream of departure. Scoventa, Bad Vilbel 2010, ISBN 3-942073-02-1
- Susan Joy Hassol: The Arctic Climate Report The Effects of Warming. Convent-Verlag GmbH & Alfred Wegener Institute, Hamburg / Bremerhaven, 139 pp. (Pdf 135 MB) , 2005
Web links
- Sea ice portal updated daily sea ice development
- AWI : Warmer Arctic Infographic February 12, 2018
- Website of the International Polar Year 2007/08 with a lot of background information about the current scientific research of the Arctic
- NOAA Arctic Theme Pages , especially: NOAA Arctic Report Card 2008 , overview of recent environmental changes in the Arctic
- NASA Goddard: A selective History of Ice observations in the Arctic - Part 1 and Part 2 on Youtube
- The Encyclopedia of Earth: Impacts of global warming in Alaska
- FAZ: League of Nations in the no longer eternal ice of September 20, 2007
- Polar Portal: Monitoring Ice and Climate in the Arctic
- Visualization of the development of arctic sea ice at ETH Zurich
-
Deutschlandfunk , November 8, 2016, Andrea Rehmsmeier : Natives of the Russian Arctic: In the fight against climate change and corporations
- March 21, 2017, Dietrich Karl Mäurer: Arctic and Antarctic - Depleted by heat waves and temperature records
- Background , November 2, 2017, Thilo Kößler: In the land of collapsing glaciers
- BBC Future August 27, 2019, Zoe Cormier, bbc.com: Why the Arctic is smouldering
- Zachary Labe , sites.uci.edu: Arctic Sea Ice and Extreme Weather Events
- climatereanalyzer.org: Daily Sea Ice Timeseries & Maps - Northern Hemisphere Sea Ice Extent
Individual evidence
- ↑ Martin Sommerkorn and Susan Joy Hassol (eds.) (2009): Arctic Climate Feedbacks: Global Implications . Published by WWF International Arctic Program (PDF; 11 MB)
- ↑ Przybylak, Rajmund (2007): Recent air-temperature changes in the Arctic , in: Annals of Glaciology, Vol. 46, pp. 316-324 (PDF)
- ↑ a b Quinn, PK, TS Bates, E. Baum et al. (2007): Short-lived pollutants in the Arctic: their climate impact and possible mitigation strategies , in: Atmospheric Chemistry and Physics , Vol. 7, pp. 15669–15692, see online
- ↑ a b Flanner, Mark G., Charles S. Zender, James T. Randerson and Philip J. Rasch (2007): Present-day climate forcing and response from black carbon in snow , in: Journal of Geophysical Research , Vol. 112 , D11202, doi: 10.1029 / 2006JD008003 (PDF)
- ↑ Intergovernmental Panel on Climate Change (2007): IPCC Fourth Assessment Report - Working Group I Report “The Physical Science Basis”
- ↑ a b c d e f Arctic Climate Impact Assessment (2004): Arctic Climate Impact Assessment . Cambridge University Press, ISBN 0-521-61778-2 , see online
- ↑ a b Intergovernmental Panel on Climate Change (2007): Report of Working Group II, Impacts, Adaptation and Vulnerability , Chapter 15: Polar Regions (PDF; 1 MB) ( Memento from September 20, 2008 in the Internet Archive ) (English)
- ↑ Scinexx.de of January 28, 2011: Atlantic water warms up the Arctic: The most recent temperature rise in the Fram Strait is unique in the last 2,000 years
- ↑ a b Cecilia Bitz (2006): Polar Amplification , in: RealClimate.org
- ↑ Kristina Pistone, Ian Eisenman, Veerabhadran Ramanathan: Radiative Heating of an Ice-Free Arctic Ocean . In: Geophysical Research Letters . 2019, doi : 10.1029 / 2019GL082914 .
- ↑ Lawrence, David M., Andrew G. Slater, Robert A. Tomas et al. (2008): Accelerated Arctic land warming and permafrost degradation during rapid sea ice loss , in: Geophysical Research Letters , Vol. 35, L11506, doi: 10.1029 / 2008GL033985
- ^ Kaufman, DS, TA Ager, NJ Anderson, PM Anderson, JT Andrews et al. (2004): Holocene Thermal Maximum in the Western Arctic (0–180 ° W) , in: Quaternary Science Reviews, No. 23, pp. 529–560, doi: 10.1016 / j.quascirev . 2003.09.007 (PDF)
- ↑ a b c van den Broeke, Michiel; Jonathan Bamber; Janneke Ettema et al. (2009): Partitioning Recent Greenland Mass Loss . In: Science, 326, pp. 984-986, doi: 10.1126 / science.1178176
- ↑ Chen, JL, CR Wilson and BD Tapley (2006): Satellite Gravity Measurements Confirm Accelerated Melting of Greenland Ice Sheet , in: Science , Vol. 313, No. 5795, pp. 1958-1960, doi: 10.1126 / science.1129007
- ↑ a b Wouters, B .; Chambers, D .; Schrama, EJO (2008): GRACE observes small-scale mass loss in Greenland . In: Geophysical Research Letters , Vol. 35, L20501, doi: 10.1029 / 2008GL034816
- ^ V. Helm, A. Humbert, and H. Miller: Elevation and elevation change of Greenland and Antarctica derived from CryoSat-2 Archived from the original on September 6, 2014. In: The Cryosphere . 8, No. 1, 2014, pp. 1–21. doi : 10.5194 / tcd-8-1673-2014 . Retrieved August 22, 2014.
- ↑ Eric Rignot ; E. Burgess; E. Hanna (2008): Mass balance of the Greenland ice sheet from 1958 to 2007 . In: Geophysical Research Letters , Vol. 35, L20502, doi: 10.1029 / 2008GL035417
- ↑ DMI: daily accounting of ice shrinkage
- ↑ Tedesco, Marco (2007): Snowmelt detection over the Greenland ice sheet from SSM / I brightness temperature daily variations , in: Geophysical Research Letters , Vol. 34, L02504, doi: 10.1029 / 2006GL028466
- ↑ Melting ice sheets becoming largest contributor to sea level rise, AGU release no 11-09, March 8, 2001 online
- ↑ Alexander Robinson, Reinhard Calov, Andrey Ganopolski: Multistability and critical thresholds of the Greenland ice sheet. In: Nature Climate Change 2, 2012, pp. 429-432, doi: 10.1038 / NCLIMATE1449 .
- ↑ PIK Potsdam Greenland's ice masses could completely melt at 1.6 degrees global warming
- ^ Maria-José Viñas: Satellites See Unprecedented Greenland Ice Sheet Surface Melt. National Aeronautics and Space Administration (NASA), July 24, 2012, accessed July 22, 2015 .
- ↑ NASA: Satellites See Unprecedented Greenland Ice Sheet Surface Melt . In: NASA . Open Publishing. July 24, 2012. Retrieved July 26, 2012.
- ↑ SA Khan, I. Sasgen, M. Bevis, T. van Dam, JL Bamber, J. True, M. Willis, KH Kjaer, B. Wouters, V. Helm, B. Csatho, K. Fleming, AA Bjork, A. Aschwanden, P. Knudsen, PK Munneke: Geodetic measurements reveal similarities between post-Last Glacial Maximum and present-day mass loss from the Greenland ice sheet . In: Science Advances . 2, No. 9, September 2, 2016, p. E1600931. doi : 10.1126 / sciadv.1600931 .
- ↑ deutschlandfunk.de , Research News , November 5, 2016, Volker Mrasek: The ice in the northeast is getting thinner (November 5, 2016)
- ↑ New Scientist: Shrinking ice means Greenland is rising fast from November 2, 2007, see online ( Memento from December 23, 2007 in the Internet Archive )
- ↑ Khan, Shfaqat A., John True, Leigh A. Stearns et al. (2007): Elastic uplift in southeast Greenland due to rapid ice mass loss , in: Geophysical Research Letters , Vol. 34, L21701, doi: 10.1029 / 2007GL031468 (PDF)
- ↑ van der Wal, RSW, W. Boot, MR van den Broeke et al. (2008): Large and Rapid Melt-Induced Velocity Changes in the Ablation Zone of the Greenland Ice Sheet , in: Science , Vol. 321. No. 5885, pp. 111-113, doi: 10.1126 / science.1158540
- ↑ Howat, Ian M., Ian Joughin and Ted A. Scambos (2007): Rapid Changes in Ice Discharge from Greenland Outlet Glaciers , in: Science , March 16, Vol. 315., No. 5818, pp. 1559-1561 doi: 10.1126 / science.1138478
- ^ NASA (2004): Fastest Glacier in Greenland Doubles Speed from January 12th
- ↑ a b Intergovernmental Panel on Climate Change (2007): Climate Change 2007 - IPCC Fourth Assessment Report. Report of the Working Group I: The Physical Science Basis . Chapter 5: Observations: Oceanic Climate Change and Sea Level (PDF; 15.7 MB) ( Memento from May 13, 2017 in the Internet Archive )
- ↑ Stefan Rahmstorf, Anny Cazenave , John A. Church, James E. Hansen, Ralph F. Keeling et al. (2007): Recent Climate Observations Compared to Projections , in: Science , Vol. 316, p. 709, doi: 10.1126 / science.1136843 (PDF; 84 kB)
- ↑ Intergovernmental Panel on Climate Change (2007): Fourth Assessment Report. Report of the Working Group I: The Physical Science Basis.
- ^ Truffer, Martin and Mark Fahnestock (2007): Rethinking Ice Sheet Time Scales , in: Science , Vol. 315, pp. 1508-1510, online
- ^ Overpeck, Jonathan T., Bette L. Otto-Bliesner, Gifford H. Miller, Daniel R. Muhs, Richard B. Alley , and Jeffrey T. Kiehl (2006): Paleoclimatic Evidence for Future Ice-Sheet Instability and Rapid Sea- Level Rise , in: Science , Vol. 311, pp. 1747-1750, doi: 10.1126 / science.1115159
- ^ Hansen, James (2005): A Slippery Slope: How Much Global Warming Constitutes “Dangerous Anthropogenic Interference”? In: Climatic Change , Vol. 68, pp. 269–279 (PDF; 259 kB)
- ↑ Hansen, James, Makiko Sato, Pushker Kharecha, Gary Russell, David W. Lea and Mark Siddall (2007): Climate Change and Trace Gases , in: Philosophical Transactions of the Royal Society A, Vol. 365, pp. 1925–1954 , doi: 10.1098 / rsta.2007.2052 (PDF; 1 MB) ( Memento from October 22, 2011 in the Internet Archive )
- ↑ Hansen, James (2007): Scientific Reticence and Sea Level Rise , in: Environmental Research Letters , Vol. 2, doi: 10.1088 / 1748-9326 / 2/2/024002 (PDF; 202 kB) ( Memento from October 22 2011 in the Internet Archive )
- ↑ Stefan Rahmstorf, 2002: Ocean circulation and climate during the past 120,000 years . In: Nature 419, pp. 207–214 pik-potsdam.de (PDF; 340 kB)
- ↑ Rahmstorf, Stefan (2006): Thermohaline Ocean Circulation , in: Encyclopedia of Quaternary Sciences, Edited by SA Elias. Elsevier, Amsterdam, ( PDF ( Memento of July 3, 2007 in the Internet Archive ))
- ↑ IFM-GEOMAR (2007): How does the Gulf Stream react to climate change? New findings from a 10-year study in the subpolar North Atlantic . ( Memento of April 27, 2007 in the Internet Archive ) Press release of March 16
- ↑ Volker Mrasek: Rapid warming: Arctic climate could have irreversibly tipped. In: Spiegel-Online. December 4, 2008, accessed June 30, 2015 .
- ^ Dorothy Hall (2006): Receding Glacier in Iceland , Earth Observatory Newsroom: New Images, February 18, online
- ↑ World Glacier Monitoring Service (2005): Glacier mass balance data 2004 , online ( Memento from July 16, 2007 in the Internet Archive )
- ↑ Anderson, RK, GH Miller, JP Briner, NA Lifton and SB DeVogel (2008): A millennial perspective on Arctic warming from 14C in quartz and plants emerging from beneath ice caps , in: Geophysical Research Letters , Vol. 35, L01502, doi: 10.1029 / 2007GL032057 , see also University of Colorado at Boulder press release: Baffin Island Ice Caps Shrink By 50 Percent Since 1950s, Says CU-Boulder Study ( Memento from January 29, 2008 in the Internet Archive ) from January 28, 2008
- ↑ Abdalati, W., W. Krabill, E. Frederick, S. Manizade, C. Martin, J. Sonntag, R. Swift, R. Thomas, J. Yungel, and R. Koerner (2004): Elevation changes of ice caps in the Canadian Arctic Archipelago , in: Journal of Geophysical Research , 109, November 20, online
- ↑ David O. Burgess and Martin J. Sharpa (2003): Recent Changes in Areal Extent of the Devon Ice Cap, Nunavut, Canada , in: BioOne, Volume 36, pp. 261-271, online
- ↑ Carsten Braun, DR Hardy, RS Bradley (2004): Mass balance and area changes of four High Arctic plateau ice caps, 1959–2002 , in: Geografiska Annaler, V. 86, (PDF; 1.2 MB)
- ^ Glowacki, Piotr: Glaciology and environmental monitoring , Research in Hornsund, online
- ↑ Greenpeace (2002): Arctic environment melts before our eyes. , August 7th, online
- ↑ David Rippin, Ian Willis, Neil Arnold, Andrew Hodson, John Moore, Jack Kohler and Helgi Bjornsson (2003): Changes in Geometry and Subglacial Drainage of Midre Lovenbreen, Svalbard, Determined from Digital Elevation Models , in: Earth Surface Processes and Landforms , Vol. 28, pp. 273–298, (PDF)
- ↑ a b Zhang, Jinlun and DA Rothrock: Modeling global sea ice with a thickness and enthalpy distribution model in generalized curvilinear coordinates, Mon. Wea. Rev. 131 (5), 2003, pp. 681-697. http://psc.apl.washington.edu/ArcticSeaiceVolume/IceVolume.php ( Memento from July 11, 2010 in the Internet Archive )
- ↑ Parkinson and Cavalieri: Arctic sea ice variability and trends, 1979-2006 . In: Journal of Geophysical Research . 2008, doi : 10.1029 / 2007JC004558 .
- ↑ Christophe et al. Kinnard: Reconstructed changes in Arctic sea ice over the past 1,450 years . In: Nature . 2011. doi : 10.1038 / nature10581 .
- ^ Polyak et al .: History of sea ice in the Arctic . In: Quaternary Science Reviews . 2010, p. 1757-1778 .
- ↑ Mark C. Serreze, Marika M. Holland, Julienne Stroeve: Perspectives on the Arctic's Shrinking Sea Ice Cover . In: Science 315 (5818), 2007, pp. 1533-1536, doi: 10.1126 / science.1139426
- ^ Meier, Walter N., Julienne Stroeve and Florence Fetterer (2007): Whither Arctic sea ice? A clear signal of decline regionally, seasonally and extending beyond the satellite record , in: Annals of Glaciology, Vol. 46, pp. 428–434 (PDF)
- ↑ NASA (2006): Arctic Ice Meltdown Continues With Significantly Reduced Winter Ice Cover, September 13th
- ↑ National Snow and Ice Data Center (NSIDC): Arctic Sea Ice News Fall 2007
- ↑ National Snow and Ice Data Center (NSIDC): Arctic Sea Ice Shatters All Previous Record Lows from October 1, 2007
- ↑ Alfred Wegener Institute for Polar and Marine Research (2007): The Sea Ice Is Getting Thin - Image of the Climate and Ecosystem of the Arctic Ocean , press release of September 13th (HTML)
- ↑ Seymour W. Laxon et al .: CryoSat-2 estimates of Arctic sea ice thickness and volume . In: Geophysical Research Letters 40, 2013, doi: 10.1002 / grl.50193
- ↑ ESA News Portal: Satellites witness lowest Arctic ice coverage in history from September 14, 2007
- ↑ Spiegel Online: Northeast and Northwest Passages ice-free for the first time at the same time from August 27, 2008
- ↑ Giles, KA, SW Laxon, and AL Ridout (2008), Circumpolar thinning of Arctic sea ice following the 2007 record ice extent minimum, Geophysical Research Letters , 35, L22502, doi: 10.1029 / 2008GL035710
- ↑ FAZ: The Northwest Passage will be controlled from September 18, 2007
- ↑ a b Zhang, X., A. variety Berg, J. Zhang, R. Gerdes, and JC Comiso (2008), Recent radical shifts of atmospheric circulations and rapid changes in Arctic climate system, Geophys. Res. Lett., 35, L22701, doi: 10.1029 / 2008GL035607
- ↑ Stroeve, J., MM Holland, W. Meier, T. Scambos, and M. Serreze (2007), Arctic sea ice decline: Faster than forecast, Geophysical Research Letters , 34, L09501, doi: 10.1029 / 2007GL029703
- ↑ Holland, MM, CM Bitz and B. Tremblay (2006): Future abrupt reductions in the Summer Arctic sea ice , in: Geophysical Research Letters , Vol. 33, L23503, doi: 10.1029 / 2006GL028024 (PDF)
- ↑ Ice-free Arctic summers could happen on earlier side of predictions: A new study in AGU's journal Geophysical Research Letters predicts the Arctic Ocean will be ice-free in summer by mid-century. February 27, 2019, accessed October 1, 2019 .
- ↑ Stroeve, Julienne, Marika M. Holland, Walt Meier, Ted Scambos, and Mark Serreze (2007): Arctic Sea Ice Decline: Faster Than Forecast , in: Geophysical Research Letters , Vol. 34, L09501, doi: 10.1029 / 2007GL029703
- ^ Tara (2007) ( Memento of February 18, 2009 in the Internet Archive )
- ↑ Archived copy ( Memento from February 20, 2009 in the Internet Archive )
- ↑ deutschlandfunk.de , Forschungs aktuell , November 5, 2016, Volker Mrasek : Every New York passenger melts three square meters of Arctic sea ice (November 5, 2016)
- ^ D. Notz, J. Stroeve: Observed Arctic sea-ice loss directly follows anthropogenic CO2 emission . In: Science . November 3, 2016. doi : 10.1126 / science.aag2345 . PMID 27811286 .
- ^ National Snow and Ice Data Center: Arctic sea ice extent settles at record seasonal minimum , September 19, 2012
- ↑ Rachel L. Tilling, Andy Ridout, Andrew Shepherd, Duncan J Wingham (2015): Increased Arctic sea ice volume after anomalously low melting in 2013 , in: Nature Geoscience , Vol. 8, pp. 643-646 doi: 10.1038 / ngeo2489
- ↑ VIsualization Service of Horizontal scale Observations at Polar region. In: ads.nipr.ac.jp. Retrieved September 12, 2016 .
- ↑ C. Monnett, JS Gleason (2006): Observations of mortality associated with extended open-water swimming by polar bears in the Alaskan Beaufort Sea , in: Polar Biology, Volume 29, pp. 681-687, online ( Memento from 17. January 2008 in the Internet Archive )
- ^ Badische Zeitung: The ice in the Arctic is getting thinner and thinner - Panorama - Badische Zeitung . ( badische-zeitung.de [accessed on March 10, 2018]).
-
↑ a b Christoph Seidler, DER SPIEGEL: Climate change in the Arctic: The ice at the North Pole can no longer be saved - DER SPIEGEL - Wissenschaft. Retrieved April 22, 2020 . doi: 10.1029 / 2019GL086749
- ^ Arctic Sea Ice and Extreme Weather Events. Retrieved April 22, 2020 (American English).
- ↑ Tietsche, S., D. Notz, JH Jungclaus, and J. Marotzke (2011), Recovery mechanisms of Arctic summer sea ice, Geophysical Research Letters , 38, L02707, doi: 10.1029 / 2010GL045698 . Available online
- ↑ Tipping points in the Arctic? KlimaLounge from February 11, 2011
- ↑ a b Art. 76 Clause 8 UNCLOS , Appendix 2, Art. 4 UNCLOS
- ↑ Ratification status of UNCLOS according to states ( Memento of July 11, 2007 in the Internet Archive )
- ↑ CLCS: Submissions to the Commission: Submission by the Russian Federation , December 20, 2,001th
- ^ Map of the expansion of the continental shelf proposed by Russia. The border of the exclusive economic zone is marked in red, areas still claimed by Russia are hatched in black.
- ↑ a76.dk ( Memento from February 23, 2011)
- ↑ CLCS: Submissions to the Commission: Submission by Norway
- ↑ deutschlandfunk.de , background , August 25, 2017, Thilo Kößler: Climate Change in Alaska - The Last Days of Shishmaref (September 17, 2017)
- ↑ Uma S. Bhatt et al. a .: Implications of Arctic Sea Ice Decline for the Earth System . In: Annual Review of Environment and Resources . 2014, 4.2 Ocean Biology, doi : 10.1146 / annurev-environ-122012-094357 ( PDF ).
- ↑ Stirling, Ian and Claire L. Parkinson (2006): Possible Effects of Climate Warming on Selected Populations of Polar Bears (Ursus maritimus) in the Canadian Arctic , in: Arctic, Vol. 59, No. 3, September, p. 261 –275 (PDF) ( Memento from June 6, 2013 in the Internet Archive )
- ↑ US Geological Survey (2008): USGS Science to Inform US Fish & Wildlife Service Decision Making on Polar Bears - Executive Summary (PDF; 43 kB) ( Memento from April 13, 2008 in the Internet Archive )
- ↑ DeWeaver, Eric (2007): Uncertainty in Climate Model Projections of Arctic Sea Ice Decline: An Evaluation Relevant to Polar Bears . Administrative Report, US Department of the Interior, US Geological Survey (PDF; 1.7 MB) ( Memento from May 9, 2009 in the Internet Archive )
- ↑ Arctic Climate Impact Assessment 2004, pp. 487, 504, 509, 1004
- ↑ Laidre, Kristin L., Ian Stirling, Lloyd F. Lowry et al. (2008): Quantifying the Sensitivity of Arctic Marine Mammals to Climate-Induced Habitat Change , in: Ecological Applications, 18 (2), Supplement, pp. S97-S125, doi: 10.1890 / 06-0546.1
- ↑ Arctic Climate Impact Assessment 2004, pp. 209-219
- ↑ Permafrost Threatened by Rapid Retreat of Arctic Sea Ice, NCAR Study Finds ( Memento from January 18, 2010 in the Internet Archive )
- ↑ KM Walter, ME Edwards, G. Grosse, SA Zimov, FS Chapin: Thermokarst Lakes as a Source of Atmospheric CH4 During the Last Deglaciation, Science , Vol. 318. no. 5850, 2007, pp. 633–636 doi: 10.1126 / science.1142924 abstract online
- ↑ Khvorostyanov, DV, P. Ciais, G. Krinner, and SA Zimov (2008), Vulnerability of east Siberia's frozen carbon stores to future warming, Geophysical Research Letters , 35, L10703 (PDF; 1.3 MB) doi: 10.1029 / 2008GL033639
- ^ Douglas, Marianne SV, John P. Smol and Weston Blake Jr. (1994): Marked Post-18th Century Environmental Change in High-Arctic Ecosystems , in: Science , Vol. 266, No. 5184, pp. 416-419 doi : 10.1126 / science.266.5184.416
- ↑ Smol, John P. and Marianne SV Douglas (2007): Crossing the final ecological threshold in high Arctic ponds , in: Proceedings of the National Academy of Sciences , Vol. 104, No. 30, pp. 12395–12397, doi: 10.1073 / pnas.0702777104 (PDF) . Original quote: "By comparing recent pond water specific conductance values to similar measurements made in the 1980s, we link the disappearance of the ponds to increased evaporation / precipitation ratios, probably associated with climatic warming." See also the ScienceDaily report Global Warming Is Evaporating Arctic Ponds, New Study Shows July 4, 2007.
- ^ "Ecological grief": Greenland residents traumatised by climate emergency. In: The Guardian. August 12, 2019, accessed on August 19, 2019 .