
Parliamentary election in Finland 2011


The 2011 parliamentary elections in Finland took place on April 17, 2011. It was the election for the 36th Finnish parliament .
The National Coalition Party Finance Minister Jyrki Katainen reached 20.4 percent of the vote, becoming the strongest force. The Social Democrats won 19.1 percent of the vote, the worst result ever. With a gap of just under 1,500 votes and also 19.1 percent, the base Finns came third. The party led by Timo Soini was able to more than quadruple its result in relation to the 2007 election. The Finnish Center Party of Prime Minister Mari Kiviniemi was one of the losers in the election . The center lost more than seven percentage points and achieved the worst result since 1917 with 15.8 percent.
Starting position
In 2007 the Center Party was able to defend its position as the strongest force. It received 23.1% of the vote and formed the largest parliamentary group in the Finnish Parliament with 51 out of 200 seats . The conservative rallying party (Kansallinen Kokoomus) got 50 seats. It was followed by the Social Democrats (SDP) with 45 seats. Also represented in parliament were the Left Alliance (17 seats), the Green Bund (15 seats), the Finnish Christian Democrats (7 seats), the Swedish People's Party (10 seats, including the Åland mandate) and the Basic Finns (5 seats). After the parliamentary elections on March 18, 2007 Matti Vanhanen (center) formed a government with the rally party, the Greens and the Swedish People's Party . On June 22, 2010, Vanhanen was replaced by Mari Kiviniemi.

Electoral system
Finland is divided into 15 constituencies, each with a certain number of the total of 200 seats. The D'Hondt method is used to count .
The electoral districts are (the number of mandates in brackets):
- Helsinki (21)
- Uusimaa (35)
- Varsinais Suomi (17)
- Satakunta (9)
- Åland to Ahvenanmaa (1)
- Malice (14)
- Pirkanmaa (18)
- Kymi (12)
- South Savo - Etelä-Savo (6)
- North Savo to Pohjois-Savo (9)
- North Karelia to Pohjois-Karjala (6)
- Vaasa (17)
- Central Finland to Keski-Suomi (10)
- Oulu (18)
- Lapland to Lappi (7)
Parties
17 registered parties ran for election.
The following parties were already represented in parliament:
| logo | Political party | Alignment | Top candidate | |
|---|---|---|---|---|

|
Finnish Center Party Suomen Keskusta (KESK) Centern i Finland (CENT) |
social liberal | Mari Kiviniemi | |
|
National Collection Party Kansallinen Kokoomus (KOK) Samlingspartiet (SAML) |
conservative | Jyrki Katainen | ||
|
|
Social Democratic Party of Finland Suomen Sosialidemokraattinen Puolue (SDP) Finlands Socialdemokratiska Parti (SDP) |
social democratic | Jutta Urpilainen | |

|
Left Alliance Vasemmistoliitto (VAS) Vänsterförbundet (VÄNST) |
socialist | Paavo Arhinmäki | |
|
|
Green Bund Vihreä liitto (VIHR) Gröna förbundet (GRÖNA) |
green | Anni Sinnemäki | |

|
Finnish Christian Democrats Kristillisdemokraatit (KD) Kristdemokraterna (KD) |
Christian Democratic | Päivi Räsänen | |

|
Swedish People's Party Ruotsalainen kansanpuolue (RKP) Svenska folkpartiet (SFP) |
liberal | Stefan Wallin | |
|
|
Base fins Perussuomalaiset (PS) Sannfinländarna (SAF) |
right-wing populist | Timo Soini | |
Other parties involved:
- Communist Party of Finland
- Seniors Party of Finland
- Independence party
- For the poor
- Communist Labor Party of Finland
- Labor Party of Finland
- Pirate Party (started for the first time)
- Change in 2011 (started for the first time)
- Freedom Party (first started)
Survey
The last twelve months before the election in April 2011 were marked by a strong surge in popularity among the base Finns, who in the monthly surveys carried out by Taloustutkimus increased their share of the vote from 6.3% in February 2010 to up to 17.2% in March 2011. Almost all the other parties represented in parliament suffered losses in the polls, including the Center Party, which in the April 2011 poll only came to 18.6%.
Election result
Nationwide vote count
| Political party | be right | Seats | ||||
|---|---|---|---|---|---|---|
| number | % | +/- | number | +/- | ||
| National Collection Party (KOK) | 599.138 | 20.4 | −1.9 | 44 | −6 | |
| Social Democratic Party of Finland (SDP) | 561,558 | 19.1 | −2.3 | 42 | −3 | |
| Basic fins (PS) | 560.075 | 19.1 | +15.0 | 39 | +34 | |
| Finnish Center Party (KESK) | 463.266 | 15.8 | −7.3 | 35 | −16 | |
| Left Alliance (VAS) | 239.039 | 8.1 | −0.7 | 14th | −3 | |
| Green Bund (VIHR) | 213.172 | 7.3 | −1.2 | 10 | −5 | |
| Swedish People's Party (RKP) | 125,785 | 4.3 | −0.3 | 9 | ± 0 | |
| Finnish Christian Democrats (KD) | 118,453 | 4.0 | −0.9 | 6th | −1 | |
| Pirate Party (PP) | 15,103 | 0.5 | +0.5 | - | - | |
| Communist Party of Finland (SKP) | 9,232 | 0.3 | −0.4 | - | - | |
| Åland coalition | 8,546 | 0.3 | - | 1 | ± 0 | |
| Change 2011 (M11) | 7,504 | 0.3 | +0.3 | - | - | |
| Freedom Party - Finland's Future (VP) | 4,285 | 0.1 | +0.1 | - | - | |
| Independence party | 3,236 | 0.1 | −0.1 | - | - | |
| Seniors Party of Finland (SSP) | 3,195 | 0.1 | −0.5 | - | - | |
| Workers' Party of Finland (STP) | 1,857 | 0.1 | +0.1 | - | - | |
| Communist Labor Party (KTP) | 1,575 | 0.0 | −0.1 | - | - | |
| For the poor | 1,335 | 0.0 | −0.1 | - | - | |
| Others | 3,217 | 0.1 | - | - | - | |
| total | 2,939,571 | 100.0 | 200 | |||
| Valid votes | 2,939,571 | 99.4 | ||||
| Invalid votes | 16,294 | 0.6 | ||||
| voter turnout | 2,955,865 | 67.4 | ||||
| Eligible voters | 4,387,701 | 100.0 | ||||
| Source: Finnish Ministry of Justice | ||||||
The turnout was 70.5% and thus slightly higher than in the 2007 parliamentary elections.
Results by constituency
| district | voter turnout | Parties | |||||||||
|---|---|---|---|---|---|---|---|---|---|---|---|
| COOK | SDP | PS | KESK | VAS | VIHR | RKP | KD | Other | |||
| Helsinki | 75.5 | 27.3 | 17.5 | 13.0 | 4.5 | 10.4 | 16.7 | 5.8 | 2.4 | 2.4 | |
| Uusimaa | 72.9 | 28.4 | 19.3 | 18.8 | 6.4 | 5.1 | 9.1 | 8.3 | 2.8 | 1.8 | |
| Varsinais-Suomi | 71.2 | 23.0 | 19.6 | 18.1 | 11.6 | 9.6 | 7.3 | 5.5 | 2.9 | 2.4 | |
| Satakunta | 69.5 | 17.6 | 24.0 | 23.6 | 16.1 | 10.9 | 3.8 | - | 3.4 | 0.6 | |
| Åland | 51.1 | - | - | - | - | - | - | - | - | 100.0 | |
| Malice | 68.8 | 22.5 | 24.1 | 20.6 | 13.2 | 6.9 | 4.5 | - | 6.8 | 1.4 | |
| Pirkanmaa | 71.5 | 22.3 | 21.6 | 21.1 | 10.4 | 8.3 | 8.3 | - | 5.0 | 3.0 | |
| Kymi | 67.4 | 18.0 | 24.6 | 23.3 | 16.8 | 5.7 | 4.2 | - | 6.6 | 0.8 | |
| South Savo | 66.5 | 14.1 | 24.0 | 20.5 | 26.8 | 2.2 | 7.1 | - | 4.5 | 0.8 | |
| North Savo | 66.3 | 16.4 | 18.3 | 20.8 | 25.4 | 8.4 | 5.5 | - | 3.9 | 1.3 | |
| North Karelia | 65.7 | 10.5 | 26.4 | 23.1 | 26.2 | 4.2 | 5.4 | - | 2.8 | 1.4 | |
| Vaasa | 73.2 | 14.1 | 14.0 | 17.2 | 22.6 | 3.7 | 1.4 | 19.4 | 6.6 | 1.0 | |
| Central Finland | 69.0 | 15.0 | 21.2 | 18.1 | 21.8 | 9.0 | 6.5 | - | 6.4 | 2.0 | |
| Oulu | 67.7 | 11.9 | 11.0 | 20.1 | 33.4 | 14.5 | 4.9 | 0.2 | 2.8 | 1.2 | |
| Lapland | 67.5 | 12.5 | 11.8 | 20.5 | 32.2 | 16.7 | 3.4 | 0.4 | 1.6 | 0.9 | |
| Finland | 70.5 | 20.4 | 19.1 | 19.1 | 15.8 | 8.1 | 7.3 | 4.3 | 4.0 | 1.9 | |
| Source: yle.fi | |||||||||||
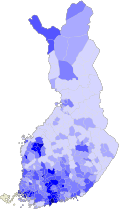
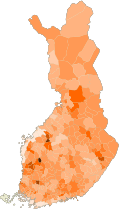
Results by municipalities
 National rally party
- 0-10%
- 10-15%
- 15-20%
- 20-25%
- 25-30%
- 30-35%
- 35-40%
- 40-100%
 Social democrats
- 0-10%
- 10-15%
- 15-20%
- 20-25%
- 25-30%
- 30-35%
- 35-100%
 Base fins
- 0-10%
- 10-15%
- 15-20%
- 20-25%
- 25-30%
- 30-35%
- 35-40%
- 40-45%
- 45-50%
- 50-100%
 Center Party
- 0-10%
- 10-15%
- 15-20%
- 20-25%
- 25-30%
- 30-35%
- 35-40%
- 40-45%
- 45-50%
- 50-100%


After the election
After the election, it was expected that Katainen would, among other things, want to form a government with the base Finns. However, after the Katainens gathering party had agreed to activate the European Stabilization Mechanism for Portugal, the grassroots Finns withdrew their commitment to participate in the government. Katainen then began coalition talks with the Greens, the Swedish People's Party and the Christian Democrats, as well as with the Social Democrats. On June 22, 2011, the new government of Finland was finally sworn in. The left-wing alliance left the coalition on March 25, 2014, after two members of the parliamentary group had already resigned. The remaining five governing parties provided 110 of the 200 seats. Katainen announced his resignation as Prime Minister in the spring of 2014 in order to be able to hold an EU office after the European elections. His successor was his party colleague Alexander Stubb, who continued the cabinet of Katainen, but restructured some posts. At the end of September 2014, the Green Bund left the coalition after the cabinet voted 10 to 7 to build another nuclear power plant in Pyhäjoki . Stubb's coalition now has 102 seats.
- Cabinet Katainen - Jyrki Katainen (Collection Party) - Collection Party, Social Democratic Party, Left Alliance (until March 25, 2014), Green Bund, Swedish People's Party, Christian Democrats (June 22, 2011 to June 24, 2014)
- Stubb Cabinet - Alexander Stubb (Collection Party) - Collection Party, Social Democratic Party, Green Bund (until September 26, 2014), Swedish People's Party, Christian Democrats (since June 24, 2014)
Footnotes
- ↑ a b c Official result of the 2011 parliamentary elections Finnish Ministry of Justice (Finnish, English)
- ↑ Euro opponents triumph in Finland Spiegel Online, April 18, 2011
- ↑ finlex.fi: Valtioneuvoston asetus kansanedustajien paikkojen jaosta vaalipiirien kesken (Finnish; accessed April 14, 2011)
- ↑ vaalit.fi: List of Registered Parties ( Memento of the original from July 20, 2011 in the Internet Archive ) Info: The archive link was inserted automatically and has not yet been checked. Please check the original and archive link according to the instructions and then remove this notice. (English, accessed April 14, 2011)
- ↑ focus.de: Finland gets new coalition due to EU dispute (May 12, 2011; accessed on May 23, 2011)
- ↑ Greens leave Finland's government because of the construction of a nuclear power plant , Neues Deutschland , September 28, 2014
Web links
- Official website of the Finnish Parliament (Finnish, Swedish, English, French)
| Presidential election |
1919 • 1925 • 1931 • 1937 • 1940 • 1943 • 1944 • 1946 • 1950 • 1956 • 1962 • 1968 • 1973 • 1978 • 1982 • 1988 • 1994 • 2000 • 2006 • 2012 • 2018 |
|
| Parliamentary elections |
1907 • 1908 • 1909 • 1910 • 1911 • 1913 • 1916 • 1917 • 1919 • 1922 • 1924 • 1927 • 1929 • 1930 • 1933 • 1936 • 1939 • 1945 • 1948 • 1951 • 1954 • 1958 • 1962 • 1966 • 1970 • 1972 • 1975 • 1979 • 1983 • 1987 • 1991 • 1995 • 1999 • 2003 • 2007 • 2011 • 2015 • 2019 |
|
| Provincial elections | ||
| Local elections |
1918 • 1919 • 1920 • 1921 • 1922 • 1923 • 1924 • 1925 • 1928 • 1930 • 1933 • 1936 • 1945 • 1947 • 1950 • 1953 • 1956 • 1960 • 1964 • 1968 • 1972 • 1976 • 1980 • 1984 • 1988 • 1992 • 1996 • 2000 • 2004 • 2008 • 2012 • 2017 |
|
| European elections | ||
| Referendums |
