
Antwerp Province
|
Antwerp Antwerp ( Dutch ) Anvers ( French ) |
|
 |
 |
| Country: | Belgium |
| Region : | Flanders |
| Capital: | Antwerp |
| Area : | 2,867 km² |
| Residents | 1,857,986 (Jan 1, 2019) |
| Population density | 648 inhabitants / km² |
| surface | 2,867 km² |
| Municipalities : | 69 |
| Website: | www.provincieantwerpen.be |
| NIS code | 10,000 |
| politics | |
|---|---|
| Governor: | Cathy Berx ( CD&V ) |
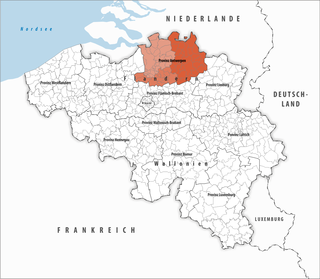
| Location of the province in Belgium | |
|
|
| 69 municipalities in the province | |
 |
|
Antwerp is one of the five provinces of the Belgian region of Flanders and the most populous province in Belgium. It borders the provinces of Limburg in the east, Flemish Brabant in the south and East Flanders in the west. In the north, Antwerp borders on the Dutch province of Noord-Brabant .
Districts
The province of Antwerp is divided into three districts. These are in French as arrondissements and in Dutch as arrondissementen referred. Sometimes the term arrondissement is also used in German, although district is the official term.
| district | Communities | Residents January 1, 2019 |
Area km² |
Density of population / km² |
NIS code |
|---|---|---|---|---|---|
| Antwerp | 30th | 1,051,301 | 1,000.32 | 1,051 | 11000 |
| Mechelen | 12 | 344,818 | 510.23 | 676 | 12000 |
| Turnhout | 27 | 461,867 | 1,356.87 | 340 | 13000 |
| Antwerp Province | 69 | 1,857,986 | 2,867.42 | 648 | 10,000 |
Communities
As of January 1, 2019, the province of Antwerp consists of 69 municipalities (population on January 1, 2019)
- Aartselaar (14,293)
- Antwerp (City) (525,935)
- Arendonk (13,293)
- Baarle-Hertog (2760)
- Balen (22,618)
- Beerse (18,084)
- Berlaar (11,527)
- Boechout (13,266)
- Bonheiden (15,010)
- Boom (18,244)
- Bornem (21,366)
- Borsbeek (10,854)
- Brasschaat (37,946)
- Brecht (29,268)
- Dessel (9598)
- Duffel (17,491)
- Edegem (22,063)
- Food (19,038)
- Geel (Town) (40,353)
- Grobbendonk (11,155)
- Heist-op-den-Berg (42,681)
- Hemiksem (11,559)
- Herentals (City) (28,177)
- Herenthout (9061)
- Herselt (14,523)
- Hoogstraten (City) (21,355)
- Hove (8125)
- Hulshout (10,424)
- Kalmthout (18,695)
- Chapels (26,850)
- Kasterlee (18,655)
- Kontich (21,115)
- Laakdal (16,101)
- Lier (Town) (36,242)
- Lille (16,529)
- Lint (8718)
- Malle (15,561)
- Mechelen (City) (86,616)
- Meerhout (10,361)
- Merksplas (8600)
- Mol (36,825)
- Mortsel (Town) (26,099)
- Niel (10,501)
- Nijlen (22,949)
- Olen (12,505)
- Oud Turnhout (13,662)
- Putte (17,800)
- Puurs-Sint-Amands (25,932)
- Ranst (19.008)
- Ravel (15,009)
- Retie (11,396)
- Rijkevorsel (12,060)
- Rumst (15,090)
- Clamp (8518)
- Shields (19,652)
- Pods (34,517)
- Sint-Katelijne-Waver (20,792)
- Stabroek (18,710)
- Turnhout (Town) (44,664)
- Vorselaar (7861)
- Vosselaar (11,187)
- Westerlo (25,051)
- Wijnegem (9816)
- Willebroek (26,462)
- Wommelgem (12,865)
- Wuustwezel (20,970)
- Zandhoven (13,025)
- Zoersel (21,944)
- Zwijndrecht (19,056)
economy
In comparison with the gross domestic product of the European Union, expressed in purchasing power standards , the province achieved an index of 140 (EU-25: 100) in 2015, significantly higher than the Belgian average of 119 and was the economically strongest area of the region after the Brussels-Capital region Country.
In 2017 the unemployment rate was 5.9%.
Individual evidence
- ↑ Mouvement de la population par commune depuis 1992 (XLSX; 2.56 MB)
- ↑ Eurostat. Retrieved April 27, 2018 .
- ↑ Unemployment rate, by NUTS 2 regions. Retrieved November 5, 2018 .
Provinces in Flanders:
Antwerp |
Flemish Brabant |
Limburg |
East Flanders |
West Flanders
Provinces in Wallonia:
Hainaut |
Liege |
Luxembourg |
Namur |
Walloon Brabant