
East Flanders Province
|
East Flanders Oost-Vlaanderen ( Dutch ) Flandre-Orientale ( French ) |
|
 |
 |
| Country: | Belgium |
| Region : | Flanders |
| Capital: | Ghent |
| Area : | 2,982 km² |
| Residents | 1,515,064 (Jan 1, 2019) |
| Population density | 508 inhabitants / km² |
| surface | 2,982 km² |
| Municipalities : | 60 |
| Website: | www.oost-vlaanderen.be |
| NIS code | 40000 |
| politics | |
|---|---|
| Governor: | Jan Briers ( N-VA ) |
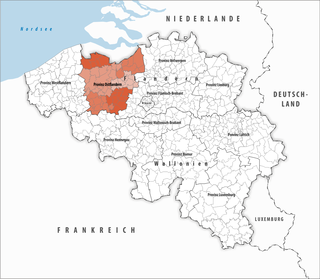
| Location of the province in Belgium | |
|
|
| 60 municipalities in the province | |
 |
|
East Flanders ( Dutch ) is one of the five provinces of the Belgian region of Flanders . It lies between the provinces of West Flanders in the west and Antwerp and Flemish Brabant in the east. East Flanders borders the Dutch province of Zeeland to the north and the province of Hainaut in Wallonia to the south .
Districts
The province of East Flanders is divided into six districts. These are in French as arrondissements and in Dutch as arrondissementen referred. Sometimes the term arrondissement is also used in German, although district is the official term.
| district | Communities | Residents January 1, 2019 |
Area km² |
Density of population / km² |
NIS code |
|---|---|---|---|---|---|
| Aalst | 10 | 291,229 | 468.92 | 621 | 41000 |
| Dendermonde | 10 | 201.213 | 342.48 | 588 | 42000 |
| Eeklo | 6th | 85,235 | 333.83 | 255 | 43000 |
| Ghent | 17th | 560,522 | 943.60 | 594 | 44000 |
| Oudenaarde | 10 | 124,342 | 418.81 | 297 | 45000 |
| Sint-Niklaas | 7th | 252.523 | 474.60 | 532 | 46000 |
| East Flanders Province | 60 | 1,515,064 | 2,982.24 | 508 | 40000 |
Communities
Since January 1, 2019, the province of East Flanders has consisted of 60 municipalities (population on January 1, 2019).
- Aalst (86,445)
- Aalter (28,784)
- Assenede (14,256)
- Berlare (14,958)
- Beveren (48,668)
- Brakel (14,801)
- Buggenhout (14,517)
- De Pinte (10,683)
- Deinze (43,264)
- Denderleeuw (20,338)
- Dendermonde (45,769)
- Destelbergen (18,271)
- Eeklo (21,134)
- Erpe-Mere (19,811)
- Evergem (35,447)
- Gavere (12,805)
- Ghent (262,219)
- Geraardsbergen (33,439)
- Haaltert (18,633)
- Hamme (24,865)
- Herzele (18,027)
- Horebeke (2036)
- Caprijke (6434)
- Kluisbergen (6488)
- Kruibeke (16,745)
- Kruisem (15,638)
- Laarne (12,370)
- Lebbeke (19,321)
- Lede (18,701)
- Lierde (6616)
- Lievegem (26,007)
- Lochristi (22,489)
- Lokeren (41,690)
- Maarkedal (6343)
- Maldegem (23,774)
- Melle (11,736)
- Merelbeke (24,660)
- Moerbeke (6481)
- Nazareth (11,619)
- Ninove (38,911)
- Ooster cele (13,590)
- Oudenaarde (31,393)
- Ronse (26,479)
- Sint-Gillis-Waas (19,370)
- Sint-Laureins (6783)
- Sint-Lievens-Houtem (10,342)
- Sint-Martens-Latem (8392)
- Sint-Niklaas (77,679)
- Stekene (18,445)
- Temse (29,926)
- Waasmunster (10,801)
- Wachtebeke (7771)
- Wetteren (25,815)
- Wichelen (11,672)
- Wortegem-Petegem (6397)
- Zele (21,125)
- Zelzate (12,854)
- Zottegem (26,582)
- Zulte (15,720)
- Zwalm (8148)
economy
In comparison with the gross domestic product of the European Union, expressed in purchasing power standards , the province achieved an index of 109 (EU-25: 100) in 2015, slightly lower than the Belgian average of 119, but above the EU average. In 2017, the unemployment rate was 3.4%, which is below the national average.
Web links
Individual evidence
- ↑ Mouvement de la population par commune depuis 1992 (XLSX; 2.56 MB)
- ↑ Eurostat. Retrieved April 27, 2018 .
- ↑ Unemployment rate, by NUTS 2 regions. Retrieved November 5, 2018 .
Provinces in Flanders:
Antwerp |
Flemish Brabant |
Limburg |
East Flanders |
West Flanders
Provinces in Wallonia:
Hainaut |
Liege |
Luxembourg |
Namur |
Walloon Brabant