Atlantic hurricane season 2011
 All the storms of the season | |
| Formation of the first storm |
June 28th |
|---|---|
| Dissolution of the last storm |
November 11th |
| Strongest storm | Ophelia - 940 hPa ( mbar ), 120 kn (220 km / h ) |
| Tropical lows | 20th |
| Storms | 19th |
| Hurricanes | 7th |
| Severe hurricanes ( Cat. 3+ ) | 4th |
| Total number of victims | 100 direct, 14 indirect |
| Total damage | ~ $ 21 billion (2011) |
|
Atlantic hurricane season 2009 , 2010 , 2011 , 2012 , 2013 | |
The 2011 Atlantic hurricane season officially began on June 1st and ended on November 30th. It is during this period that most tropical storms form , as it is only at this time that suitable conditions, such as warm ocean , moist air, and little wind shear , exist for tropical cyclones to form.
Season forecasts
| source | date |
Storms |
Number of hurricanes |
Cat. 3+ |
| CSU | Average (1950–2000) | 9.6 | 5.9 | 2.3 |
| NOAA | Average (1950–2005) | 11.0 | 6.2 | 2.7 |
| Record values (high) | 28 | 15th | 8th | |
| Record values (low) | 4th | 2 | 0 | |
| –––––––––––––––––––––––––––––––––––––––––– | ||||
| TSR | December 6, 2010 | 15.6 | 8.4 | 4.0 |
| CSU | December 8, 2010 | 17th | 9 | 5 |
| CSU | April 6, 2011 | 16 | 9 | 5 |
| CPC | May 19, 2011 | 12-18 | 6-10 | 3-6 |
| TSR | May 24, 2011 | 10-18 | 5-10 | 2-5 |
| UKMO | May 26, 2011 | 13 | N / A | N / A |
| CSU | June 1, 2011 | 16 | 9 | 5 |
| FSU COAPS | June 1, 2011 | 17th | 9 | N / A |
| CSU | August 3, 2011 | 16 | 9 | 5 |
| NOAA | 4th August 2011 | 14-19 | 7-10 | 3-5 |
| –––––––––––––––––––––––––––––––––––––––––– | ||||
| Actual activity | 19th | 7th | 4th | |
Predictions about the activity of the coming hurricane season are made every year by the hurricane experts Philip J. Klotzbach and William M. Gray and their colleagues at Colorado State University and separately by the meteorologists of NOAA and the consortium Tropical Storm Risk .
Klotzbach's team defined the average number of storms per season on average (1950-2000) at 9.6 tropical storms, 5.9 hurricanes and 2.3 severe hurricanes (ie those that are at least in on the Saffir-Simpson hurricane wind scale be classified as category 3). A normal season, as determined by NOAA, consists of 9-12 named storms, of which 5-7 become hurricane strength and 1-3 become severe hurricanes.
Forecasts before the start of the season
On December 8, 2010, Klotzbach's team predicted above-average activity with 17 named storms in a first forecast for the 2011 Atlantic hurricane season. The team is expected to turn nine of these storms into a hurricane, with five of them reaching at least Category 3. The team also assumed an Accumulated Cyclone Energy (ACE) of around 165 and stated that El Niño conditions were unlikely to form before the start of hurricane season. Finally, in their prediction, the team stated that the likelihood of storms reaching the mainland of the United States was greater than it was in 2010.
Tropical Storm Risk (TSR), a consortium at University College London that includes experts in insurance, risk management and seasonal climatic forecasts, announced a similar assessment a few days before the CSU team. TSR assumes tropical cyclone activity that could be around forty percent higher than the average for 1950–2010. In the forecast, TSR anticipates 15.6 (± 4.3) tropical storms, 8.4 (± 3.0) hurricanes and 4.0 (± 1.7) severe hurricanes (the figures in brackets indicate the error range) , the ACE was predicted by TSR to be 141 (± 58).
The forecast published on April 6th by Klotzbach's team included only minor changes. According to the April forecast, sixteen named storms could occur in the 2011 season, nine of which would develop into hurricanes and five of which would become Category 3 or higher hurricanes.
The Climate Prediction Center of NOAA announced on May 19 its pre-season forecast known. According to this, NOAA expects a probability of 70 percent with 12-18 named storms, including 6-10 hurricanes, of which three to six are likely to develop into severe hurricanes. The expected Accumulated Cyclone Energy (ACE) is estimated at 105–200 percent of the median for the years 1981–2010. The NOAA climatologists based the forecast on the continuation of the warm phase of the Atlantic Multi-Decade Oscillation (AMO), which began in 1995 , the continued high water surface temperatures in the tropical Atlantic Ocean and the Caribbean Sea, and the La Niña effect and the Assumption of the following normal phase of the El Niño-Southern Oscillation .
The Met Office (UKMO) released its forecast of a slightly above-average hurricane season on May 26, with 13 named storms and a 70 percent chance the number would be between 10 and 17. However, the Met Office does not make any distinctions in terms of intensity, so it did not provide a number for hurricanes and severe hurricanes. The institute predicted an ACE of 151 and that there was a 70 percent chance that the ACE would be between 89 and 212.
Storms
Tropical storm Arlene
| Tropical storm | |||
|---|---|---|---|
|
|||
| Duration | June 28th - July 1st | ||
| intensity | 55 kn (100 km / h ) (1 minute) , 993 hPa | ||
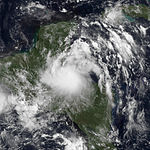
On the evening of June 28th (local time) the first tropical storm of the season formed in the Gulf of Mexico . It was moving at 11 km / h in a west-northwest direction towards the Mexican coast. Its central pressure was 1003 hectopascals and the wind speed in the center was around 65 km / h. The system later increased to up to 100 km / h before it reached mainland Mexico at Cabo Rojo between Tuxpan and Tampico on the morning of June 30 (local time) . In the evening (local time) of the same day, Arlene dissolved in the mountains of the Sierra Madre Oriental . According to the Mexican authorities, two people died in the central mountainous region of Mexico due to the heavy rains caused by the remaining low.
Tropical storm Bret
| Tropical storm | |||
|---|---|---|---|
|
|||
| Duration | July 17th - July 22nd | ||
| intensity | 60 kn (110 km / h ) (1 minute) , 995 hPa | ||
In mid-July, a cold front extended westward across the North Atlantic , the westernmost component of which was stationary near Florida. On July 16, a low pressure area developed along the weakening front north of the Bahamas , which organized itself better as the wind shear decreased. A closed circulation formed, so that the NHC reported the formation of the second tropical low pressure area of the season on July 17 at 21:00 UTC, when the center was about 160 km northwest of Great Abaco Island . It intensified into a tropical storm within three hours and was named Bret . The system moved little as Bret intensified and the thunderstorm activity increased around the center. The storm developed an eye-like feature on July 18 and developed its greatest strength with winds around 100 km / h before moving away in a northeast direction. Although strong wind shear and dry air masses hindered further development, Bret maintained a well-organized circulation and persistent thunderstorm activity in the two days that followed. However, the center broke away from the convection and so Bret weakened to a tropical depression on July 22nd. Despite very unfavorable conditions, Bret remained a tropical system for several hours, then dissolved about 600 km north of Bermuda .
Tropical storm Cindy
| Tropical storm | |||
|---|---|---|---|
|
|||
| Duration | July 20th - July 22nd | ||
| intensity | 60 kn (110 km / h ) (1 minute) , 994 hPa | ||
On July 19, the weather front that was involved in the formation of Tropical Storm Bret created an extensive low pressure area over the North Atlantic. The system moved rapidly eastwards and developed only minimal convection around its center of circulation, yet the NHC saw the potential for further tropical or subtropical development. The low intensified and appeared better defined, so after the convection resumed closer to the warm center of circulation, it was classified as Tropical Storm Cindy on July 20 at 9:00 p.m. UTC. The center was at this time 1065 km east-northeast of Bermuda . At the time of formation, the cyclone was in a strong south-westerly air current along the subtropical ridge, so a rapid, steady north-east migration was expected for most of the system's existence. Cindy intensified up to the peak with wind speeds of 110 km / h and a minimum central air pressure of 994 hPa. The train speed of the system increased, and a pronounced front in the northwest caused wind shear. The last warning was issued to Cindy late on July 22nd, as the system was disintegrating due to the strong wind shear. The remaining depth raced away to the northeast until it broke up in the southern area of the extra-tropical system.
Tropical storm Don
| Tropical storm | |||
|---|---|---|---|
|
|||
| Duration | July 27th - July 30th | ||
| intensity | 45 kn (85 km / h ) (1 minute) , 997 hPa | ||
The fourth tropical low pressure area of the season formed on July 27, 2011 north of the Yucatán peninsula in the Gulf of Mexico from a tropical wave that for a long time moved undeveloped through the Caribbean in a westerly direction. During their mission, Hurricane Hunters measured wind speeds of around 39 mph and 1001-mb central pressure, which is why the system was declared a tropical storm. The system was moving west-northwest toward the coast of the US state of Texas . A storm warning was issued immediately for the coastal areas.
Tropical storm Emily
| Tropical storm | |||
|---|---|---|---|
|
|||
| Duration | August 1st - August 7th | ||
| intensity | 45 kn (85 km / h ) (1 minute) , 1003 hPa | ||
A strong tropical wave moved across the open tropical Atlantic for several days in late July. However, the wave remained quite disorganized and lacked a well-defined circulation. The system slowly organized itself as it approached the Leeward Islands on July 31, where the storm caused severe weather conditions. Late on August 1, the Hurricane Hunters found a closed circuit during a reconnaissance flight. The system was then directly classified as Tropical Storm Emily by the National Hurricane Center shortly after the center of the storm crossed the Antilles arc.
The system continued to move towards Haiti, strengthening only slightly. However, when she arrived there on August 4th, it was still not well organized, so that Emily lost a lot of her strength while crossing the Haitian mainland and only moved as a so-called tropical wave towards Cuba. Nevertheless, the remaining low brought heavy rainfall to the west of the island of Hispaniola (Haiti, Dominican Republic) and the east of Cuba.
Two days later, the residual depression over the northern Bahamas Islands reactivated and was again classified as a tropical depression. The next day the system broke up again.
Tropical Storm Franklin
| Tropical storm | |||
|---|---|---|---|
|
|||
| Duration | August 12th - August 13th | ||
| intensity | 40 kn (75 km / h ) (1 minute) , 1004 hPa | ||
On August 10, an unorganized area with showers and thunderstorms formed off the east coast of Florida, which was connected to a long depression. The system slowly migrated northeast, the disturbance developing slowly; on the morning of August 12th, however, the chances of developing into a tropical system were still slim. During the following hours, however, the thunderstorm activity became noticeably organized in a zone around a well-defined low pressure area. As a result, the system was declared the sixth tropical depression of the season during the day and was located approximately 420 km north of Bermuda at the time .
The system maintained a northeast course and intensified early on August 13 after a large outbreak of convection at its center to Tropical Storm Franklin. In the morning Franklin reached its greatest strength with a constant wind speed of 75 km / h, but then encountered increasing wind shear and got over cooler water. A rapid breakdown in the structure of the storm followed as the conditions for a tropical system became increasingly unfavorable. The convection was displaced more than 150 km from the center of circulation and Franklin began to take on extra-tropical properties. Early on August 14th, Franklin completed the transition to an extra-tropical system in the North Atlantic, which is why the NHC published the final warning. The next day, the low west of Ireland disintegrated.
Tropical storm device
| Tropical storm | |||
|---|---|---|---|
|
|||
| Duration | August 13th - August 16th | ||
| intensity | 55 kn (100 km / h ) (1 minute) , 1000 hPa | ||
In the second week of August, there was a weak depression east of Bermuda . By August 13th, the low pressure area was very well defined. Therefore it was named Tropical Low Pressure Area Seven on the same day and was about 360 km south-southeast of Bermuda on that day. It quickly intensified and became Tropical Storm Gert. Gert was approaching Bermuda. At the same time, Gert reaches its peak with wind speeds of 100 km / h. Gert brought rain and wind of 40 km / h to the islands. On August 16, Gert weakened considerably and became an extratropical storm over the open Atlantic, where it soon dissolved.
Tropical Storm Harvey
| Tropical storm | |||
|---|---|---|---|
|
|||
| Duration | August 18 - August 22 | ||
| intensity | 55 kn (100 km / h ) (1 minute) , 994 hPa | ||
In mid-August, a tropical wave moving west hit the Caribbean. It eventually gained enough organization to be classified as Tropical Depression Eight on August 18th. On August 19, it was updated for Tropical Storm Harvey. Later on August 19, the storm intensified rapidly and it was announced that Harvey would become a hurricane just before landfall. However, on August 20, Harvey made landfall, but never at hurricane strength. Harvey was then downgraded to a depression and disbanded on August 22nd.
Hurricane Irene
| Category 3 hurricane | |||
|---|---|---|---|
|
|||
| Duration | August 20 - August 28 | ||
| intensity | 105 kn (195 km / h ) (1 minute) , 942 hPa | ||
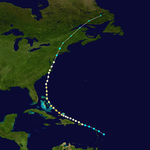
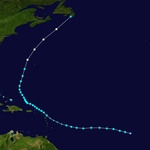
On the evening of August 20, a large depression was intense enough to be classified as Tropical Storm Irene. It moved over the Leeward Islands early on August 21st. Early on August 22nd, Irene intensified into a Category 1 hurricane with wind speeds of 120 km / h and a central pressure of 987 hPa . This made Irene the first hurricane of the season. Early on August 24th, Irene was promoted to a Category 3 hurricane with winds of 185 km / h. On August 27, Irene made landfall on the North Carolina coast as a Category 1 hurricane with winds of 140 km / h and unusually low air pressure. Hurricane Irene made a second US landfall in New Jersey at 5:35 a.m., making it the first hurricane to land in New Jersey in 108 years. On August 28, Irene was downgraded to a tropical storm and made around 9:00 am his third US landfall in Brooklyn, New York City . Irene experienced an extratropical storm over Québec , Canada on August 29th. As a result, it remained a mighty Iceland low for a few days , and disintegrated there around September 3rd.
Irene killed at least 56 people, and ten US states and Canada were affected. Irene was the twelfth costliest hurricane in history. It caused a loss of 10.1 billion US dollars.
Tropical Depression Ten
| Tropical depression | |||
|---|---|---|---|
|
|||
| Duration | August 25th - August 26th | ||
| intensity | 30 kn (55 km / h ) (1 minute) , 1006 hPa | ||
On August 21, a tropical wave left the west coast of Africa. Over the next four days, the tropical wave moved into the Atlantic and slowly strengthened. On August 25, it became Tropical Depression Ten in the eastern Atlantic. However, the low pressure area remained poorly organized and dissolved again one day later, on August 26th.
Tropical storm Jose
| Tropical storm | |||
|---|---|---|---|
|
|||
| Duration | August 28th - August 29th | ||
| intensity | 40 kn (75 km / h ) (1 minute) , 1006 hPa | ||
A tropical wave left the west coast of Africa on August 17th. For the first few days, the tropical wave created convection and it slowly moved west. But over the next week the wave turned into a weak depression. The depression was moving to the northwest at the time, while the intensity fluctuated somewhat. In the next few days the tropical wave approached Bermuda . But very early on August 28th and during the next few hours, the low pressure area intensified. A few hours later, the low pressure area west of Bermuda briefly intensified into a tropical storm. It was named Jose. Jose slowly began to move north-northeast. It took only 27 hours for Jose to disband on August 29th.
Hurricane Katia / Hurricane (ex-) Katia
| Category 4 hurricane | |||
|---|---|---|---|
|
|||
| Duration | August 29th - September 10th | ||
| intensity | 120 kn (220 km / h ) (1 minute) , 942 hPa | ||
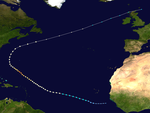
The eleventh named storm, Katia , of the season formed on August 29 south of the Cape Verde Islands and initially moved quickly westward across the tropical Atlantic. On August 30th, the system intensified to a tropical storm and was named Katia. On September 1st, Katia was upgraded to a hurricane. Due to the strong wind shear, the hurricane lost its force and was downgraded to a tropical storm during the day. On September 2, Katia intensified again into a hurricane.
Katia then took a northerly course and was eventually diverted to the northeast by an approaching trough. Katia lost its tropical characteristics and reached Europe on September 12th as a strong extra-tropical storm (Tief ex-Katia ). It reached hurricane strength again over the British Isles (up to 158 km / h). The storm caused £ 100 million damage in the UK and killed one person. Even in the Baltic states and Russia, the far-reaching low pressure area with gusts of 90 km / h still led to power outages on the 15th of the month before it disintegrated in the White Sea region on the 17th.
Unnamed tropical storm
| Tropical storm | |||
|---|---|---|---|
|
|||
| Duration | September 1st - September 2nd | ||
| intensity | 40 kn (75 km / h ) (1 minute) , 1002 hPa | ||
As part of their re-analysis of the hurricane season, the meteorologists at the National Hurricane Center classified a system that had formed about 370 km north of Bermuda on September 1 at 12:00 a.m. UTC. It arose from a tropical disturbance identified the day before, which was classified as a tropical depression with the beginning of September 1st. Although the system was embedded in an area with moderate wind shear, it quickly intensified into a tropical storm, but was not named because this intensification was not noticed during operations. The system reached its greatest intensity early on September 2nd with wind speeds of 75 km / h and changed over the course of the day to an extra-tropical system. This continued its migration in an east-northeast and later in an easterly direction, where it slowly weakened. At the beginning of September 4th, the remaining depth of the system disintegrated into a shallow surface trough.
Tropical Storm Lee
| Tropical storm | |||
|---|---|---|---|
|
|||
| Duration | September 1st - September 5th | ||
| intensity | 50 kn (95 km / h ) (1 minute) , 986 hPa | ||
In late August, a tropical wave produced scattered showers and thunderstorms in the western Caribbean Sea. The system was steadily moving west-northwest, and the wave began to organize as soon as it reached the southeastern Gulf of Mexico. Late on September 1, Hurricane Hunters discovered during a flight into the system that there was a closed ground-level circulation, which is why the system was declared Tropical Depression Thirteen on September 2 at 0:00 UTC. The depression moved northwest and was upgraded to Tropical Storm Lee during the day. Lee organized further and reached its highest sustained wind speeds of 95 km / h early on September 3rd when the center was just south of the Louisiana coast . On September 4 at 11:00 UTC, the center moved about 80 km southwest of Lavayette, Louisiana with sustained winds of about 70 km / h over land.
Heavy rainfalls generated by Lee resulted in flash floods and flooding in Parish of Iberia, Terrebone, Plaquemines, St. Bernard, St. Tammany, and Jefferson, Louisiana, and Counties of Hancock, Harrison, Jackson, and Stone, Mississippi. In New Orleans, for which Mayor Mitch Landrieu raised a disaster alert before the storm hit, he said between 250 and 320 mm of precipitation fell. The 24 pumping stations, which are to protect New Orleans, which is largely below sea level, from flooding remained fully functional, in contrast to 2005 when the failure of pumping stations during the passage of Hurricane Katrina resulted in parts of the city being flooded several meters high. In some flood-prone areas, oil production was halted as a precautionary measure, and numerous oil rigs in the Gulf of Mexico had been evacuated. The effects of the tropical storm caused the deaths of at least five people, including two people who burned to death in their trailer in Texas after the storm's foothills started a bushfire. As Lee passed through Louisiana, the storm quickly subsided, and early on September 5, the NHC issued its final warning. The remaining low moved slowly to the northeast and caused extreme rainfall over the next three days, which caused flooding in Pennsylvania , western New York and the Canadian provinces of Quebec and Ontario in particular .
Hurricane Maria
| Category 1 hurricane | |||
|---|---|---|---|
|
|||
| Duration | September 6th - September 16th | ||
| intensity | 70 kn (130 km / h ) (1 minute) , 983 hPa | ||
On September 5th, a low pressure area west of Africa organized itself . It became Tropical Depression Fourteen. On the morning of September 7th, it was upgraded to Tropical Storm Maria. In the tropical Atlantic, high wind shear hindered its development, and Maria almost dissolved before convection began and it rebuilt on September 9th. The next day, conditions became more favorable and the tropical cyclone became a Category 1 hurricane. On the afternoon of September 16, the storm lost its tropical characteristics off the coast of Newfoundland. He made landfall on the southern tip of the Avalon Peninsula. It caused heavy rain in the Newfoundland capital of Saint John’s .
Like Katia before, the low (ex-Maria) moved on to Europe, as a mighty low over Iceland and Scandinavia, and only disintegrated on the 25th of the month in the White Sea area.
Hurricane Nate
| Category 1 hurricane | |||
|---|---|---|---|
|
|||
| Duration | September 7th - September 11th | ||
| intensity | 65 kn (120 km / h ) (1 minute) , 994 hPa | ||
In the morning hours of September 6th, thunderstorms were assigned to a low pressure system that organized itself in the Bay of Campeche. The following day the system could be classified as a tropical storm and was named Nate. At a very slow train speed, Nate began to intensify. In the afternoon of September 8th, Nate reached a top wind speed of 120 km / h, so it was a weak Category 1 hurricane. Due to the cooler water, Nate began to weaken a little. On September 11th, Nate made landfall on the Mexican coast; as a weak tropical storm with a maximum wind speed of 65 km / h. Shortly after he made landfall, many of Nate's thunderstorms and rainbands quickly dissolved, so rainfall was not as high as previously thought.
Hurricane Ophelia
| Category 4 hurricane | |||
|---|---|---|---|
|
|||
| Duration | September 20th - October 3rd | ||
| intensity | 120 kn (220 km / h ) (1 minute) , 940 hPa | ||
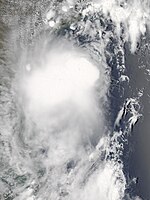
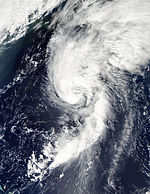
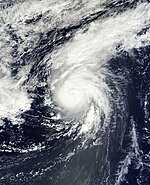
In early September there was a well-defined tropical wave off the African coast. The disturbance began to organize itself, making it the fifteenth tropical depression of the season on September 21. It quickly intensified into tropical storm Ophelia. Almost as soon as it turned into a tropical storm, vertical wind shear began and affected the system. Ophelia slowly strengthened in spite of the unfavorable conditions and reached wind speeds of 100 km / h on September 22nd. The system weakened briefly to a minimal tropical storm and briefly turned extratropical on September 25th. On September 27th, Ophelia developed again into a tropical low pressure area, reached wind speeds of 110 km / h on September 29th and became a strong tropical storm due to favorable conditions. The next day, Ophelia intensified into a Category 1 hurricane and later into a Category 2 hurricane with wind speeds of 165 km / h and an air pressure of 970 hPa . Ophelia intensified quickly and just 6 hours later was a severe Category 3 hurricane, the third of the season. Ophelia was thought to be weakening again, but on October 1, Ophelia unexpectedly became a Category 4 hurricane east of Bermuda. Ophelia was unable to intensify. On October 2nd, Ophelia was getting weaker and weaker, so that a day later it was just a tropical storm, moving over Newfoundland . On October 3, Ophelia became extratropical over Newfoundland. Like some of the lows of the previous season, ex-Ophelia also determined the weather in Europe (storms of up to 100 km / h and snowfall in Scotland), and only dissolved around 8 October over the polar sea east of Novaya Zemlya.
Ophelia was the strongest Atlantic hurricane of the 2011 season at 220 km / h and an air pressure of 940 hPa.
Hurricane Philippe
| Category 1 hurricane | |||
|---|---|---|---|
|
|||
| Duration | September 24th - October 9th | ||
| intensity | 80 kn (150 km / h ) (1 minute) , 976 hPa | ||
On September 23, a well-defined tropical wave was off the coast of Africa and exhibiting high thunderstorm activity. Moving towards the west and nestled in a favorable environment, the wave developed quickly. In the morning hours of September 24th, it was classified as a tropical depression while it was about 465 km south of the Cape Verde Islands . Later that day, the tropical depression was upgraded to a tropical storm and was named "Philippe". Philippe reached top speeds of 95 km / h the next day. The system moved in a west-northwest direction and weakened more and more, so that on September 28th it only had wind speeds of 65 km / h. But on October 1st, Philippe intensified and became a strong tropical storm with winds of 110 km / h. After Philippe was classified as a tropical storm for twelve days, it was briefly upgraded to category 1 hurricane on October 2, despite high wind shear. On October 6, Philippe strengthened again, becoming a strong Category 1 hurricane. On October 8, the hurricane weakened into a tropical storm. A few hours later, Philippe lost his tropical characteristics and became extratropical on October 9th. With a duration of 17 days, Philippe is the longest-lived hurricane since Bertha in July 2008, which had a trajectory similar to Philippe.
Hurricane Rina
| Category 3 hurricane | |||
|---|---|---|---|
|
|||
| Duration | October 23rd - October 28th | ||
| intensity | 100 kn (185 km / h ) (1 minute) , 966 hPa | ||
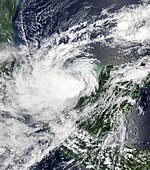
At the end of October, convection took place at the end of a cold front. When a depression formed, it began to move north-northwest and organize itself further. It was then upgraded to Tropical Depression Eighteen in the afternoon hours. The storm intensified and turned into Tropical Storm Rina on the evening of October 23rd. The storm rapidly intensified into a hurricane on October 24th. 100 people were killed by Rina in Central America due to flooding. 27 people who were on a ship are missing. After further strengthening, the system was upgraded to a Category 3 hurricane. However, increasing wind shear and dry air ensured that Rina first weakened into a Category 1 hurricane and then a tropical storm. On October 27, Rina made landfall on the east coast of Yucatán and moved directly over the city of Cancun . The next day, Rina weakened into a tropical wave on Yucatán Strait .
Tropical storm Sean
| Tropical storm | |||
|---|---|---|---|
|
|||
| Duration | November 8th - November 11th | ||
| intensity | 55 kn (100 km / h ) (1 minute) , 982 hPa | ||
In the first week of November, a nontropical low pressure area developed over southern North Carolina, which stretched out to the open Atlantic and, on its southeastern course, came across increasingly warmer water. The nontropical system, which had already reached storm strength southwest of Bermuda, slowly organized itself and was declared Subtropical Storm Sean on November 8 by the National Hurricane Center.
Shortly thereafter, the system began to take on tropical characteristics and was classified as a tropical storm three hours later. The storm first moved westwards, then hit a more northerly and finally northeastern trajectory. Sean reached his peak intensity on November 9th and 10th with winds of 100 km / h before encountering stronger wind shear.
Early on November 12th, Sean was absorbed a few hundred kilometers northeast of Bermuda by a cold front connected to an extra-tropical low pressure center over Newfoundland.
Accumulated Cyclone Energy (ACE)
| ACE (10 4 kt 2 ) - storm | ||||||||||
|---|---|---|---|---|---|---|---|---|---|---|
| 1 | 24.8 | Katia | 11 | 1.99 | Emily | |||||
| 2 | 20.3 | Irene | 12 | 1.85 | Device | |||||
| 3 | 18.4 | Ophelia | 13 | 1.71 | lee | |||||
| 4th | 14.8 | Philippe | 14th | 1.63 | Arlene | |||||
| 5 | 9.07 | Rina | 15th | 1.62 | Don | |||||
| 6th | 8.74 | Maria | 16 | 1.53 | Harvey | |||||
| 7th | 3.83 | Nate | 17th | 0.848 | unnamed | |||||
| 8th | 3.328 | Sean | 18th | 0.528 | Jose | |||||
| 9 | 2.945 | Bret | 19th | 0.283 | Franklin | |||||
| 10 | 2,313 | Cindy | Total: 121 | |||||||
The table opposite shows the ACE for every storm this year. The ACE describes the energy of a tropical storm by multiplying the strength of a storm with the duration, i.e. long-lasting storms as well as strong storms have a high ACE value. Traditionally, the NOAA only records storms with wind speeds of over 34 knots (63 km / h).
Season course

Storm names
During the 2011 Atlantic hurricane season, the following names were used. This list will be used again in 2017, with the exception of the name Irene, which was removed from the list of tropical cyclone names by the World Meteorological Organization in spring 2012 and replaced with Irma. This list is identical to the list for the 2005 Atlantic Hurricane Season , with the exception of the names Don, Katia, Rina, Sean, and Whitney, who have replaced Dennis , Katrina , Rita , Stan, and Wilma .
|
|
|
See also
- Pacific hurricane season 2011
- Pacific typhoon season 2011
- North Indian cyclone season 2011
- Cyclone seasons in the Southwest Indicator: 2010–2011 , 2011–2012
- Australian cyclone seasons: 2010–2011 , 2011–2012
- South Pacific Cyclone Seasons: 2010–2011 , 2011–2012
Web links
- National Hurricane Center website
- Season Archives of the National Hurricane Center (English)
- Time-lapse NOAA satellite film of the 2011 Atlantic hurricane season
Individual evidence
- ↑ a b Philip J. Klotzbach and William M. Gray: Extended Range Forecast of Atlantic Seasonal Hurricane Activity and US Landfall Strike Probability for 2009 ( English , PDF; 849 kB) Colorado State University. December 10, 2008. Retrieved January 15, 2009.
- ↑ a b Climate Prediction Center: BACKGROUND INFORMATION: THE NORTH ATLANTIC HURRICANE SEASON . National Oceanic and Atmospheric Administration. August 8, 2006. Archived from the original on November 15, 2010. Info: The archive link was inserted automatically and has not yet been checked. Please check the original and archive link according to the instructions and then remove this notice. Retrieved January 22, 2008.
- ↑ Mark Saunders / Adam Lea: Pre-Season Forecast for Atlantic Hurricane Activity in 2011 ( English , PDF; 612 kB) Tropical Storm Risk. May 24, 2011. Retrieved August 21, 2011.
- ↑ a b UK Met Office 2011 Atlantic tropical storm season forecast (English) . May 26, 2011. Retrieved August 21, 2011.
- ↑ Philip J. Klotzbach: Extended Range Forecast of Atlantic Seasonal Hurricane Activity and Landfall Strike Probability for 2011 ( English , PDF; 2.5 MB) Colorado State University. June 1, 2011. Retrieved August 21, 2011.
- ↑ Center for Ocean-Atmospheric Prediction Studies: 2011 FSU COAPS Atlantic Hurricane Season Forecast ( English ) Florida State University . Retrieved June 16, 2011.
- ↑ NOAA's Atlantic hurricane season update calls for increase in named storms ( English ) National Oceanic and Atmospheric Administration . Retrieved August 21, 2011.
- ↑ Philip J. Klotzbach / William M. Gray: Extended Range Forecast of Atlantic Seasonal Hurricane Activity and Landfall Strike Probability for 2011 ( English , PDF; 1.6 MB) Colorado State University . December 8, 2010. Retrieved April 21, 2011.
- ↑ Mark Saunders / Adam Lea: Extended Range Forecast for Atlantic Hurricane Activity in 2011 ( English , PDF) Tropical Storm Risk. December 6, 2010. Retrieved April 21, 2011.
- ↑ Philip J. Klotzbach / William M. Gray: Extended Range Forecast of Atlantic Seasonal Hurricane Activity and Landfall Strike Probability for 2011 ( English , PDF; 1.9 MB) Colorado State University. April 6, 2011. Retrieved April 21, 2011.
- ↑ Climate Prediction Center: NOAA 2011 Atlantic Hurricane Season Outlook ( English ) NOAA. May 19, 2011. Retrieved May 19, 2011.
- ↑ Tropical Storm ARLENE Special Advisory 1 , National Hurricane Center from June 28, 2011
- ↑ Tropical Storm ARLENE Advisory 7A , National Hurricane Center June 30, 2011
- ↑ Tropical Storm ARLENE Advisory 8 , National Hurricane Center June 30, 2011
- ↑ Tropical Storm ARLENE Advisory 10 , National Hurricane Center June 30, 2011
- ^ Tropical storm Arlene kills 2 in Mexico , CBC / Radio-Canada of July 1, 2011
- ^ Wallace, Patricia: Tropical Weather Discussion ( English ) National Hurricane Center . July 15, 2011. Retrieved July 17, 2011.
- ↑ Christensen, Eric: Tropical Weather Discussion ( English ) National Hurricane Center . July 15, 2011. Retrieved July 17, 2011.
- ^ Garcia, Felix: Tropical Weather Discussion ( English ) National Hurricane Center . July 15, 2011. Retrieved July 17, 2011.
- ^ Beven, Jack: Graphical Tropical Weather Outlook ( English ) National Hurricane Center . July 16, 2011. Retrieved July 17, 2011.
- ^ Pasch, Richard / Stewart, Stacy: Tropical Depression Two Discussion Number One ( English ) National Hurricane Center . July 17, 2011. Retrieved July 17, 2011.
- ^ Brown, Dan / Berg, Robbie: Tropical Storm Bret Advisory Number One A ( English ) National Hurricane Center . July 18, 2011. Retrieved July 18, 2011.
- ↑ Brennan, Michael: Tropical Storm Bret Advisory Number Three ( English ) National Hurricane Center . July 18, 2011. Retrieved July 22, 2011.
- ^ Pasch, Richard: Tropical Storm Bret Discussion Number Five ( English ) National Hurricane Center . July 18, 2011. Retrieved July 23, 2011.
- ^ Brennan, Michael: Tropical Storm Bret Discussion Number Seven ( English ) National Hurricane Center . July 19, 2011. Retrieved July 23, 2011.
- ^ Brennan, Michael: Tropical Storm Bret Discussion Number Nine ( English ) National Hurricane Center . July 19, 2011. Retrieved July 23, 2011.
- ^ Pasch, Richard: Tropical Depression Bret Discussion Number Eighteen ( English ) National Hurricane Center . July 22, 2011. Retrieved July 23, 2011.
- ^ Stewart, Stacy: Tropical Depression Bret Discussion Number Nineteen . National Hurricane Center . July 22, 2011. Retrieved July 23, 2011.
- ^ Beven, Jack: Post-Tropical Cyclone Bret ( English ) National Hurricane Center . July 22, 2011. Retrieved July 23, 2011.
- ^ Garcia, Felix: Tropical Weather Discussion . National Hurricane Center . July 19, 2011. Retrieved July 20, 2011.
- ^ Huffman, Marshall: Tropical Weather Discussion ( English ) National Hurricane Center . July 19, 2011. Retrieved July 20, 2011.
- ^ Formosa, Mike: Tropical Weather Discussion ( English ) National Hurricane Center . July 19, 2011. Retrieved July 20, 2011.
- ^ Beven, Jack: Tropical Storm Cindy Discussion Number One ( English ) National Hurricane Center . July 20, 2011. Retrieved July 20, 2011.
- ↑ TROPICAL STORM EMILY DISCUSSION NUMBER 11 , NHC of August 4, 2011
- ↑ REMNANTS OF EMILY DISCUSSION NUMBER 13 , NHC of August 4, 2011
- ↑ Cuba: Emily es ahora una onda tropical , Cubadebate of August 4, 2011
- ↑ Emily se disipa pero siguen las lluvias en el Oriente de Cuba , Cubadebate of August 5, 2011
- ↑ TROPICAL DEPRESSION EMILY ADVISORY NUMBER 14 ... CORRECTED , NHC of August 6, 2011
- ↑ Michael Brennan: Atlantic Tropical Weather Outlook ( English ) In: National Hurricane Center . National Oceanic and Atmospheric Administration. August 10, 2011. Retrieved August 17, 2011.
- ^ John Cangialosi and Stacy Stewart: Tropical Depression Six Discussion One ( English ) In: National Hurricane Center . National Oceanic and Atmospheric Administration. August 12, 2011. Retrieved August 17, 2011.
- ↑ Jack Beven: Tropical Weather Outlook ( English ) In: National Hurricane Center . National Oceanic and Atmospheric Administration. August 12, 2011. Archived from the original on August 12, 2011. Retrieved on August 17, 2011.
- ^ Stacy Stewart: Tropical Weather Outlook ( English ) In: National Hurricane Center . National Oceanic and Atmospheric Administration. August 12, 2011. Archived from the original on August 12, 2011. Retrieved on August 17, 2011.
- ^ John Cangialosi and Stacy Stewart: Tropical Depression Six Public Advisory One ( English ) In: National Hurricane Center . National Oceanic and Atmospheric Administration. August 12, 2011. Retrieved August 17, 2011.
- ↑ Eric Blake: Tropical Storm Franklin Discussion Three ( English ) In: National Hurricane Center . National Oceanic and Atmospheric Administration. August 13, 2011. Retrieved August 17, 2011.
- ^ Stacy Stewart: Tropical Storm Franklin Discussion Four ( English ) In: National Hurricane Center . National Oceanic and Atmospheric Administration. August 13, 2011. Retrieved August 17, 2011.
- ^ Stacy Stewart: Tropical Storm Franklin Discussion Five ( English ) In: National Hurricane Center . National Oceanic and Atmospheric Administration. August 13, 2011. Retrieved August 17, 2011.
- ↑ Jack Beven: Post-Tropical Cyclone Franklin Discussion Six ( English ) In: National Hurricane Center . National Oceanic and Atmospheric Administration. August 14, 2011. Retrieved August 17, 2011.
- ↑ DWD weather map forecast for August 15, 2011, 12:00 UTC , website of the Free University of Berlin, accessed on December 20, 2013
- ↑ DWD weather maps forecast for September 1 and 4, 2011, 12:00 UTC , website of the Free University of Berlin, accessed on December 20, 2013.
- ↑ → en: Hurricane Katia
- ↑ DWD weather map forecast for September 13, 2011, 12:00 UTC , website of the Free University of Berlin, accessed on December 20, 2013
- ↑ Hurricane runners shoot over Europe . Hurricane warning at Spiegel Online from September 11, 2011.
- ^ UK Met Office, "Post-tropical storm Katia - September 2011" . Retrieved September 22, 2011.
- ↑ Emily Allen: Damage from Hurricane Katia will cost UK £ 100M after high winds battered Britain . In: Daily Mail , September 14, 2011.
- ^ Northern Echo, "Driver dies as gales batter region" . Retrieved September 12, 2011.
- ^ Gales Leave 900 Households Blacked Out . err.ee. Retrieved February 9, 2012.
- ↑ Российское информационное агентство: Петербург оправляется от урагана: повалены десятки деревлено . nr2.ru. September 15, 2011. Retrieved September 17, 2011.
- ↑ Ослабевший ураган "Катя" добрался до Санкт-Петербурга . km.ru. September 15, 2011. Retrieved September 17, 2011.
- ↑ a b DWD weather map forecast for September 15, 2011, 12:00 UTC , website of the Free University of Berlin, accessed on December 20, 2013
- ↑ a b ex-Katia over Northern Russia and parallel ex-Maria over Iceland; DWD weather maps forecast for 17th and DWD weather map September 19, 2011, 12:00 UTC , FU Berlin, accessed on December 20, 2013.
- ↑ Eric Blake, Todd Kimberlain: Unnamed Tropical Storm Tropical Cyclone Report ( English , PDF ; 579 kB) National Hurricane Center. December 2011. Retrieved December 6, 2011.
- ^ Richard Pasch: Tropical Weather Outlook ( English ) In: National Hurricane Center . Retrieved August 30, 2011.
- ^ Daniel Brown, Lixion Avila: Tropical Depression Thirteen Special Advisory # 1 ( English ) In: National Hurricane Center . Retrieved September 2, 2011.
- ↑ Stacy R. Stewart: Tropical Storm Lee Intermediate Advisory # 4A ( English ) In: National Hurricane Center . Retrieved September 2, 2011.
- ↑ Storm Lee makes landfall in Louisiana ( English ) In: The Sydney Morning Herald . Retrieved September 4, 2011.
- ↑ CNN Wire Staff: Officials: Mother, child dead after winds from Lee stoke Texas fires (English) , CNN. September 5, 2011.
- ↑ A weakened Lee still poses flood threat in South (English) , USA Today . September 5, 2011.
- ↑ Michael Brennan: Tropical Depression LEE ( English ) National Hurricane Center . September 4, 2011. Retrieved November 1, 2011.
- ↑ Tropical Storm Lee remnants drench East Coast (English) . In: CNN , September 8, 2011.
- ↑ DWD weather map forecast for September 26, 2011, 12:00 UTC , website of the Free University of Berlin, accessed on December 20, 2013
- ^ Snow and high winds forecast as hurricane and Arctic air combine to blast Scotland . In: The Daily Record , October 6, 2011. Retrieved June 10, 2013.
- ↑ [1]
- ↑ [2]
- ↑ Eric Blake: Subtropical Storm Sean Forecast Discussion Number 2 ( English ) National Hurricane Center . November 8, 2011. Retrieved November 8, 2011.
- ↑ Eric Blake: Tropical Storm Sean Public Advisory Number 2A ( English ) National Hurricane Center . November 8, 2011. Retrieved November 8, 2011.
- ↑ [3]


