The list of the largest agricultural producers gives an overview of the largest producers of various agricultural goods at the last determinable point in time. The five largest producers are given as well as the total global production volume. However, the gaps between the individual producers are not reflected. So are z. For example, only two countries are responsible for half of the world's rice production: India and the People's Republic of China .
The agricultural production goods are divided into the categories of grain , vegetables , fruits , dairy products , beverages, spices , meat, nuts , colors and fabrics, forest products and others. All data come from the Food and Agriculture Organization of the United Nations .
Agricultural products by volume of production Most frequently produced agricultural goods by production volume in tons (as of 2017).
Most frequently produced agricultural goods (2017)
rank
product
category
World production in t
1
Sugar cane
vegetables
1,841,528,386
2
Corn
Grain
1,134,746,667
3
wheat
Grain
771.718.579
4th
rice
Grain
769.657.791
5
Cow's milk
Dairy product
675.621.019
6th
potato
vegetables
388.190.674
7th
Soybean
vegetables
352,643,548
8th
sugar beet
vegetables
301.015.696
9
manioc
vegetables
291,992,646
10
tomato
fruit
182,301,395
11
Beer , barley *
beverages
180.332.523
12
Sugar , raw *
fruit
147,404,262
13
barley
Grain
147,404,262
14th
Buffalo milk
Dairy product
120.353.705
15th
pig
flesh
119,886,758
16
Watermelon
fruit
118.413.465
17th
banana
fruit
113,918,763
18th
sweet potato
vegetables
112.835.316
19th
Domestic chicken
flesh
109.056.179
20th
onion
vegetables
97,862,928
* Figure from 2014
Countries by production (food)
Grain All information is based on data from FAOSTAT (Food and Agriculture Organization) of the United Nations (as of 2017):
Grain
1st producer
2nd producer
3rd producer
4. Producer
5. Producer
World production in t
Corn
United States United States
China People's Republic People's Republic of China
Brazil Brazil
Argentina Argentina
India India
1,134,746,667
wheat
China People's Republic People's Republic of China
India India
Russia Russia
United States United States
France France
771.718.579
rice
China People's Republic People's Republic of China
India India
Indonesia Indonesia
Bangladesh Bangladesh
Vietnam Vietnam
769.657.791
barley
Russia Russia
Australia Australia
Germany Germany
France France
Ukraine Ukraine
147,404,262
Sorghum (millet)
United States United States
Nigeria Nigeria
Sudan Sudan
Mexico Mexico
Ethiopia Ethiopia
57,601,588
Millet (millet)
India India
Niger Niger
China People's Republic People's Republic of China
Mali Mali
Nigeria Nigeria
28,459,020
oats
Russia Russia
Canada Canada
Australia Australia
Poland Poland
China People's Republic People's Republic of China
25,949,161
Triticale
Poland Poland
Germany Germany
Belarus Belarus
France France
China People's Republic People's Republic of China
15,563,415
rye
Germany Germany
Poland Poland
Russia Russia
China People's Republic People's Republic of China
Denmark Denmark
13,733,945
Green corn
United States United States
Mexico Mexico
Croatia Croatia
Nigeria Nigeria
Indonesia Indonesia
11,727,318
vegetables
All information is based on data from FAOSTAT (Food and Agriculture Organization) of the United Nations (as of 2016):
vegetables
1st producer
2nd producer
3rd producer
4. Producer
5. Producer
World production in t
Sugar cane
Brazil Brazil
India India
China People's Republic People's Republic of China
Thailand Thailand
Pakistan Pakistan
1,890,661,752
potato
China People's Republic People's Republic of China
India India
Russia Russia
Ukraine Ukraine
United States United States
376.826.967
Soybean
United States United States
Brazil Brazil
Argentina Argentina
India India
China People's Republic People's Republic of China
334.894.085
manioc
Nigeria Nigeria
Thailand Thailand
Brazil Brazil
Indonesia Indonesia
Congo Democratic Republic DR Congo
277.102.568
sweet potato
China People's Republic People's Republic of China
Nigeria Nigeria
Tanzania Tanzania
Indonesia Indonesia
Uganda Uganda
105.190.500
onion
China People's Republic People's Republic of China
India India
Egypt Egypt
United States United States
Iran Iran
93.168.548
cucumber
China People's Republic People's Republic of China
Russia Russia
Turkey Turkey
Iran Iran
Ukraine Ukraine
80,616,694
White cabbage and other types of head cabbage
China People's Republic People's Republic of China
India India
Russia Russia
Korea South South Korea
Ukraine Ukraine
71.259.199
Rapeseed
Canada Canada
China People's Republic People's Republic of China
India India
France France
Germany Germany
68.855.446
Yams
Nigeria Nigeria
Ghana Ghana
Ivory Coast Ivory Coast
Benin Benin
Togo Togo
65,937,599
aubergine
China People's Republic People's Republic of China
India India
Egypt Egypt
Turkey Turkey
Iran Iran
51.288.169
Carrot and turnip
China People's Republic People's Republic of China
Uzbekistan Uzbekistan
Russia Russia
United States United States
Ukraine Ukraine
42,711,830
Bean
Myanmar Myanmar
India India
Brazil Brazil
United States United States
Tanzania Tanzania
26,833,394
Garden salad and common chicory
China People's Republic People's Republic of China
United States United States
India India
Spain Spain
Italy Italy
26,779,564
spinach
China People's Republic People's Republic of China
United States United States
Japan Japan
Turkey Turkey
Indonesia Indonesia
26,684,493
Pumpkins
China People's Republic People's Republic of China
India India
Russia Russia
Ukraine Ukraine
United States United States
26,486,616
Cauliflower and broccoli
China People's Republic People's Republic of China
United States United States
India India
Spain Spain
Mexico Mexico
25.233.723
Kidney bean
China People's Republic People's Republic of China
Indonesia Indonesia
India India
Turkey Turkey
Thailand Thailand
23,595,714
Dry pea
Canada Canada
Russia Russia
China People's Republic People's Republic of China
India India
United States United States
14,363,097
chick-pea
India India
Australia Australia
Myanmar Myanmar
Ethiopia Ethiopia
Turkey Turkey
12.092.950
okra
India India
Nigeria Nigeria
Sudan Sudan
Mali Mali
Pakistan Pakistan
8,900,434
sesame
Tanzania Tanzania
Myanmar Myanmar
India India
China People's Republic People's Republic of China
Sudan Sudan
6,111,548
Green pea
Canada Canada
India India
Turkey Turkey
Australia Australia
Nepal Nepal
4,826,726
Legumes (without peas)
India India
Poland Poland
Mozambique Mozambique
United Kingdom United Kingdom
Pakistan Pakistan
3,965,503
Sweet peas
Ethiopia Ethiopia
Russia Russia
Mexico Mexico
Spain Spain
Belarus Belarus
838,868
Safflower
Russia Russia
Kazakhstan Kazakhstan
Mexico Mexico
United States United States
Turkey Turkey
718.161
fruit
All information is based on data from FAOSTAT (Food and Agriculture Organization) of the United Nations (as of 2015-2016):
fruit
1st producer
2nd producer
3rd producer
4. Producer
5. Producer
World production in t
tomato
China People's Republic People's Republic of China
India India
United States United States
Turkey Turkey
Egypt Egypt
177.042.359
Watermelon
China People's Republic People's Republic of China
Turkey Turkey
Iran Iran
Brazil Brazil
Uzbekistan Uzbekistan
117.022.560
banana
India India
China People's Republic People's Republic of China
Indonesia Indonesia
Brazil Brazil
Ecuador Ecuador
113.280.302
Apple
China People's Republic People's Republic of China
United States United States
Poland Poland
Turkey Turkey
India India
89.329.179
Grape
China People's Republic People's Republic of China
Italy Italy
United States United States
France France
Spain Spain
77,438,929
orange
Brazil Brazil
China People's Republic People's Republic of China
India India
United States United States
Mexico Mexico
73.187.571
coconut
Indonesia Indonesia
Philippines Philippines
India India
Brazil Brazil
Sri Lanka Sri Lanka
59.010.635
Mango , mangosteen , guava
India India
China People's Republic People's Republic of China
Thailand Thailand
Indonesia Indonesia
Mexico Mexico
46,508,697
tangerine
China People's Republic People's Republic of China
Spain Spain
Turkey Turkey
Morocco Morocco
Egypt Egypt
27,465,813
pear
China People's Republic People's Republic of China
Argentina Argentina
United States United States
Italy Italy
Turkey Turkey
27.345.930
pineapple
Costa Rica Costa Rica
Brazil Brazil
Philippines Philippines
India India
Thailand Thailand
25,809,038
Peach and nectarine
China People's Republic People's Republic of China
Spain Spain
Italy Italy
United States United States
Iran Iran
24,975,649
olive
Spain Spain
Greece Greece
Italy Italy
Turkey Turkey
Morocco Morocco
19,267,493
lemon
India India
Mexico Mexico
China People's Republic People's Republic of China
Argentina Argentina
Brazil Brazil
17,347,154
papaya
India India
Brazil Brazil
Mexico Mexico
Indonesia Indonesia
Dominican Republic Dominican Republic
13,050,749
plum
China People's Republic People's Republic of China
Romania Romania
Serbia Serbia
United States United States
Turkey Turkey
12,050,800
Garden strawberry
China People's Republic People's Republic of China
United States United States
Mexico Mexico
Egypt Egypt
Turkey Turkey
9,118,336
Grapefruit
China People's Republic People's Republic of China
United States United States
Vietnam Vietnam
Mexico Mexico
India India
9,074,174
date
Egypt Egypt
Iran Iran
Saudi Arabia Saudi Arabia
Algeria Algeria
United Arab Emirates UAE
8,460,443
avocado
Mexico Mexico
Dominican Republic Dominican Republic
Peru Peru
Colombia Colombia
Indonesia Indonesia
5,567,044
Kiwi fruit
China People's Republic People's Republic of China
Italy Italy
New Zealand New Zealand
Iran Iran
Chile Chile
4,274,870
apricot
Turkey Turkey
Uzbekistan Uzbekistan
Iran Iran
Algeria Algeria
Italy Italy
3,881,204
cherry
Turkey Turkey
United States United States
Iran Iran
Chile Chile
Uzbekistan Uzbekistan
2,317,956
Real fig
Turkey Turkey
Egypt Egypt
Algeria Algeria
Iran Iran
Morocco Morocco
1,050,459
raspberry
Russia Russia
United States United States
Poland Poland
Mexico Mexico
Serbia Serbia
795.249
quince
Uzbekistan Uzbekistan
Turkey Turkey
China People's Republic People's Republic of China
Iran Iran
Morocco Morocco
677.949
Currants
Russia Russia
Poland Poland
Ukraine Ukraine
Germany Germany
United Kingdom United Kingdom
655.030
Blueberry
United States United States
Canada Canada
Mexico Mexico
Poland Poland
Germany Germany
552.505
Gooseberry
Germany Germany
Russia Russia
Poland Poland
Ukraine Ukraine
United Kingdom United Kingdom
174,309
Dairy products All information is based on data from FAOSTAT (Food and Agriculture Organization) of the United Nations (as of 2016):
beverages
All information is based on data from FAOSTAT (Food and Agriculture Organization) of the United Nations (as of 2013):
flesh All information is based on data from FAOSTAT (Food and Agriculture Organization) of the United Nations (as of 2013):
flesh
1st producer
2nd producer
3rd producer
4. Producer
5. Producer
World production in t
pig
China People's Republic People's Republic of China
United States United States
Germany Germany
Spain Spain
Vietnam Vietnam
112.333.009
chicken
Brazil Brazil
United States United States
China People's Republic People's Republic of China
Russia Russia
Mexico Mexico
97.600.396
Beef
Brazil Brazil
United States United States
China People's Republic People's Republic of China
Argentina Argentina
Australia Australia
68,445,478
sheep
China People's Republic People's Republic of China
Australia Australia
New Zealand New Zealand
Turkey Turkey
United Kingdom United Kingdom
8,213,621
Turkey
United States United States
Brazil Brazil
Germany Germany
France France
Italy Italy
5,651,405
goat
China People's Republic People's Republic of China
India India
Pakistan Pakistan
Nigeria Nigeria
Bangladesh Bangladesh
5,211,336
duck
China People's Republic People's Republic of China
France France
Malaysia Malaysia
Myanmar Myanmar
Vietnam Vietnam
4,367,273
goose
China People's Republic People's Republic of China
Poland Poland
Hungary Hungary
Egypt Egypt
Taiwan Taiwan
2,698,322
Rabbits
China People's Republic People's Republic of China
Korea South South Korea
Spain Spain
Egypt Egypt
Italy Italy
1,339,793
horse
China People's Republic People's Republic of China
Kazakhstan Kazakhstan
Mexico Mexico
Russia Russia
Mongolia Mongolia
785.185
nuts
All information is based on data from FAOSTAT (Food and Agriculture Organization) of the United Nations (as of 2016):
nut
1st producer
2nd producer
3rd producer
4. Producer
5. Producer
World production in t
peanut
China People's Republic People's Republic of China
India India
Nigeria Nigeria
United States United States
Sudan Sudan
43,982,063
Cashew
Vietnam Vietnam
Nigeria Nigeria
India India
Ivory Coast Ivory Coast
Philippines Philippines
4,898,210
walnut
China People's Republic People's Republic of China
United States United States
Iran Iran
Turkey Turkey
Mexico Mexico
3,747,549
almond
United States United States
Spain Spain
Iran Iran
Morocco Morocco
Syria Syria
3,214,303
Chestnuts
China People's Republic People's Republic of China
Bolivia Bolivia
Turkey Turkey
Korea South South Korea
Italy Italy
2,261,589
pistachio
United States United States
Iran Iran
Turkey Turkey
China People's Republic People's Republic of China
Syria Syria
1,057,566
hazelnut
Turkey Turkey
Italy Italy
United States United States
Azerbaijan Azerbaijan
Georgia Georgia
743.455
Shea
Nigeria Nigeria
Mali Mali
Burkina Faso Burkina Faso
k. A.
k. A.
k. A.
Spices
All information is based on data from FAOSTAT (Food and Agriculture Organization) of the United Nations (as of 2016):
seasoning
1st producer
2nd producer
3rd producer
4. Producer
5. Producer
World production in t
Chilli and green pepper
China People's Republic People's Republic of China
Mexico Mexico
Turkey Turkey
Indonesia Indonesia
Spain Spain
34,497,462
garlic
China People's Republic People's Republic of China
India India
Bangladesh Bangladesh
Egypt Egypt
Korea South South Korea
26,573,001
ginger
India India
Nigeria Nigeria
China People's Republic People's Republic of China
Indonesia Indonesia
Nepal Nepal
3,270,762
Anise , fennel and coriander
India India
Russia Russia
Mexico Mexico
Iran Iran
China People's Republic People's Republic of China
1,185,380
saffron
Iran Iran
k. A.
k. A.
k. A.
k. A.
948,516
mustard
Canada Canada
Nepal Nepal
Russia Russia
Myanmar Myanmar
United States United States
699.038
Black pepper
Vietnam Vietnam
Indonesia Indonesia
India India
Brazil Brazil
China People's Republic People's Republic of China
546.259
cinnamon
Indonesia Indonesia
China People's Republic People's Republic of China
Vietnam Vietnam
Sri Lanka Sri Lanka
Madagascar Madagascar
223,574
Cloves
Indonesia Indonesia
Madagascar Madagascar
Tanzania Tanzania
Sri Lanka Sri Lanka
Comoros Comoros
180,520
nutmeg
India India
Guatemala Guatemala
Indonesia Indonesia
Nepal Nepal
Laos Laos
122.151
peppermint
Morocco Morocco
Argentina Argentina
Mexico Mexico
Bulgaria Bulgaria
Spain Spain
106.252
vanilla
Madagascar Madagascar
Indonesia Indonesia
China People's Republic People's Republic of China
Mexico Mexico
Papua New Guinea Papua New Guinea
7,940
Others All information is based on data from FAOSTAT (Food and Agriculture Organization) of the United Nations (as of 2016).
Countries by production (non-food)
Fibers and fabrics All information is based on data from FAOSTAT (Food and Agriculture Organization) of the United Nations (as of 2013):
Forest products All information is based on data from FAOSTAT (Food and Agriculture Organization) of the United Nations (as of 2013):
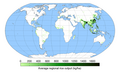
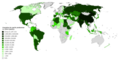
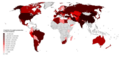
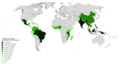
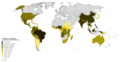
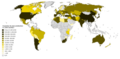
cards
Wheat production worldwide
Corn production worldwide
Rice production worldwide
Countries by Garlic Production
Countries by onion production
Countries by potato production
Countries by apple production
Countries after cherry production
Countries by coconut production
Countries by grape production
Countries by pineapple production
Countries by pear production
Countries by plum production
Tomato production worldwide
See also Individual evidence
↑ Crops, Crops processed, and Livestock Primary. FAO production statistics for 2017. fao.org, accessed on March 4, 2019 .
↑ a b c d e Crops. FAO production statistics for 2017. fao.org, accessed on March 4, 2019 .
↑ Data> Livestock Processed.
↑ [1]
↑ [2]
↑ FAOSTAT English ) FAO. Retrieved July 26, 2019.
↑ http://faostat3.fao.org/browse/rankings/countries_by_commodity/E
↑ http://faostat3.fao.org/browse/Q/QL/E
↑ [3]
<img src="https://de.wikipedia.org//de.wikipedia.org/wiki/Special:CentralAutoLogin/start?type=1x1" alt="" title="" width="1" height="1" style="border: none; position: absolute;">