
MLB 2016
|
|
|
|---|---|
| season | 2016 |
| Period | April 3 - October 2, 2016 |
| Regular season | |
| Season MVP AL | Mike Trout ( LAA ) |
| Season MVP NL | Kris Bryant ( CHC ) |
| Postseason | |
| AL Champion | Cleveland Indians |
| Second AL | Toronto Blue Jays |
| NL champion | Chicago Cubs |
| Second NL | Los Angeles Dodgers |
| World Series | |
| champion | Chicago Cubs |
| MVP | Ben Zobrist ( CHC ) |
| Playing times | |
|
◄ 2015 2017 ► |
|
The 2016 MLB season , the 115th season of Major League Baseball , opened on April 3, 2016 with the opening game between the St. Louis Cardinals and the Pittsburgh Pirates at PNC Park in Pittsburgh .
During the regular season , 30 teams fought in 162 games each for a place in the play-offs. Each team played 76 games against teams in its own division, 66 against teams from other divisions of the League, as well as 20 interleague games. According to the schedule, the regular season ended on October 2, 2016.
The MLB All-Star Game 2016 took place on July 12, 2016 at PETCO Park , the stadium of the San Diego Padres in San Diego . The American League beat the National League 4-2 runs and thus earned home rights for the 2016 World Series .
The MLB Draft 2016 took place from June 9th to 11th, 2016. The Philadelphia Phillies had the first choice and decided on the outfielder Mickey Moniak, who was born in Encinitas in 1998.
The 2015 World Series winners and thus the defending champions are the Kansas City Royals .
Participating teams
For the 2016 season, the MLB did not make any changes to the participating franchises or league and division assignments.
American League venues. Divisions: |
_relief_location_map.png)
National League venues. Divisions: |
* Sorted according to the previous year's placements in the respective divisions. The teams that qualified for the postseason in the previous year are colored green .
Spring training
From March 1st to April 2nd the season preparation of the MLB, the so-called Spring Training, took place. Here, the teams in the Grapefruit League and the Cactus League tested new players, but also had their desired core formations imported. In contrast to the regular season, games in spring training can also end in a draw and do not appear in the league tables; this was the case in 39 games in 2016. The most successful team in preparation after victories were the Arizona Diamondbacks with 24. The Washington Nationals achieved the best win rate with 82.6%.
Spring Training 2016 tables
The teams marked in blue in the tables of the Cactus and Grapefruit League are members of the National League, those marked in red play in the American League.
| Item | team | W. | L. | % | GB |
|---|---|---|---|---|---|
| 1 |
|
24 | 8th | 75 | - |
| 2 |
|
19th | 8th | 70.4 | |
| 3 | Cleveland Indians | 18th | 12 | 60 | 5 |
| 4th |
|
17th | 13 | 56.7 | 6th |
| 5 |
|
15th | 13 | 53.6 | 7th |
| 6th |
|
16 | 14th | 53.3 | 7th |
| 7th |
|
17th | 15th | 53.1 | 7th |
| 8th |
|
16 | 16 | 50 | 8th |
| 9 |
|
14th | 14th | 50 | 8th |
| 10 |
|
13 | 17th | 43.3 | 10 |
| 11 |
|
12 | 17th | 41.4 | 10.5 |
| 12 |
|
14th | 21st | 40 | 11.5 |
| 13 |
|
13 | 20th | 39.4 | 11.5 |
| 14th |
|
11 | 19th | 36.7 | 12 |
| 15th |
|
10 | 21st | 32.3 | 13.5 |
| Item | team | W. | L. | % | GB |
|---|---|---|---|---|---|
| 1 |
|
19th | 4th | 82.6 | - |
| 2 |
|
17th | 8th | 68 | 3 |
| 3 |
|
19th | 11 | 63.3 | 3.5 |
| 4th |
|
18th | 11 | 62.1 | 4th |
| 5 |
|
18th | 11 | 62.1 | 4th |
| 6th |
|
15th | 11 | 57.7 | 5.5 |
| 7th |
|
12 | 13 | 48 | 8th |
| 8th |
|
14th | 16 | 46.7 | 8.5 |
| 9 | St. Louis Cardinals | 11 | 13 | 45.8 | 8.5 |
| 10 | Baltimore Orioles | 12 | 15th | 44.4 | 9 |
| 11 |
|
11 | 14th | 44 | 9 |
| 12 | Boston Red Sox | 14th | 18th | 43.8 | 9.5 |
| 13 |
|
8th | 17th | 32 | 12 |
| 14th |
|
8th | 21st | 27.6 | 14th |
| 15th |
|
6th | 20th | 23.1 | 14.5 |
W = Wins (victories), L = Loss (defeats),% = Winning Percentage , GB = Games Behind (behind leaders: number of necessary defeats for the leader while simultaneously winning)
Regular season
Brief explanation of game operations and table structure
The AL and NL are each divided into three divisions for game operations. The allocation is based on regional criteria: East, Central and West Division. The game will run from April 3 to October 2, 2016.
The table positions are responsible for reaching the postseason : The three respective division winners and the two other best teams according to the winning percentage will play the championship in the American and National League in three rounds. The respective champions then meet in the World Series.
The ranking of the teams in the table results during the season from the current ratio of wins to games overall as the so-called winning percentage . The reason for this is the uneven distribution of the games over the calendar, so that some teams have played three or more games more than others. For example, the balance of team A with 15 wins and 15 defeats (.500 expressed as the corresponding percentage) is considered to be exactly equivalent to the balance of team B, which achieved 16 wins and 16 defeats at the same time. However, this is irrelevant for the final tables, since at the end of the season all teams had played the 162 season games that have been common since 1961. Therefore, it is sufficient to state wins and defeats (draws are not common).
With the indication GB ( Games Behind ) it is documented how big the gap between a chaser and the first in the table is. This expresses how many victories the pursuer would theoretically need with simultaneous defeat of the leader in order to achieve a tie. The specification GB is expressed to 0.5 games: For example, if team A has ten wins and five defeats, but team B nine wins and five defeats, a win of its own (without a defeat by A) would lead to a tie.

Season course of the regular season
American League
April
The most successful team in the American League in April were the Chicago White Sox , who performed particularly well on the road and won 11 of their 16 games in foreign ball parks. Pitcher Chris Sale achieved 5 wins . Defending champions Kansas City got off to a good start into the new season, but went out of shape towards the end of the month and lost five games in a row in the last week of April, and was swept away by the Los Angeles Angels of Anaheim . The season also began disappointingly for the Houston Astros , who were able to reach the League Division Series in the preseason but only recorded 7 wins in 24 games in April 2016.
One of the most noticeable players of the opening month was Dominican second baseman Robinson Canó , who scored 8 home runs and 24 RBI for his Seattle Mariners .
As of April 30, 2016, the following table constellations in the American League resulted:
| East Division | ||||||
| PS | franchise | W. | L. | % | GB | |
|---|---|---|---|---|---|---|
| 2 | Baltimore Orioles | 14th | 9 | 60.9 | - | |
| WC | Boston Red Sox | 14th | 10 | 58.3 | ½ | |
| Tampa Bay Rays | 11 | 12 | 47.8 | 2 | ||
| Toronto Blue Jays | 11 | 14th | 44.0 | 3 | ||
| New York Yankees | 8th | 14th | 36.4 | 5½ | ||
| Central Division | ||||||
| PS | franchise | W. | L. | % | GB | |
|---|---|---|---|---|---|---|
| 1 | Chicago White Sox | 17th | 8th | 68.0 | - | |
| WC | Detroit Tigers | 13 | 10 | 56.5 | 3 | |
| Kansas City Royals | 12 | 11 | 52.2 | 4th | ||
| Cleveland Indians | 10 | 11 | 47.6 | 5 | ||
| Minnesota Twins | 7th | 17th | 29.2 | 9½ | ||
| West Division | ||||||
| PS | franchise | W. | L. | % | GB | |
|---|---|---|---|---|---|---|
| 3 | Texas Rangers | 14th | 10 | 58.3 | - | |
| WC | Seattle Mariners | 13 | 10 | 56.5 | ½ | |
| Oakland Athletics | 13 | 12 | 52.0 | 1½ | ||
| Los Angeles Angels of Anaheim | 11 | 13 | 45.8 | 3 | ||
| Houston Astros | 7th | 17th | 29.2 | 7th | ||
PS = postseason; Number = Rank on the seed list or WC = Wild Card (best two teams after the division winners)
W = Wins (victories), L = Losses (defeats),% = Winning Percentage , GB = Games Behind (behind leaders: number of necessary Defeats of the leader with simultaneous own victory)
May
- Special jerseys in May, using the example of the Orioles

for Mother's Day on May 8th in pink
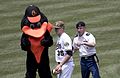
for Memorial Day on May 30th camouflage colors


The White Sox, still so successful in April, disappointed in May with a victory rate of only 39% and slipped to second place in the Central Division behind defending champions Kansas City. The Royals had been four games behind the White Sox at the end of April. The Detroit Tigers also weakened and lost two positions as they also only won 39% of the games in the current month. However, three of the Tigers' players were able to achieve significant career milestones in just one month. Miguel Cabrera made his 500th double, pitcher Justin Verlander made his 2,000th strikeout and Francisco Rodríguez secured his 400th career save .
The new leader of the East Division, the Boston Red Sox, developed into the now most successful team of the AL in May, winning over 64% of the games in May and displacing the Orioles from first place in the division. On the offensive, Xander Bogaerts with 49 hits and five home runs and Jackie Bradley Jr. , who contributed 37 hits and even eight home runs, were particularly convincing at the Red Sox . The Tampa Bay Rays lost to the top of the division in May and are already nine games behind the Red Sox, down from just 1½ games at the end of April.
At the head of the West Division, the Texas Rangers and the Seattle Mariners are still almost level. In May both teams won 17 games in 11 defeats and were able to break away from the competition. The Oakland Athletics, just one game behind the Mariners at the end of April, played a weaker month and slipped to the bottom of the division. A positive mentioning of the A's in May was the performance of starter Rich Hill , who was one of the best pitchers of the month with 5 wins and an ERA of 2.13.
As of May 31, 2016, the following table constellations in the American League resulted:
| East Division | |||||||
| PS | franchise | W. | L. | % | GB | ||
|---|---|---|---|---|---|---|---|
| ▲ | 1 | Boston Red Sox | 32 | 20th | 61.5 | - | |
| ▼ | WC | Baltimore Orioles | 28 | 22nd | 56.0 | 3 | |
| ▲ | Toronto Blue Jays | 28 | 26th | 51.9 | 5 | ||
| ▲ | New York Yankees | 24 | 27 | 47.1 | 7½ | ||
| ▼ | Tampa Bay Rays | 22nd | 28 | 44.0 | 9 | ||
| Central Division | |||||||
| PS | franchise | W. | L. | % | GB | ||
|---|---|---|---|---|---|---|---|
| ▲ | 3 | Kansas City Royals | 29 | 22nd | 56.9 | - | |
| ▼ | Chicago White Sox | 28 | 25th | 52.8 | 2 | ||
| ▲ | Cleveland Indians | 26th | 24 | 52.0 | 2½ | ||
| ▼ | Detroit Tigers | 24 | 27 | 47.1 | 5 | ||
| Minnesota Twins | 15th | 36 | 29.4 | 14th | |||
| West Division | |||||||
| PS | franchise | W. | L. | % | GB | ||
|---|---|---|---|---|---|---|---|
| 2 | Texas Rangers | 31 | 21st | 59.6 | - | ||
| WC | Seattle Mariners | 30th | 21st | 58.8 | ½ | ||
| ▲ | LA Angels of Anaheim | 24 | 28 | 46.2 | 7th | ||
| ▲ | Houston Astros | 24 | 29 | 45.3 | 7½ | ||
| ▼ | Oakland Athletics | 24 | 29 | 45.3 | 7½ | ||
| Wild Card Race | |||||
| franchise | W. | L. | % | GB | |
|---|---|---|---|---|---|
| SEA | 30th | 21st | 58.8 | + 1½ | |
| BAL | 28 | 22nd | 56.0 | - | |
| CWS | 28 | 25th | 52.8 | 1½ | |
| CLE | 26th | 24 | 52.0 | 2 | |
| GOAL | 28 | 26th | 51.9 | 2 | |
| DET | 24 | 27 | 47.1 | 4½ | |
| NYY | 24 | 27 | 47.1 | 4½ | |
| LAA | 24 | 28 | 46.2 | 5 | |
| HOU | 24 | 29 | 45.3 | 5½ | |
| OAK | 23 | 29 | 44.2 | 6th | |
| TB | 22nd | 28 | 44.0 | 6th | |
| MIN | 15th | 35 | 30.0 | 13 | |
Arrows: ▲ Improvement vs. April, ▼ worsening vs. April, other explanations see AL April
June

In the East Division, the Baltimore Orioles were able to take over the top position from the Boston Red Sox in June after 19 wins in 28 games, which in turn had an extremely weak month and could only win 38.5% of their games. The Red Sox, who held the first play-off spot at the end of May, would now only qualify for the post season with a half-game lead over the wild card. At the Orioles, Adam Jones was particularly convincing with eleven home runs and 27 RBI, as well as Chris Davis , who contributed nine home runs and 24 RBI to the success. In total, the Orioles had 56 home runs, setting a new all-time record for June. The old record from June 1996 was 55 HR and was held by the Oakland Athletics. Adam Jones of the Orioles shares the league-wide best for home runs with Edwin Encarnacion of the Tampa Bay Rays , who also won eleven times and thus helped bring the Rays from last place in the division to ½ game to the Red Sox and second place .
The Chicago White Sox continued to decline in the Central Division. After first place in April and second place in May, they were only fourth on June 30th. On the other hand, the advance of the Cleveland Indians continued, who, after an average start of the season, ended June with an outstanding 22 wins and only six defeats (78.6%), displacing the Kansas City Royals from the top position. Impressive among the Indians were Rajai Davis , who was able to steal ten bases in June alone, and pitcher Danny Salazar , who won all of his five starts and was consequently named Pitcher of the Month in the AL. The Minnesota Twins were able to win more than 30% of the games for the first time this season, but still remained by far the worst team in the AL. One of the bright spots among the Twins is Max Kepler from Berlin , who was appointed to the MLB squad at the end of May , who scored his first 15 RBI in the Big Leagues in June and was the second best player on his team in these statistics.
The new and old leaders of the West Division, the Texas Rangers, with 20 wins and eight defeats, were not only able to expand their lead over the competition by 8 games, they were also the best team in the entire AL at the end of the month and currently had the first Play- off spot. Outstanding in the Rangers were Cole Hamels with four wins from four starts, Rougned Odor with eight home runs and Ian Desmond with 42 hits and 19 self-scored runs. The Houston Astros also made a leap in the west, improving from fourth to second. The most conspicuous player of the Astros and AL Player of the Month at the end of the month was José Altuve with 15 RBI and a batting average of 42%.
As of June 30, 2016, the following table constellations in the American League resulted:
| East Division | |||||||
| PS | franchise | W. | L. | % | GB | ||
|---|---|---|---|---|---|---|---|
| ▲ | 3 | Baltimore Orioles | 47 | 31 | 60.3 | - | |
| ▼ | WC | Boston Red Sox | 42 | 36 | 53.8 | 5 | |
| Toronto Blue Jays | 43 | 38 | 53.1 | 5½ | |||
| New York Yankees | 39 | 39 | 50.0 | 8th | |||
| Tampa Bay Rays | 33 | 45 | 42.3 | 14th | |||
| Central Division | |||||||
| PS | franchise | W. | L. | % | GB | ||
|---|---|---|---|---|---|---|---|
| ▲ | 2 | Cleveland Indians | 48 | 30th | 61.5 | - | |
| ▼ | WC | Kansas City Royals | 42 | 36 | 53.8 | 6th | |
| ▲ | Detroit Tigers | 41 | 38 | 51.9 | 7½ | ||
| ▼ | Chicago White Sox | 40 | 39 | 50.6 | 8½ | ||
| Minnesota Twins | 25th | 53 | 32.1 | 23 | |||
| West Division | |||||||
| PS | franchise | W. | L. | % | GB | ||
|---|---|---|---|---|---|---|---|
| 1 | Texas Rangers | 51 | 29 | 63.8 | - | ||
| ▲ | Houston Astros | 42 | 37 | 53.2 | 8½ | ||
| ▼ | Seattle Mariners | 40 | 39 | 50.6 | 10½ | ||
| ▲ | Oakland Athletics | 35 | 44 | 44.3 | 15½ | ||
| ▼ | LA Angels of Anaheim | 32 | 47 | 40.5 | 18½ | ||
| Wild Card Race | |||||
| franchise | W. | L. | % | GB | |
|---|---|---|---|---|---|
| BOS | 42 | 36 | 53.8 | - | |
| KC | 42 | 36 | 53.8 | - | |
| HOU | 42 | 37 | 53.2 | ½ | |
| GOAL | 43 | 38 | 53.1 | ½ | |
| DET | 41 | 38 | 51.9 | 1½ | |
| CWS | 40 | 39 | 50.6 | 2½ | |
| SEA | 40 | 39 | 50.6 | 2½ | |
| NYY | 39 | 39 | 50 | 3 | |
| OAK | 35 | 44 | 44.3 | 7½ | |
| TB | 33 | 45 | 42.3 | 9 | |
| LAA | 32 | 47 | 40.5 | 10½ | |
| MIN | 25th | 53 | 32.1 | 17th | |
Arrows: ▲ Improvement vs. May, ▼ worsening vs. May, other explanations see AL April
July
As of July 31, 2016, the following table constellations in the American League resulted:
| East Division | |||||||
| PS | franchise | W. | L. | % | GB | ||
|---|---|---|---|---|---|---|---|
| 3 | Baltimore Orioles | 59 | 45 | 56.7 | - | ||
| ▲ | WC | Toronto Blue Jays | 59 | 46 | 56.2 | ½ | |
| ▼ | WC | Boston Red Sox | 57 | 46 | 55.3 | 1½ | |
| New York Yankees | 52 | 52 | 50.0 | 7th | |||
| Tampa Bay Rays | 42 | 61 | 40.8 | 16½ | |||
| Central Division | |||||||
| PS | franchise | W. | L. | % | GB | ||
|---|---|---|---|---|---|---|---|
| 1 | Cleveland Indians | 60 | 42 | 58.8 | - | ||
| ▲ | Detroit Tigers | 57 | 48 | 54.3 | 4½ | ||
| ▲ | Chicago White Sox | 51 | 54 | 48.6 | 10½ | ||
| ▼ | Kansas City Royals | 49 | 55 | 47.1 | 12 | ||
| Minnesota Twins | 40 | 64 | 38.5 | 21st | |||
| West Division | |||||||
| PS | franchise | W. | L. | % | GB | ||
|---|---|---|---|---|---|---|---|
| 2 | Texas Rangers | 62 | 44 | 58.5 | - | ||
| Houston Astros | 55 | 49 | 52.9 | 6th | |||
| Seattle Mariners | 52 | 51 | 50.5 | 8½ | |||
| ▲ | LA Angels of Anaheim | 47 | 58 | 44.8 | 14½ | ||
| ▼ | Oakland Athletics | 47 | 58 | 44.8 | 14½ | ||
| Wild Card Race | |||||
| franchise | W. | L. | % | GB | |
|---|---|---|---|---|---|
| GOAL | 59 | 46 | 56.2 | +1 | |
| BOS | 57 | 46 | 55.3 | - | |
| DET | 57 | 48 | 54.3 | 1 | |
| HOU | 55 | 49 | 52.9 | 2½ | |
| SEA | 52 | 51 | 50.5 | 5 | |
| NYY | 52 | 52 | 50.0 | 5½ | |
| CWS | 51 | 54 | 48.6 | 7th | |
| KC | 49 | 55 | 47.1 | 8½ | |
| LAA | 47 | 58 | 44.8 | 11 | |
| OAK | 47 | 58 | 44.8 | 11 | |
| TB | 42 | 61 | 40.8 | 15th | |
| MIN | 40 | 64 | 38.5 | 17½ | |
Arrows: ▲ Improvement vs. June, ▼ deterioration compared to June, other explanations see AL April
August
As of August 31, 2016, the following table constellations in the American League resulted:
| East Division | |||||||
| PS | franchise | W. | L. | % | GB | ||
|---|---|---|---|---|---|---|---|
| ▲ | 3 | Toronto Blue Jays | 76 | 57 | 57.1 | - | |
| ▲ | WC | Boston Red Sox | 74 | 59 | 55.6 | 2 | |
| ▼ | WC | Baltimore Orioles | 72 | 61 | 54.1 | 4th | |
| New York Yankees | 69 | 63 | 52.3 | 6½ | |||
| Tampa Bay Rays | 56 | 76 | 42.4 | 19½ | |||
| Central Division | |||||||
| PS | franchise | W. | L. | % | GB | ||
|---|---|---|---|---|---|---|---|
| 2 | Cleveland Indians | 76 | 56 | 57.6 | - | ||
| WC | Detroit Tigers | 72 | 61 | 54.1 | 4½ | ||
| ▲ | Kansas City Royals | 69 | 64 | 51.9 | 7½ | ||
| ▼ | Chicago White Sox | 63 | 69 | 47.7 | 13 | ||
| Minnesota Twins | 49 | 84 | 36.8 | 27½ | |||
| West Division | |||||||
| PS | franchise | W. | L. | % | GB | ||
|---|---|---|---|---|---|---|---|
| 1 | Texas Rangers | 80 | 54 | 59.7 | - | ||
| Houston Astros | 71 | 62 | 53.4 | 8½ | |||
| Seattle Mariners | 68 | 65 | 51.1 | 11½ | |||
| LA Angels of Anaheim | 59 | 74 | 44.4 | 20½ | |||
| Oakland Athletics | 57 | 76 | 42.9 | 22½ | |||
| Wild Card Race | ||||
| franchise | W. | L. | % | GB |
|---|---|---|---|---|
| BOS | 74 | 59 | 55.6 | +2 |
| BAL | 72 | 61 | 54.1 | - |
| DET | 72 | 61 | 54.1 | - |
| HOU | 71 | 62 | 52.4 | 1 |
| NYY | 69 | 63 | 52.3 | 2½ |
| KC | 69 | 64 | 51.9 | 3 |
| SEA | 68 | 65 | 51.1 | 4th |
| CWS | 63 | 69 | 47.7 | 8½ |
| LAA | 59 | 74 | 44.4 | 13 |
| OAK | 57 | 76 | 42.9 | 15th |
| TB | 56 | 76 | 42.4 | 15½ |
| MIN | 49 | 84 | 36.8 | 23 |
Arrows: ▲ Improvement vs. June, ▼ deterioration compared to June, other explanations see AL April
End of the regular season
At the end of the regular season there were the following table constellations in the American League:
| East Division | |||||||
| PS | franchise | W. | L. | % | GB | ||
|---|---|---|---|---|---|---|---|
| ▲ | 3 | Boston Red Sox | 93 | 69 | 57.4 | - | |
| ▲ | WC | Baltimore Orioles | 89 | 73 | 54.9 | 4th | |
| ▼ | WC | Toronto Blue Jays | 89 | 73 | 54.9 | 4th | |
| New York Yankees | 84 | 78 | 51.9 | 9 | |||
| Tampa Bay Rays | 68 | 94 | 42.0 | 25th | |||
| Central Division | |||||||
| PS | franchise | W. | L. | % | GB | ||
|---|---|---|---|---|---|---|---|
| 2 | Cleveland Indians | 94 | 67 | 58.4 | - | ||
| Detroit Tigers | 86 | 75 | 53.4 | 8th | |||
| Kansas City Royals | 81 | 81 | 50.0 | 13½ | |||
| Chicago White Sox | 78 | 84 | 48.1 | 16½ | |||
| Minnesota Twins | 59 | 103 | 36.4 | 35½ | |||
| West Division | |||||||
| PS | franchise | W. | L. | % | GB | ||
|---|---|---|---|---|---|---|---|
| 1 | Texas Rangers | 95 | 67 | 58.6 | - | ||
| ▲ | Seattle Mariners | 86 | 76 | 53.1 | 9 | ||
| ▼ | Houston Astros | 84 | 78 | 51.9 | 11 | ||
| LA Angels of Anaheim | 74 | 88 | 45.7 | 21st | |||
| Oakland Athletics | 69 | 93 | 42.6 | 26th | |||
| Wild Card Race | |||||
| franchise | W. | L. | % | GB | |
|---|---|---|---|---|---|
| BAL | 89 | 73 | 54.9 | - | |
| GOAL | 89 | 73 | 54.9 | - | |
| DET | 86 | 75 | 53.4 | 2½ | |
| SEA | 86 | 76 | 53.1 | 3 | |
| HOU | 84 | 78 | 51.9 | 5 | |
| NYY | 84 | 78 | 51.9 | 5 | |
| KC | 81 | 81 | 50.0 | 8th | |
| CWS | 78 | 84 | 48.1 | 11 | |
| LAA | 74 | 88 | 45.7 | 15th | |
| OAK | 69 | 93 | 42.6 | 20th | |
| TB | 68 | 94 | 42.0 | 21st | |
| MIN | 59 | 103 | 36.4 | 30th | |
Arrows: ▲ Improvement vs. June, ▼ deterioration compared to June, other explanations see AL April
Texas Rangers,
AL West winner
Toronto Blue Jays,
3rd AL East

National League
April
The Chicago Cubs , who lost in the League Championship Series last year , were the most successful team in April and had to admit defeat only five times in 22 games. Starting pitcher Jake Arrieta , who contributed 5 wins , played a major role in the good start to the season . Among other things, Arrieta was the second no-hitter of his career on April 21 with a 16-0 away win at the Cincinnati Reds . Last year's National League winner, the New York Mets , started April evenly with 6 wins and 6 losses, but then started a strong streak and won nine of the last ten games of the month and ended April almost level with the Washington Nationals .
The West Division was extremely balanced in April, with all teams except the San Diego Padres having almost identical success rates. It is also remarkable that none of the teams in the West Division had a positive record. Los Angeles and San Francisco lead the table together with twelve wins and 13 losses.
Two Colorado Rockies players made ten home runs at the start of the season, Nolan Arenado and Trevor Story , and Arendo was also the most successful runner in the National League in April with 21 runs .
As of April 30, 2016, the following table constellations in the National League resulted:
| East Division | ||||||
| PS | franchise | W. | L. | % | GB | |
|---|---|---|---|---|---|---|
| 2 | Washington Nationals | 16 | 7th | 69.6 | - | |
| WC | New York Mets | 15th | 7th | 68.2 | ½ | |
| Philadelphia Phillies | 14th | 10 | 58.3 | 2½ | ||
| Miami Marlins | 12 | 11 | 52.2 | 4th | ||
| Atlanta Braves | 5 | 18th | 21.7 | 11 | ||
| Central Division | ||||||
| PS | franchise | W. | L. | % | GB | |
|---|---|---|---|---|---|---|
| 1 | Chicago Cubs | 17th | 5 | 77.3 | - | |
| WC | Pittsburgh Pirates | 15th | 9 | 62.5 | 3 | |
| St. Louis Cardinals | 12 | 12 | 50.0 | 6th | ||
| Cincinnati Reds | 9 | 15th | 37.5 | 9 | ||
| Milwaukee Brewers | 8th | 15th | 34.8 | 9½ | ||
| West Division | ||||||
| PS | franchise | W. | L. | % | GB | |
|---|---|---|---|---|---|---|
| 3 * | Los Angeles Dodgers | 12 | 13 | 48.0 | - | |
| 3 * | San Francisco Giants | 12 | 13 | 48.0 | - | |
| Colorado Rockies | 11 | 12 | 47.8 | - | ||
| Arizona Diamondbacks | 12 | 14th | 46.2 | ½ | ||
| San Diego Padres | 9 | 15th | 37.5 | 2½ | ||
As of April 30, 2016
* Los Angeles Dodgers and San Francisco Giants share 1st place at the end of the month
PS = Postseason; Number = Rank on the seed list or WC = Wild Card (best two teams after the division winners)
W = Wins (victories), L = Losses (defeats),% = Winning Percentage , GB = Games Behind (behind leaders: number of necessary Defeats of the leader with simultaneous own victory)
May

In the battle for the starting places for the post season, May brought hardly any significant changes in the National League. Despite a somewhat weaker rate, the Chicago Cubs retained their position as the most successful team in the NL and the MLB as a whole and were able to more than double their lead over the Pirates in the Central Division. At the end of the month, the Pirates themselves have an identical win-loss record as the New York Mets from the East Division and are currently sharing the lead in the Wild Card race with them.
The Mets are still just behind the Washington Nationals, where Daniel Murphy dominated the month offensively. Murphy, who moved from New York to Washington after the 2015 season , achieved 23 RBI and 17 runs of his own in May. The Miami Marlins, who had the pitcher with the most wins in their ranks in May, made up a place in the East Division. José Fernandez won all of his six starts and ended the month with an ERA of 1.38.
Also in the East Division there was the first dismissal of a manager of the current season. Fredi González, who was the Atlanta Braves' manager for more than five years , was fired on May 17 after the Braves lost 18 games in April and only four wins from their first 14 games in May. At the time of González's dismissal after 37 games this season, the Braves stood with a win rate of 24.3% with 9 wins and 28 losses.
In the West Division, the San Francisco Giants have developed a 4½-game lead over the Los Angeles Dodgers. The Colorado Rockies and Arizona Diamondbacks, which were also at the same level as the Giants at the end of April, lost even more ground than the Dodgers.
As of May 31, 2016, there were the following table constellations in the National League:
| East Division | |||||||
| PS | franchise | W. | L. | % | GB | ||
|---|---|---|---|---|---|---|---|
| 3 | Washington Nationals | 32 | 21st | 60.4 | - | ||
| WC | New York Mets | 29 | 22nd | 56.9 | 2 | ||
| ▲ | Miami Marlins | 27 | 25th | 51.9 | 4½ | ||
| ▼ | Philadelphia Phillies | 26th | 26th | 50.0 | 5½ | ||
| Atlanta Braves | 15th | 36 | 29.4 | 16 | |||
| Central Division | |||||||
| PS | franchise | W. | L. | % | GB | ||
|---|---|---|---|---|---|---|---|
| 1 | Chicago Cubs | 35 | 15th | 70.0 | - | ||
| WC | Pittsburgh Pirates | 29 | 22nd | 56.9 | 6½ | ||
| St. Louis Cardinals | 28 | 25th | 52.8 | 8½ | |||
| ▲ | Milwaukee Brewers | 23 | 29 | 44.2 | 13 | ||
| ▼ | Cincinnati Reds | 17th | 35 | 32.7 | 19th | ||
| West Division | |||||||
| PS | franchise | W. | L. | % | GB | ||
|---|---|---|---|---|---|---|---|
| 2 | San Francisco Giants | 33 | 21st | 61.1 | - | ||
| ▼ | Los Angeles Dodgers | 28 | 25th | 52.8 | 4½ | ||
| Colorado Rockies | 24 | 27 | 47.1 | 7½ | |||
| Arizona Diamondbacks | 23 | 31 | 45.3 | 7½ | |||
| San Diego Padres | 20th | 33 | 45.3 | 7½ | |||
| Wild Card Race | |||||
| franchise | W. | L. | % | GB | |
|---|---|---|---|---|---|
| NYM | 29 | 22nd | 56.9 | - | |
| PIT | 29 | 33 | 56.9 | - | |
| LAD | 28 | 25th | 52.8 | 2 | |
| STL | 28 | 25th | 52.8 | 2 | |
| MIA | 27 | 25th | 51.9 | 2½ | |
| PHI | 26th | 26th | 50.0 | 3½ | |
| COL | 24 | 27 | 47.1 | 5 | |
| Mil | 23 | 29 | 44.2 | 6½ | |
| ARI | 23 | 31 | 42.6 | 7½ | |
| SD | 20th | 33 | 37.7 | 10 | |
| CIN | 17th | 35 | 32.7 | 12½ | |
| ATL | 15th | 36 | 29.4 | 14th | |
Arrows: ▲ Improvement vs. April, ▼ worsening vs. April, other explanation see NL April
June
In the East Division there were hardly any changes compared to the previous month. The Washington Nationals were able to extend their lead on second place. From the division, especially Nats pitcher Max Scherzer (4: 1 wins, 1.63 ERA) and Mets closer Jeurys Familia (10 saves ) are defensive in June . In the Atlanta Braves, which are still bottom of the division, first baseman Freddie Freeman , who shared 36 hits, scored most of the National League.
The Chicago Cubs were able to break away from the pursuers in the Central Division in June and now have an 11-game lead over the new Second St. Louis Cardinals, who overtook the Pittsburgh Pirates during the month. With 65.4% won games, the Cubs are still the statistically best team in the National League and the entire MLB. The Cubs had the most home run player in June with Kris Bryant , along with San Diego's Wil Myers from the West Division (11). The division's most successful pitcher is also from Chicago. Jon Lester finished June with a pitchers record of 4-0 after six games, had an outstanding ERA of 1.41 and was ultimately voted pitcher of the month for the NL. Billy Hamilton from bottom of the league table Cincinnati was the most successful in this statistic in the National League in June with new stolen bases.
As in the East Division, there were no changes in the table in June in the West Division. The San Francisco Giants were able to slightly increase their lead over the Los Angeles Dodgers, while the Dodgers took the lead in the NL Wild Card Race due to a good month . Wil Myers from the Padres offensively dominated the division and the entire NL. In addition to the eleven home runs mentioned, he achieved 33 RBI, 19 BB , ten doubles and five stolen bases. As a result, he was voted player of the month in the NL. Three East Division pitchers ended the month with four wins. Jorge De La Rosa of the Rockies, Zack Greinke of the Diamondbacks and Clayton Kershaw of the Dodgers.
As of June 30, 2016, the following table constellations in the National League resulted:
| East Division | |||||||
| PS | franchise | W. | L. | % | GB | ||
|---|---|---|---|---|---|---|---|
| 3 | Washington Nationals | 48 | 32 | 60.0 | - | ||
| WC | New York Mets | 41 | 37 | 52.6 | 6th | ||
| Miami Marlins | 41 | 38 | 51.9 | 6½ | |||
| Philadelphia Phillies | 35 | 45 | 43.8 | 13 | |||
| Atlanta Braves | 27 | 52 | 34.2 | 20½ | |||
| Central Division | |||||||
| PS | franchise | W. | L. | % | GB | ||
|---|---|---|---|---|---|---|---|
| 1 | Chicago Cubs | 51 | 27 | 65.4 | - | ||
| ▲ | St. Louis Cardinals | 40 | 38 | 51.3 | 11 | ||
| ▼ | Pittsburgh Pirates | 38 | 41 | 48.1 | 13½ | ||
| Milwaukee Brewers | 35 | 43 | 44.9 | 16 | |||
| Cincinnati Reds | 29 | 51 | 36.3 | 23 | |||
| West Division | |||||||
| PS | franchise | W. | L. | % | GB | ||
|---|---|---|---|---|---|---|---|
| 2 | San Francisco Giants | 50 | 31 | 61.7 | - | ||
| WC | Los Angeles Dodgers | 44 | 37 | 54.3 | 6th | ||
| Colorado Rockies | 37 | 41 | 47.4 | 11½ | |||
| Arizona Diamondbacks | 36 | 45 | 44.4 | 14th | |||
| San Diego Padres | 33 | 46 | 41.8 | 16 | |||
| Wild Card Race | |||||
| franchise | W. | L. | % | GB | |
|---|---|---|---|---|---|
| LAD | 44 | 37 | 54.3 | + 1½ | |
| NYM | 41 | 37 | 52.6 | - | |
| MIA | 41 | 38 | 51.9 | ½ | |
| STL | 40 | 38 | 51.3 | 1 | |
| PIT | 38 | 41 | 48.1 | 3½ | |
| COL | 37 | 41 | 47.4 | 4th | |
| Mil | 35 | 43 | 44.9 | 6th | |
| ARI | 36 | 45 | 44.4 | 6½ | |
| PHI | 35 | 45 | 43.8 | 7th | |
| SD | 33 | 46 | 41.8 | 8½ | |
| CIN | 29 | 51 | 36.3 | 13 | |
| ATL | 27 | 52 | 34.2 | 14½ | |
Arrows: ▲ Improvement vs. May, ▼ worsening vs. May, other explanation see NL April
July
As of July 31, 2016, the following table constellations in the National League resulted:
| East Division | |||||||
| PS | franchise | W. | L. | % | GB | ||
|---|---|---|---|---|---|---|---|
| 2 | Washington Nationals | 61 | 44 | 58.1 | - | ||
| ▲ | WC | Miami Marlins | 57 | 48 | 54.3 | 4th | |
| ▼ | New York Mets | 54 | 50 | 51.9 | 6½ | ||
| Philadelphia Phillies | 48 | 59 | 44.9 | 14th | |||
| Atlanta Braves | 37 | 68 | 35.2 | 24 | |||
| Central Division | |||||||
| PS | franchise | W. | L. | % | GB | ||
|---|---|---|---|---|---|---|---|
| 1 | Chicago Cubs | 63 | 41 | 60.6 | - | ||
| St. Louis Cardinals | 56 | 49 | 53.3 | 7½ | |||
| Pittsburgh Pirates | 52 | 51 | 50.5 | 10½ | |||
| Milwaukee Brewers | 47 | 56 | 45.6 | 15½ | |||
| Cincinnati Reds | 42 | 62 | 40.4 | 21st | |||
| West Division | |||||||
| PS | franchise | W. | L. | % | GB | ||
|---|---|---|---|---|---|---|---|
| 2 | San Francisco Giants | 61 | 44 | 58.1 | - | ||
| WC | Los Angeles Dodgers | 59 | 46 | 56.2 | 2 | ||
| Colorado Rockies | 52 | 53 | 49.5 | 9 | |||
| ▲ | San Diego Padres | 45 | 60 | 42.9 | 16 | ||
| ▼ | Arizona Diamondbacks | 43 | 62 | 41.0 | 18th | ||
| Wild Card Race | |||||
| franchise | W. | L. | % | GB | |
|---|---|---|---|---|---|
| LAD | 59 | 46 | 56.2 | +2 | |
| MIA | 57 | 48 | 54.3 | - | |
| STL | 56 | 49 | 53.3 | 1 | |
| NYM | 54 | 50 | 51.9 | 2½ | |
| PIT | 52 | 51 | 50.5 | 4th | |
| COL | 52 | 53 | 49.5 | 5 | |
| Mil | 47 | 56 | 45.6 | 9 | |
| PHI | 48 | 59 | 44.9 | 10 | |
| SD | 45 | 60 | 42.9 | 12 | |
| ARI | 43 | 62 | 41.0 | 14th | |
| CIN | 42 | 62 | 40.4 | 14½ | |
| ATL | 37 | 68 | 35.2 | 20th | |
Arrows: ▲ Improvement vs. June, ▼ deterioration compared to June, other explanation see NL April
August
As of August 31, 2016, the following table constellations in the National League resulted:
| East Division | |||||||
| PS | franchise | W. | L. | % | GB | ||
|---|---|---|---|---|---|---|---|
| 2 | Washington Nationals | 78 | 55 | 58.6 | - | ||
| ▲ | New York Mets | 69 | 64 | 51.9 | 9 | ||
| ▼ | Miami Marlins | 67 | 66 | 50.4 | 11 | ||
| Philadelphia Phillies | 60 | 73 | 45.1 | 18th | |||
| Atlanta Braves | 50 | 83 | 37.6 | 28 | |||
| Central Division | |||||||
| PS | franchise | W. | L. | % | GB | ||
|---|---|---|---|---|---|---|---|
| 1 | Chicago Cubs | 85 | 47 | 64.4 | - | ||
| WC | St. Louis Cardinals | 70 | 62 | 53.0 | 15th | ||
| Pittsburgh Pirates | 67 | 64 | 51.1 | 17½ | |||
| Milwaukee Brewers | 57 | 76 | 42.9 | 28½ | |||
| Cincinnati Reds | 55 | 77 | 41.7 | 30th | |||
| West Division | |||||||
| PS | franchise | W. | L. | % | GB | ||
|---|---|---|---|---|---|---|---|
| ▲ | 3 | Los Angeles Dodgers | 74 | 59 | 55.6 | - | |
| ▼ | WC | San Francisco Giants | 72 | 60 | 54.5 | 1½ | |
| Colorado Rockies | 64 | 69 | 48.1 | 10 | |||
| ▲ | Arizona Diamondbacks | 56 | 77 | 42.1 | 18th | ||
| ▼ | San Diego Padres | 55 | 77 | 41.7 | 18½ | ||
| Wild Card Race | |||||
| franchise | W. | L. | % | GB | |
|---|---|---|---|---|---|
| SF | 72 | 60 | 54.5 | +2 | |
| STL | 70 | 62 | 53.0 | - | |
| NYM | 69 | 64 | 51.9 | 1½ | |
| PIT | 67 | 64 | 51.1 | 2½ | |
| MIA | 67 | 66 | 50.4 | 3½ | |
| COL | 64 | 69 | 48.1 | 6½ | |
| PHI | 60 | 73 | 45.1 | 10½ | |
| Mil | 57 | 76 | 42.9 | 13½ | |
| ARI | 56 | 77 | 42.1 | 14½ | |
| CIN | 55 | 77 | 41.7 | 15th | |
| SD | 55 | 77 | 41.7 | 15th | |
| ATL | 50 | 83 | 37.6 | 20½ | |
Arrows: ▲ Improvement vs. June, ▼ deterioration compared to June, other explanation see NL April
End of the regular season
At the end of the regular season there were the following table constellations in the National League:
| East Division | |||||||
| PS | franchise | W. | L. | % | GB | ||
|---|---|---|---|---|---|---|---|
| 2 | Washington Nationals | 95 | 67 | 58.6 | - | ||
| WC | New York Mets | 87 | 75 | 53.7 | 8th | ||
| Miami Marlins | 79 | 82 | 49.1 | 15½ | |||
| Philadelphia Phillies | 71 | 91 | 43.8 | 24 | |||
| Atlanta Braves | 68 | 93 | 42.2 | 26½ | |||
| Central Division | |||||||
| PS | franchise | W. | L. | % | GB | ||
|---|---|---|---|---|---|---|---|
| 1 | Chicago Cubs | 103 | 58 | 64.0 | - | ||
| St. Louis Cardinals | 86 | 76 | 53.1 | 17½ | |||
| Pittsburgh Pirates | 78 | 83 | 48.4 | 25th | |||
| Milwaukee Brewers | 73 | 89 | 45.1 | 30½ | |||
| Cincinnati Reds | 68 | 94 | 42.0 | 35½ | |||
| West Division | |||||||
| PS | franchise | W. | L. | % | GB | ||
|---|---|---|---|---|---|---|---|
| 3 | Los Angeles Dodgers | 91 | 71 | 56.2 | - | ||
| WC | San Francisco Giants | 87 | 75 | 53.7 | 4th | ||
| Colorado Rockies | 75 | 87 | 46.3 | 16 | |||
| Arizona Diamondbacks | 69 | 93 | 42.6 | 22nd | |||
| San Diego Padres | 68 | 94 | 42.0 | 23 | |||
| Wild Card Race | |||||
| franchise | W. | L. | % | GB | |
|---|---|---|---|---|---|
| NYM | 87 | 75 | 53.7 | - | |
| SF | 87 | 75 | 53.7 | - | |
| STL | 86 | 76 | 53.1 | 1 | |
| MIA | 79 | 82 | 49.1 | 7½ | |
| PIT | 78 | 83 | 48.4 | 8½ | |
| COL | 75 | 87 | 46.3 | 12 | |
| Mil | 73 | 89 | 45.1 | 14th | |
| PHI | 71 | 91 | 43.8 | 16 | |
| ARI | 69 | 93 | 42.6 | 18th | |
| ATL | 68 | 93 | 42.2 | 18½ | |
| CIN | 68 | 94 | 42.0 | 19th | |
| SD | 68 | 94 | 42.0 | 19th | |
Arrows: ▲ Improvement vs. June, ▼ deterioration compared to June, other explanation see NL April

Chicago Cubs,
winners of NL Central
Washington Nationals,
winner of NL East
Los Angeles Dodgers,
winner of NL West
New York Mets,
2nd NL East
San Francisco Giants,
2nd NL West

Postseason
Main articles: ALWC 2016 , NLWC 2016 , ALDS 2016 , NLDS 2016 , ALCS 2016 , NLCS 2016 , World Series 2016
Mode and participants
From the beginning of October, the Division Series and then the respective Championship Series were played. To this end, the two wild card winners first met in one game. The three division winners and the winner of the wild card game met in two division series matches in the best-of-five mode ( ALDS or NLDS = American or National League Division Series). The wild card winners played against the best division winner, i.e. the team with the most wins from the regular season games.
The winners of the Division Series matches then play the respective League Champion in a best-of-seven procedure ( ALCS or NLCS = American or National League Championship Series).
Scheme
The following results were found in the postseason:
| Wild Card Games | League Division Series | League Championship Series | World Series | |||||||||||||||
| 2 | Cleveland Indians | 3 | ||||||||||||||||
| 3 | Boston Red Sox | 0 | ||||||||||||||||
| 2 | Cleveland Indians | 4th | ||||||||||||||||
| American League | ||||||||||||||||||
| WC1 | Toronto Blue Jays | 1 | ||||||||||||||||
| 1 | Texas Rangers | 0 | ||||||||||||||||
| WC1 | Toronto Blue Jays | 3 | ||||||||||||||||
| WC1 | Toronto Blue Jays | 1 | ||||||||||||||||
| WC2 | Baltimore Orioles | 0 | AL | Cleveland Indians | 3 | |||||||||||||
| NL | Chicago Cubs | 4th | ||||||||||||||||
| 2 | Washington Nationals | 2 | ||||||||||||||||
| 3 | Los Angeles Dodgers | 3 | ||||||||||||||||
| 3 | Los Angeles Dodgers | 2 | ||||||||||||||||
| National League | ||||||||||||||||||
| 1 | Chicago Cubs | 4th | ||||||||||||||||
| 1 | Chicago Cubs | 3 | ||||||||||||||||
| WC2 | San Francisco Giants | 1 | ||||||||||||||||
| WC1 | New York Mets | 0 | ||||||||||||||||
| WC2 | San Francisco Giants | 1 | ||||||||||||||||
Submit Results
Wild Card Games: one game; ALDS, NLDS (Division Series): Best-of Five; ALCS, NLCS (Championship Series), World Series: Best-of-Seven
Player statistics
Hitting
| American League | National League | |||||
|---|---|---|---|---|---|---|
| Stat | Player | team | Total | Player | team | Total |
| AVG | José Altuve |
|
.338 | DJ LeMahieu |
|
.348 |
| MR | Mark Trumbo | BAL | 47 | Nolan Arenado Chris Carter |
|
41 |
| RBI | Edwin Encarnación David Ortiz |
BOS |
127 | Nolan Arenado |
|
133 |
| R. | Mike Trout |
|
123 | Kris Bryant |
|
121 |
| H | José Altuve |
|
216 | Jean Segura |
|
203 |
| SB | Rajai Davis |
|
43 | Jonathan Villar |
|
62 |
Pitching
| American League | National League | |||||
|---|---|---|---|---|---|---|
| Stat | Player | team | Total | Player | team | Total |
| W. | Rick Porcello | BOS | 22nd | Max Scherzer |
|
20th |
| L. | Chris Archer |
|
19th | Jimmy Nelson |
|
16 |
| ERA | Aaron Sanchez |
|
3.00 | Kyle Hendricks |
|
2.13 |
| K | Justin Verlander |
|
254 | Max Scherzer |
|
284 |
| IP | David Price | BOS | 230.0 | Max Scherzer |
|
228.1 |
| SV | Zach Britton | BAL | 47 | Jeurys Familia |
|
51 |
Career milestones

Batter
| player | team | milestone | category | date |
|---|---|---|---|---|
| Víctor Martínez |
|
1,000 | RBI | Apr 21, 2016 |
| AJ Pierzynski |
|
2,000 | hit | Apr. 27, 2016 |
| Ichiro Suzuki |
|
500 | Stole base | Apr 29, 2016 |
| David Ortiz | BOS | 600 | Double | May 14, 2016 |
| Carlos Beltran |
|
400 | Home Run | May 15, 2016 |
| Miguel Cabrera |
|
500 | Double | May 23, 2016 |
| Adrián Beltré |
|
1,500 | RBI | May 28, 2016 |
| Chase Utley |
|
1,000 | run | June 22, 2016 |
| Mark Teixeira |
|
400 | Home Run | 3rd July, 2016 |
Others
Mets pitcher Bartolo Colón , who has been under contract with various MLB teams since 1997, managed the first home run of his career on May 7, 2016. At this point, Colón was 42 years and 349 days old. This makes him the oldest player in the MLB at the time of his first home run.
Pitcher
| player | team | milestone | category | date |
|---|---|---|---|---|
| Jonathan Papelbon |
|
350 | Save | Apr 4, 2016 |
| Jake Arrieta |
|
2 | No-hitter | Apr 21, 2016 |
| John Lackey |
|
2,000 | Strikeout | May 6, 2016 |
| Justin Verlander |
|
2,000 | Strikeout | May 18, 2016 |
| Francisco Rodríguez |
|
400 | Save | May 24, 2016 |
| Cole Hamels |
|
2,000 | Strikeout | June 12, 2016 |
Franchise records
The table shows the point in time at which the player took the lead in a club-internal category.
| player | team | milestone | category | date |
|---|---|---|---|---|
| Kenley Jansen |
|
162 | Save | 20th June 2016 |
| Jeurys Familia |
|
25th | successive saves at the beginning of the season | June 24, 2016 |
| Danny Duffy |
|
16 | Strikeouts in one game | Aug 1, 2016 |
honors and awards
Player of the month
| month | American League | National League |
|---|---|---|
| April | Manny Machado |
|
| May | Jackie Bradley Jr. |
|
| June |
|
|
| July | Mookie Betts |
|
| August |
|
|
| September |
|
|
Pitcher of the month
| month | American League | National League |
|---|---|---|
| April |
|
|
| May |
|
|
| June |
|
|
| July |
|
|
| August |
|
|
| September | Rick Porcello |
|
Rookie of the month
| month | American League | National League |
|---|---|---|
| April |
|
|
| May |
|
|
| June | Tyler Naquin |
|
| July | Tyler Naquin |
|
| August |
|
|
| September |
|
|
Lock
Doping cases

The MLB's catalog of penalties for the intake of performance-enhancing substances , which has been in effect since March 2014, provides for the use of steroids to be banned for 80 games for the first violation and for a whole season (162 games) for the second violation. The third offense punishes the player with a lifelong exclusion from the MLB. Under certain circumstances, the penalty can be reduced, or if substances that cannot be assigned to steroids are taken, they can be reduced from the start.
Even before and at the beginning of the season, several players were again convicted of taking performance-enhancing substances. The MLB announced on February 12, 2016 that the 26-year-old pitcher Jenrry Mejía from the New York Mets had tested positive for an anabolic steroid . Since Mejía was convicted of taking steroids in April 2015 and July 2015, the MLB consequently banned him for life. The player is the first to receive the Lifetime Ban introduced in 2014 .
The other players who tested positive are players with no history of doping. The penalty for Kansas City talent Raúl A. Mondesí was reduced from 80 to 50 games because he was able to assure that the substance Clenbuterol was found in a drug he had taken to treat symptoms of colds and flu .
| player | team | Item | date | violation | Lock | Ref. |
|---|---|---|---|---|---|---|
| Jenrry Mejía |
|
P | Feb 12, 2016 | 3 | lifelong | |
| Abraham Almonte | CLE | CF | Feb. 26, 2016 | 1 | 80 games | |
| Daniel Stump |
|
P | Apr 14, 2016 | 1 | 80 games | |
| Chris Colabello |
|
1B | Apr 21, 2016 | 1 | 80 games | |
| Dee Gordon |
|
SS | Apr 29, 2016 | 1 | 80 games | |
| Josh Ravin |
|
P | May 2, 2016 | 1 | 80 games | |
| Raúl A. Mondesí |
|
SS | May 10, 2016 | 1 | 50 games | |
| Marlon Byrd | CLE | OF | June 1, 2016 | 2 | 162 games | |
| Alec Asher |
|
P | June 16, 2016 | 1 | 80 games |
Others

The Atlanta Braves' Cuban Hector Olivera was banned from 82 games on May 26, retrospectively to April 30, 2016, for violating the inter-league agreement on dealing with domestic violence, sexual assault and child abuse and, as usual, received no salary for this time. Olivera, silver medalist with Cuba at the Beijing 2008 Olympics , was arrested on April 13 for alleged assault on a woman outside a hotel. According to MLB officials, Olivera has accepted the ban. Since the player was already inactive during the ongoing investigations and the suspension came into effect retrospectively on April 30th, Olivera was eligible to play again from August 1st.
A charging the mound by Manny Machado of the Baltimore Orioles after a hit by pitch by Kansas City Royals pitcher Yordano Ventura on June 7, 2016 led to a mass brawl between both teams. The two perpetrators then received bans from the MLB. Ventura was suspended for nine games and Machado for four games. Both players appealed against the punishment and were eligible to play until the hearing.
Individual evidence
- ↑ Pirates kick off 2016 MLB season with 4-1 win over Cardinals. nydailynews.com, April 3, 2016, accessed April 27, 2016 .
- ↑ MLB awards 2016 All-Star Game to San Diego. usatoday.com, January 15, 2015, accessed April 27, 2015 .
- ↑ July 12, 2016 All-Star Game Play-By-Play and Box Score. baseball-reference.com, accessed July 13, 2016 .
- ↑ 2016 MLB First-Year Player Draft: First-round complete results. CBS, June 10, 2016, accessed June 10, 2016 .
- ↑ Standings Spring Training. MLB.com, accessed April 27, 2016 .
- ↑ Grapefruit League 2016 Schedule. springtrainingonline.com, accessed April 27, 2016 .
- ↑ Cactus League 2016 Spring Training Schedule. springtrainingonline.com, accessed April 27, 2016 .
- ↑ O's what a month: Orioles set June HR mark. mlb.com, July 1, 2016, accessed July 1, 2016 .
- ↑ a b Cubs' Jake Arrieta Throws Second Career No-Hitter. New York Times, April 21, 2016, accessed April 27, 2016 .
- ↑ Fredi Gonzalez learned he was fired from flight-home email. New York Post , May 17, 2016, accessed June 1, 2016 .
- ↑ a b A.J. Pierzynski becomes 10th catcher to reach 2,000 hits. foxsports.com, April 27, 2016, accessed April 29, 2016 .
- ↑ 'It means a lot': Tigers' Victor Martinez records 1000th career RBI. Detroit Free Press, April 21, 2016, accessed April 27, 2016 .
- ↑ Marlins' Ichiro Suzuki has milestone hit, 500th stolen base against Brewers. USA Today , April 29, 2016, accessed May 1, 2016 .
- ↑ David Ortiz hits 600th career double to beat Astros, celebrates accordingly. USA Today , May 14, 2016, accessed May 15, 2016 .
- ↑ 'That's a Hall of Famer': Carlos Beltran belts historic homer. New York Post , May 15, 2016, accessed May 17, 2016 .
- ↑ Detroit 5, Philadelphia 4: Miguel Cabrera scorching hot; so are tigers. Detroit Free Press, May 24, 2016, accessed May 27, 2016 .
- ↑ Texas Rangers: Adrian Beltre reaches RBI milestone. isportsweb.com, May 29, 2016, accessed May 31, 2016 .
- ↑ Utley scores 1,000th career run on wild pitch. mlb.com, June 22, 2016, accessed June 23, 2016 .
- ↑ Teixeira joins 400-homer club - Yankees slugger is 5th switch-hitter to reach milestone. mlb.com, July 3, 2016, accessed July 14, 2016 .
- ↑ MLB: Bartolo Colon hits home run with 42 - Mets pitcher hits record home run. Spox.com , May 10, 2016, accessed May 10, 2016 .
- ↑ Opening Day: A Nationals' Holiday indeed! Late and great and FUN! talknats.com, April 5, 2016, accessed April 28, 2016 .
- ↑ Lackey reaches 2,000-strikeout milestone. mlb.com, May 6, 2016, accessed May 7, 2016 .
- ↑ Justin Verlander hits 2,000-strikeout milestone. Detroit Free Press, May 18, 2016, accessed May 19, 2016 .
- ↑ Tigers closer Francisco Rodriguez records 400th career save. espn, May 25, 2016, accessed on May 18, 2016 .
- ↑ Cole Hamels records his 2,000th career strikeout, and the Rangers collect their seventh consecutive series victory. Dallas Morning News, June 13, 2016, accessed June 14, 2016 .
- ↑ Kenley Jansen sets all-time Dodgers franchise record for saves. SB Nation, June 20, 2016, accessed June 26, 2016 .
- ↑ Familia sets another saves record for Mets. theScore, June 25, 2016, accessed June 26, 2016 .
- ^ Duffy owns Royals mark with 16 strikeouts. mlb.com, August 1, 2016, accessed August 8, 2016 .
- ^ All-time winners player of the month. mlb.com, accessed May 6, 2016 .
- ^ All-time winners pitcher of the month. mlb.com, accessed May 6, 2016 .
- ^ All-time winners rookie of the month. mlb.com, accessed May 6, 2016 .
- ↑ Major League Baseball, union toughen drug agreement provisions ( English ) In: ESPN.com . Retrieved May 11, 2016.
- ↑ a b Mets Pitcher Jenrry Mejia Is First Major Leaguer to Get Lifetime Ban for Doping. New York Times , February 12, 2016, accessed May 11, 2016 .
- ↑ a b Raul Mondesi Jr. suspended 50 games for PEDs found in cold medicine. CBS Sports, May 10, 2016, accessed May 11, 2016 .
- ↑ Cleveland Indians' Abraham Almonte suspended for 80 games for PED violation. cleveland.com, February 26, 2016, accessed May 11, 2016 .
- ↑ Pitcher Daniel Stumpf banned by the Philadelphia Phillies for doping - Phillies doping offenders severely punished. sport1 , April 14, 2016, accessed May 11, 2016 .
- ↑ Positive Test for Anabolic Steroid - 80 Game Ban on Toronto's Colabello. Spox.com , April 23, 2016, accessed May 11, 2016 .
- ↑ Shock for the Marlins - Gordon banned for doping. Spox.com , April 29, 2016, accessed May 11, 2016 .
- ↑ Dodgers pitcher withdrawn - Ravin 80 games also blocked. Spox.com , May 4, 2016, accessed May 11, 2016 .
- ↑ Repeat offender Byrd banned for 162 games. Rheinische Post , June 1, 2016, accessed on June 2, 2016 .
- ↑ Phillies pitcher Alec Asher suspended 80 games. philly.com, June 16, 2016, accessed July 4, 2016 .
- ↑ Professional baseball banned for 82 games. Süddeutsche Zeitung , May 27, 2016, accessed on May 27, 2016 .
- ↑ Hector Olivera suspended 82 games for violating domestic violence policy. Sports Illustrated , May 26, 2016, accessed May 27, 2016 .
- ↑ MLB suspends Yordano Ventura 9 games, Manny Machado 4 games for bench-clearing fight. USA Today , June 9, 2016, accessed June 13, 2016 .
1901 | 1902 | 1903 | 1904 | 1905 | 1906 | 1907 | 1908 | 1909 | 1910 | 1911 | 1912 | 1913 | 1914 | 1915 | 1916 | 1917 | 1918 | 1919 | 1920 | 1921 | 1922 | 1923 | 1924 | 1925 | 1926 | 1927 | 1928 | 1929 | 1930 | 1931 | 1932 | 1933 | 1934 | 1935 | 1936 | 1937 | 1938 | 1939 | 1940 | 1941 | 1942 | 1943 | 1944 | 1945 | 1946 | 1947 | 1948 | 1949 | 1950 | 1951 | 1952 | 1953 | 1954 | 1955 | 1956 | 1957 | 1958 | 1959 | 1960 | 1961 | 1962 | 1963 | 1964 | 1965 | 1966 | 1967 | 1968 | 1969 | 1970 | 1971 | 1972 | 1973 | 1974 | 1975 | 1976 | 1977 | 1978 | 1979 | 1980 | 1981 | 1982 | 1983 | 1984 | 1985 | 1986 | 1987 | 1988 | 1989 | 1990 | 1991 | 1992 | 1993 | 1994 | 1995 | 1996 | 1997 | 1998 | 1999 | 2000 | 2001 | 2002 | 2003 | 2004 | 2005 | 2006 | 2007 | 2008 | 2009 | 2010 | 2011 | 2012 | 2013 | 2014 | 2015 | 2016 | 2017 | 2018 | 2019 | 2020