
Unemployment statistics
The unemployment statistics are economic statistics that record the quantitative extent of unemployment based on the number of unemployed ( unemployment rate ) and the unemployment rate . Along with the employment rate, it is considered to be one of the socially most important economic indicators .
Statistical recording of unemployment in Germany
As in all EU member states , unemployment in Germany is uniformly determined using Eurostat specifications .
Unemployment rate
The unemployment rate (more precisely: the unemployment rate based on all civilian labor force ) is an economic indicator that shows the share of the registered unemployed in the total civilian labor force (i.e. all employed and unemployed), which is largely defined by the size of the population:

The sum in the denominator is sometimes referred to as the labor force potential or labor potential , but there are different definitions, e.g. B. one is not simply unemployed just because one does not work. The unemployment rate only includes people who have mostly already been gainfully employed. Only registered unemployed people are included in the counter , not all job seekers, as shown in the following section. The unemployment rate is an indicator of the labor market and employment situation and part of the unemployment statistics.
(Deviating from this, a second unemployment rate is also calculated, the denominator of which, instead of the number of all civilian labor force, only includes the number of dependent civilian labor force, i.e. the number of all employees subject to social insurance, including trainees, those in marginal employment, people in employment opportunities in the additional expense variant, civil servants (excluding soldiers) and cross-border commuters. This quota is higher, which already follows from the definition. The quota usually mentioned in the media, however, is the unemployment rate defined above based on all civilian labor force.)
Unemployment: officially registered unemployment / reported unemployment
The calculation of registered unemployment is carried out by the Federal Employment Agency. The definition of the counting criteria (who is considered unemployed?) Is determined by the Federal Ministry of Labor and Social Affairs . In Germany, registered unemployment is generally understood to mean the number of unemployed people who are registered as unemployed with the Federal Employment Agency under SGB III or with a working group or option municipality under SGB II ( Social Code ). Anyone who works less than 15 hours a week but wants to work more than 15 hours and is younger than the respective retirement age is unemployed . In addition, the person must be available for the labor market and be ready to accept any reasonable job. With reference to the availability paragraph 2 SGB III counts according to § 16 are not considered unemployed, who will participate in measures of the Federal Employment Agency (z. B. trainings, job opportunities ). Persons who are unable to work are also not taken into account .
Underemployment not included in the unemployment statistics
The official number of unemployed does not fully capture underemployment . The level of under-reporting varies depending on the definition of underemployment. The Institute for Employment Research (IAB) puts the difference between underemployment and officially registered unemployment in 2008 at 1.2 million people with a registered unemployment rate of around 3.3 million people. The underreporting consists of around 700,000 people in the silent reserve in measures and around 500,000 in the silent reserve in the narrower sense.
In July 2012, the number of all underemployed including those officially registered as unemployed in Germany was 7.4 million employable people according to an analysis by the Federal Statistical Office .
- Hidden unemployment (hidden reserve in measures) : It refers to all employable people without a job who do not appear statistically. In Germany, this includes, for example, unemployed people who take part in benefits for participation in working life , have a job with additional expense allowance or fall under the 58 rule (receipt of unemployment benefit without being available to the labor market as a preliminary stage to retirement). Likewise, all unemployed people who are looked after by private employment agencies are no longer included in the official unemployment statistics.
- Hidden unemployment : This is the situation when employees have a job for social or administrative reasons, but are not actually needed as workers for economic or business reasons. This formulation was used against the former " Eastern Bloc states " because officially there was full employment there. It was suspected, however, that many of these workers actually had little to do. Nowadays the term u. a. also applied to the state sector, in which workers made redundant by austerity measures cannot be dismissed for reasons of labor law and are "parked" in the central personnel surplus management (also job pool ).
- Hidden reserve : The hidden reserve includes people who are willing to take on gainful employment but are not officially registered as unemployed, for example because they are not entitled to unemployment benefits or benefits under SGB II and because unemployed people have withdrawn from the labor market discouraged or are only looking for certain jobs and therefore do not meet the availability criteria.
Hidden reserves and hidden unemployment are combined with the registered unemployed to form the underemployed . In addition to various economic research institutes, the Federal Employment Agency (through its research institute IAB ) and the trade unions show the number of underemployed people .
Since the correct definition of unemployment is controversial and cannot be clearly defined, the number of benefit recipients instead of the unemployed has come into focus, especially in SGB II. All recipients of social benefits according to SGB II are considered, regardless of whether they are unemployed, in a measure or not looking for work for other reasons.
Registered unemployed who are not looking for work
Registration with the employment agency as an unemployed person is a prerequisite for receiving unemployment benefits and other benefits under the Third Social Code . This is why people register as unemployed (and thus appear in the unemployment statistics) who do not meet the basic requirement of actively looking for work. You do this of your own free will or because there is no other possibility of social security. The latter applies to many of those affected and can be the case, for example, with older unemployed people whose pension application is pending, with people who have limited health or are not able to work at all , but who are still pending a report , or with people who have Approval of other services (such as medical or vocational rehabilitation services ) is currently being processed or has been provisionally rejected.
As a rule, the employment agency requires the recipient of benefits to provide evidence of applications and job interviews . Failure to provide evidence of active job search can lead to the unemployment benefit being blocked . These cases also fall out of the unemployment statistics.
Unemployment rate
The unemployment rate must be distinguished from the respective figures determined according to national criteria. The unemployment rate in Germany is determined by the Federal Statistical Office according to internationally comparable criteria of the ILO and published monthly as part of the “ILO labor market statistics ”. In principle, the calculation is the same as for the unemployment rate: The unemployment rate represents the share of unemployed in all economically active persons (consisting of employed and unemployed).
The study by the Federal Statistical Office does not know the differences between registered and unregistered unemployed. In contrast to the figures from the Federal Employment Agency, unregistered job seekers are also recorded here. According to the ILO statistics, anyone between the ages of 15 and 74 who is employed for less than one hour per week, who actively sought a job in the four weeks prior to the survey and is available for this work within two weeks is considered unemployed stands. The total number of unemployed is extrapolated using a sample. This means that the hidden reserve is automatically recorded, whereas marginally employed persons are eliminated. Likewise, unemployed people who have registered as unemployed solely to receive unemployment benefits. The number of unemployed at the Federal Statistical Office is mostly around one million below the number published by the Federal Employment Agency (unemployed in January 2005: 3.99 million, unemployed 5.04 million).
Seasonally adjusted number of unemployed
Because the number of unemployed, particularly due to layoffs in the construction and catering industry and in agriculture, fluctuates sharply with the season, the Federal Employment Agency also presents a seasonally adjusted unemployment figure in parallel to the number of unemployed in order to be able to determine seasonally independent trends. Seasonal influences are calculated based on years of experience. This seasonal adjustment is carried out by the Institute for Employment Research (IAB) .
Long-term unemployment
As long-term unemployed are unemployed in Germany who have been unemployed for a year or longer, § 18 SGB III .
Youth unemployment
Youth unemployment is a special case ; it is mostly related to young people from the end of compulsory schooling up to the age of 24 who are no longer in training.
Affected by unemployment and length of unemployment
The unemployment rate divides the number of unemployed by the number of employed persons, and harmonizes and averages these values. However, in order to be able to better record unemployment episodes, one defines an impact . Affected is the number of people who were registered as unemployed in the calendar year evaluated, generally at least one day. The extent to which they are affected is usually well above the average number of unemployed - here individual people are counted several times.
- For example, the average number of unemployed in Austria in 2010 was 105,700 people (according to ILO unemployment figure 188,200, unemployment rate 4.4%, according to Austrian usage 250,800 / 6.9%), but a total of 853,700 people were registered as unemployed for at least one day, i.e. affected by unemployment , with 528,700 during the year the way out of unemployment found (almost 2 / 3 of those affected), and 466,500 in unemployment fell (slight decrease in the unemployment rate). The size is therefore primarily a measure of the fluctuations in the labor market, i.e. job security.
On the basis of the affectedness one determines:
- Ø total duration = average duration of an unemployment episode
- Volume of unemployment = total number of unemployed days in the calendar year

This enables statements to be made about the extent of the quality of unemployment, i.e. whether interim between two jobs (frictional unemployment) , seasonal (regular fluctuation in seasonal industries), or long-term unemployment
- In Austria, for example, the average duration of unemployment in 2010 was 111 days, which shows a balance of the phenomena: As a tourist country, regular seasonal unemployment is traditionally high outside of the construction industry, but there are two off-seasons. The annual average number of employed persons was 3,360,200, the number of employees affected was 853,700, i.e. roughly one in four employees was unemployed - in fact, only 159,600 people were affected by long-term unemployment, 80% had the prospect of a short-term or seasonal job or were retraining .
With concern and duration, detailed statements can then be made about individual population groups or industries.
- In Austria today, for example, the level of concern decreases with increasing age, but the duration increases (around 140,000 / 70 days for 20–24 years and 60,000 / 120 days for 55–59 years): Young people enter an insecure but flexible labor market, older employees are little affected, but then difficult to transfer: professional experience seems to be in demand in working life, but not in the free labor market, which speaks in favor of individual stagnating industries in which hardly any jobs are created.
Cyclical and structural unemployment
By correlating the unemployment rate with general economic indicators , it is possible to determine the proportion of total unemployment that can be attributed to external influences on the labor market, i.e. increases when the economy weakens and disappears again when the economy picks up. The remaining part is structural, so it shows real weaknesses in the working world of individual countries or regions. In fact, the distinction is not easy; in the interim, there are regional deficits in reacting to economic fluctuations.
Unemployment figures
The national unemployment figures are only partially comparable internationally, as the ways in which the unemployment statistics are collected sometimes differ from one another. An exception is the statistics of the International Labor Organization (ILO), which randomly collects unemployment in the same way internationally.
The survey of unemployment statistics within a country can also differ in different time periods, which means that the figures can only be compared to a limited extent. For example, the number of unemployed in Germany in 2009 was (statistically) significantly reduced by no longer counting externally supervised unemployed people in the statistics.
Worldwide
The following table shows the unemployment rate according to the Labor Force Concept (LFC) of the International Labor Organization (ILO). Since this also counts unpaid family workers as economically active persons , the unemployment rate in the agrarian emerging and developing countries is naturally low (work without making money in the subsistence economy ). So there is no direct correlation between the ILO unemployment rate and general prosperity (measured, for example, in terms of gross national product ), nor poverty . The table is colored in 4 percent steps:
| from 24% | from 20 % | from 16% | from 12 % | from 8% | from 4 % | under 4% | other information / subtotals |
| Country | '08 | '07 | '06 | '05 | '00 | Cont. | |
|---|---|---|---|---|---|---|---|
|
|
7.9 | k. A. | 9.5 4 | 10.6 4 | 15.0 4 | America | G-20 |
|
|
k. A. | 6.1 | 5.8 / 6.6 | k. A. | k. A. / 5.0 | Asia | |
|
|
4.2 | 4.4 | 4.8 | 5.0 | 6.4 | Oz./Off. | G-20 |
|
|
k. A. | k. A. | k. A. | k. A. | k. A. | America | O-5 |
|
|
4.0 | 4.0 | 4.1 | 4.2 | 3.1 | Asia | O-5 |
|
|
3.3 | 4.0 | 4.1 | 5.0 | 4.6 | Europe | |
|
|
7.3 | 8.4 | 10.3 | 11.1 4 | (7.9) 3 | Europe | G-8 |
|
|
7.1 5 | 7.2 5 | 8.3 5 | 9.0 5 | 8.8 5 | Europe | |
|
|
7.4 | 8.0 | 8.8 | 8.9 | 8.5 | Europe | G-8 |
|
|
7.7 | 8.3 | 8.8 | 9.6 | 11.2 | Europe | |
|
|
k. A. | k. A. | k. A. | k. A. | 4.1 3 | Asia | O-5 |
|
|
8.4 | 9.1 | 11.3 | 11.2 3 | 6.1 | Asia | G-20 |
|
|
6.7 | 6.1 | 6.8 | 7.7 | 10.5 | Europe | G-8 |
|
|
4.0 | 3.9 | 4.1 | 4.5 | 4.7 | Asia | G-8 |
|
|
6.1 | 6.0 | 6.3 | 6.8 | 6.8 | America | G-8 |
|
|
(2,3) 6 | (2.9) 6 | (3.2) 6 | k. A. | k. A. | Europe | |
|
|
4.9 | 4.2 | (4.6) 4 | (4.4) 4 | (2.7) 4 | Europe | |
|
|
3.3 | 3.2 | 3.3 | 3.5 | 3.0 | Asia | |
|
|
3.5 | 3.4 | 3.2 | 3.5 | 2.6 | America | O-5 |
|
|
k. A. | k. A. | k. A. | k. A. | k. A. | America | |
|
|
4.2 | 3.7 | 3.8 | 3.8 | 5.3 | Oz./Off. | |
|
|
2.8 | 3.2 | 4.2 | 5.1 | 3.1 | Europe | |
|
|
2.5 | 2.5 | 3.4 4 | 4.6 | 3.4 | Europe | |
|
|
3.8 | 4.4 | 4.7 | 5.2 4 | 3.6 4 | Europe | |
|
|
7.2 | 7.3 | 8.0 | 7.8 4 | 11.2 4 | Asia | |
|
|
7.1 | 9.6 | 13.8 | 17.1 | 18.2 4 | Europe | |
|
|
5.8 | 6.4 | 7.3 | 7.2 | 7.1 4 | Europe | |
|
|
6.3 | 6.1 | 7.2 | 7.2 | 9.8 | As. / Eur. | G-8 |
|
|
5.1 | 5.7 | 6.3 3 | k. A. | 4.6 | Asia | G-20 |
|
|
6.2 | 6.1 | 5.4 | 6.0 4 | 4.7 4 | Europe | |
|
|
3.4 | 3.6 | 4.0 | 4.4 | 2.7 | Europe | |
|
|
4.0 | 4.0 | 4.5 | 5.6 | k. A. | Asia | |
|
|
11.3 | 8.3 | 8.5 | 9.2 4 | 13.9 4 | Europe | |
|
|
22.9 2 | 23.0 | 25.5 | 26.7 | 25.4 | Africa | O-5 |
|
|
3.2 | 3.2 | 3.5 | 3.7 | 4.4 2 | Asia | G-20 |
|
|
1.2 | 1.2 | 1.2 | 1.4 | 2.4 | Asia | |
|
|
11.0 | 10.3 | 9.9 | 10.3 | 6.5 | As. / Eur. | G-20 |
|
|
4.1 | 3.9 | 3.9 | 4.1 | 5.2 | Asia | |
|
|
5.8 | 4.6 | 4.6 | 5.1 | 4.0 | America | G-8 |
|
|
5.7 | 5.3 | 5.4 | 4.6 | 5.4 | Europe | G-8 |
- Source: ILO LABORSTA (consolidated data up to 2008)
- 2 appreciated by the ILO
- 3 based only on a month
- 4th System changed, only partially comparable
- 5 No LFC calculation, official values according to EUROSTAT
- 6th No LFC calculation, official estimates
European Union

The table is colored in 4 percent steps:
| from 24% | from 20 % | from 16% | from 12 % | from 8% | from 4 % | under 4% | other information / subtotals |
|
|
|||||||||||||
|---|---|---|---|---|---|---|---|---|---|---|---|---|---|
| # | country | July 2019 | June 2019 | Annual mean | |||||||||
| 2018 | 2017 | 2016 | 2015 | 2014 | 2013 | 2012 | 2011 | 2010 | 2009 | ||||
| 1 |
|
2.1% | 1.9% | 2.2% | 2.9% | 4.0% | 5.1% | 6.1% | 7.0% | 7.0% | 6.7% | 7.3% | 6.7% |
| ** |
|
n / A | 2.3% | 2.4% | 2.8% | 3.1% | 3.4% | 3.6% | 4.0% | 4.3% | 4.6% | 5.1% | 5.1% |
| 2 |
|
3.0% | 3.1% | 3.4% | 3.8% | 4.1% | 4.6% | 5.0% | 5.2% | 5.5% | 5.9% | 7.1% | 7.8% |
| 3 |
|
3.3% | 3.3% | 3.3% | 4.9% | 6.2% | 7.5% | 9.0% | 10.3% | 10.1% | 9.7% | 9.6% | 8.2% |
| 4th |
|
3.4% | 3.4% | 3.8% | 4.9% | 6.0% | 6.9% | 7.4% | 7.3% | 5.3% | 4.4% | 4.5% | 3.7% |
| 5 |
|
3.4% | 3.4% | 3.4% | 4.6% | 5.2% | 5.4% | 5.9% | 6.4% | 6.3% | 6.5% | 6.9% | 6.9% |
| 6th |
|
n / A | 3.5% | 3.7% | 4.2% | 5.1% | 6.8% | 7.7% | 10.2% | 10.9% | 10.9% | 11.2% | 10.0% |
| * |
|
n / A | 3.6% | 3.9% | 4.2% | 4.8% | 4.4% | 3.5% | 3.5% | 3.2% | 3.3% | 3.5% | 3.1% |
| 7th |
|
n / A | 3.6% (May 2019) | 4.4% | 4.4% | 4.9% | 5.3% | 6.2% | 7.5% | 7.9% | 8.0% | 7.8% | 7.6% |
| ** |
|
3.7% | 3.7% | 3.9% | 4.4% | 4.9% | 5.3% | 6.2% | 7.4% | 8.1% | 8.9% | 9.6% | 9.3% |
| 8th |
|
3.9% | 3.8% | 4.2% | 4.9% | 5.9% | 6.8% | 7.1% | 6.8% | 7.0% | 7.4% | 7.3% | 6.9% |
| 9 |
|
4.4% | 4.5% | 4.9% | 5.5% | 6.0% | 5.7% | 5.6% | 5.4% | 4.3% | 4.2% | 4.4% | 4.8% |
| 10 |
|
4.5% | 4.5% | 5.1% | 6.6% | 8.0% | 9.0% | 9.7% | 10.1% | 8.9% | 8.2% | 7.3% | 5.9% |
| 11 |
|
4.5% | 4.5% | 5.2% | 6.2% | 7.6% | 9.2% | 11.4% | 13.0% | 12.3% | 11.3% | 10.2% | 6.8% |
| 12 |
|
4.6% | 4.6% | 5.0% | 5.7% | 6.2% | 6.2% | 6.6% | 7.0% | 7.5% | 7.6% | 7.4% | 6.0% |
| 13 |
|
n / A | 4.6% | 5.4% | 5.8% | 6.8% | 6.2% | 7.4% | 8.6% | 10.0% | 12.5% | 16.9% | 13.8% |
| 14th |
|
5.3% | 5.3% | 5.8% | 6.7% | 7.9% | 9.4% | 11.3% | 13.1% | 14.7% | 14.7% | 13.7% | 11.9% |
| 15th |
|
5.3% | 5.4% | 6.5% | 8.1% | 9.7% | 11.5% | 13.2% | 14.2% | 14.0% | 13.7% | 14.4% | 12.0% |
| 16 |
|
5.7% | 5.6% | 6.0% | 7.1% | 7.8% | 8.5% | 8.5% | 8.4% | 7.6% | 7.2% | 8.3% | 7.9% |
| 17th |
|
5.7% | 5.7% | 5.5% | 5.6% | 6.3% | 6.5% | 5.9% | 5.9% | 5.1% | 4.8% | 4.6% | 5.1% |
|
to 2013 EU27 |
6.3% | 6.3% | 6.8% | 7.6% | 8.5% | 9.4% | 10.2% | 10.9% | 10.4% | 9.7% | 9.7% | 9.0% | |
| 18th |
|
6.4% | 6.2% | 6.2% | 7.1% | 7.9% | 9.1% | 10.7% | 11.8% | 13.4% | 15.3% | 17.8% | 13.7% |
| 19th |
|
6.5% | 6.5% | 7.4% | 8.7% | 9.6% | 9.9% | 9.9% | 11.9% | 15.0% | 16.2% | 18.7% | 17.1% |
| 20th |
|
6.5% | 6.6% | 7.0% | 9.0% | 11.2% | 12.6% | 14.1% | 16.4% | 15.8% | 12.9% | 12.0% | 10.6% |
| 21st |
|
6.7% | 6.6% | 7.4% | 8.6% | 8.8% | 9.4% | 8.7% | 8.2% | 7.7% | 7.8% | 8.4% | 8.2% |
| 22nd |
|
7.0% | 7.2% | 8.4% | 11.1% | 13.0% | 15.0% | 16.1% | 15.9% | 11.9% | 7.9% | 6.2% | 5.3% |
| 23 |
|
7.1% | 6.7% | 6.3% | 6.7% | 6.9% | 7.4% | 7.9% | 8.0% | 8.0% | 7.8% | 8.4% | 8.3% |
| 24 |
|
7.1% | 7.1% | 8.4% | 11.1% | 13.3% | 16.1% | 17.3% | 17.3% | 16.1% | n / A | ||
| 25th |
|
8.5% | 8.5% | 9.1% | 9.4% | 10.1% | 10.4% | 10.3% | 10.3% | 9.8% | 9.6% | 9.8% | 9.5% |
| 26th |
|
9.9% | 9.8% | 10.6% | 11.2% | 11.7% | 11.9% | 12.7% | 12.1% | 10.7% | 8.4% | 8.4% | 7.8% |
|
|
n / A | 10.5% | 11.1% | 10.6% | 9.7% | 9.6% | 9.2% | ||||||
| 27 |
|
13.9% | 14.0% | 15.3% | 17.2% | 19.6% | 22.1% | 24.5% | 26.1% | 24.8% | 21.7% | 20.1% | 18.0% |
| 28 |
|
n / A | 17.2% (May 2019) | 19.3% | 21.5% | 23.6% | 24.9% | 26.5% | 27.5% | 24.5% | 17.7% | 12.6% | 9.5% |
* Not a member of the EU, but part of the European Economic Area . ** Neither an EU member nor part of the European Economic Area, but listed as a leading industrial country by comparison.
Note: If the latest data is not available, the classification is based on the most recent available, listed data.
source
| country | '85 | <25 | ≥25 | '90 | <25 | ≥25 | '95 | <25 | ≥25 | 2000 | <25 | ≥25 | 2008 | <25 | ≥25 | 2011 | <25 | ≥25 | |||||||||||||||
|---|---|---|---|---|---|---|---|---|---|---|---|---|---|---|---|---|---|---|---|---|---|---|---|---|---|---|---|---|---|---|---|---|---|
|
|
11.3 | 23.6 | 9.0 | 7.3 | ↓ | 14.5 | ↓ | 6.2 | ↓ | 9.3 | ↑ | 21.5 | ↑ | 7.9 | ↑ | 8.4 | ↓ | 23.0 | ↑ | 6.9 | ↓ | - | 18.0 | 5.9 | - | 18.7 | ↑ | 6.1 | ↑ | ||||
|
|
7.8 | 11.5 | 6.8 | 8.3 | ↑ | 11.5 | - | 7.6 | ↑ | 7.0 | ↓ | 9.9 | ↓ | 6.3 | ↓ | 5.0 | ↓ | 8.4 | ↓ | 4.4 | ↓ | - | 8.0 | 2.6 | - | 14.2 | ↑ | 6.5 | ↑ | ||||
|
|
6.9 | 9.8 | 6.1 | 4.9 | ↓ | 4.6 | ↓ | 5.0 | ↓ | 8.2 | ↑ | 8.5 | ↑ | 8.1 | ↑ | 8.2 | - | 9.0 | ↑ | 8.0 | ↓ | - | 10.6 | 7.2 | - | 8.6 | ↓ | 5.7 | ↓ | ||||
|
|
5.0 | 9.1 | 4.2 | 3.4 | ↓ | 6.4 | ↓ | 2.9 | ↓ | 17.0 | ↑ | 41.2 | ↑ | 13.8 | ↑ | 9.6 | ↓ | 21.4 | ↓ | 7.8 | ↓ | - | 16.5 | 5.0 | - | 20.1 | ↑ | 6.2 | ↑ | ||||
|
|
10.3 | 25.8 | 7.2 | 9.4 | ↓ | 19.8 | ↓ | 7.7 | ↑ | 11.9 | ↑ | 27.1 | ↑ | 10.1 | ↑ | 8.9 | ↓ | 18.8 | ↓ | 7.8 | ↓ | - | 18.6 | 6.1 | - | 22.1 | ↑ | 7.9 | ↑ | ||||
|
|
7.8 | 23.9 | 5.2 | 7.0 | ↓ | 23.2 | ↓ | 4.4 | ↓ | 9.1 | ↑ | 27.9 | ↑ | 6.5 | ↑ | - | - | - | - | 22.1 | 6.7 | - | 44.4 | ↑ | 16.0 | ↑ | |||||||
|
|
11.5 | 18.2 | 9.5 | 7.0 | ↓ | 10.4 | ↓ | 6.1 | ↓ | 8.7 | ↑ | 15.5 | ↑ | 7.4 | ↑ | 8.5 | ↓ | 12.6 | ↓ | 4.2 | ↓ | - | 15.0 | 4.0 | - | 21.1 | ↑ | 5.9 | ↑ | ||||
|
|
18.0 | 25.1 | 15.4 | 14.1 | ↓ | 19.8 | ↓ | 12.5 | ↓ | 12.0 | ↓ | 19.0 | ↓ | 10.3 | ↓ | 4.1 | ↓ | 5.6 | ↓ | 3.8 | ↓ | - | 12.7 | 5.0 | - | 29.4 | ↑ | 13.0 | ↑ | ||||
|
|
9.5 | 32.2 | 4.5 | 9.8 | ↑ | 29.0 | ↓ | 5.9 | ↑ | 11.8 | ↑ | 32.8 | ↑ | 8.4 | ↑ | 10.7 | ↓ | 31.9 | ↓ | 7.9 | ↓ | - | 21.3 | 5.6 | - | 29.1 | ↑ | 7.0 | ↑ | ||||
|
|
3.0 | 6.5 | 2.0 | 1.6 | ↓ | 3.6 | ↓ | 1.3 | ↓ | 2.9 | ↑ | 7.2 | ↑ | 2.3 | ↑ | 2.1 | ↓ | 5.7 | ↓ | 1.7 | ↓ | - | 17.9 | 4.0 | - | 16.8 | ↓ | 4.1 | ↑ | ||||
|
|
10.5 | 17.7 | 8.7 | 7.8 | ↓ | 11.4 | ↓ | 6.8 | ↓ | 7.2 | ↓ | 12.1 | ↑ | 6.1 | ↓ | 2.8 | ↓ | 5.1 | ↓ | 2.4 | ↓ | - | 5.3 | 2.2 | - | 7.6 | ↑ | 3.8 | ↑ | ||||
|
|
- | - | - | - | - | - | 4.3 | 5.9 | 4.1 | 3.2 | ↓ | 4.4 | ↓ | 3.0 | ↓ | - | 8.0 | 3.2 | - | 8.3 | ↑ | 3.5 | ↑ | ||||||||||
|
|
- | - | - | 4.7 | 10.4 | 3.2 | 7.1 | ↑ | 16.0 | ↑ | 5.5 | ↑ | 4.1 | ↓ | 8.5 | ↓ | 3.4 | ↓ | - | 16.4 | 7.2 | - | 30.1 | ↑ | 11.8 | ↑ | |||||||
|
|
2.8 | 5.8 | 2.3 | 1.7 | ↓ | 3.8 | ↓ | 1.3 | ↓ | 8.1 | ↑ | 19.0 | ↑ | 6.7 | ↑ | 5.6 | ↓ | 10.5 | ↓ | 5.0 | ↓ | - | 20.2 | 4.2 | - | 22.9 | ↑ | 5.3 | ↑ | ||||
|
|
- | - | - | 16.3 | 31.8 | 12.4 | 22.7 | ↑ | 41.7 | ↑ | 18.7 | ↑ | 13.6 | ↓ | 25.0 | ↓ | 11.6 | ↓ | - | 24.6 | 9.8 | - | 46.4 | ↑ | 19.5 | ↑ | |||||||
|
|
- | - | - | - | - | - | - | - | - | - | - | - | - | 9.9 | 4.0 | - | 18.0 | ↑ | 5.9 | ↑ | |||||||||||||
|
|
- | - | - | - | - | - | - | - | - | - | - | - | - | 17.3 | 6.0 | - | 25.8 | ↑ | 8.1 | ↑ | |||||||||||||
|
|
- | - | - | - | - | - | - | - | - | - | - | - | - | 7.0 | 2.8 | - | 7.7 | ↑ | 3.6 | ↑ |

Germany
For the unemployment figures in Germany, it must be taken into account that the definition of unemployment by the Federal Employment Agency differs considerably from the Eurostat definition (ILO labor market statistics). Unemployment figures from Germany are therefore hardly suitable for a comparison with other countries.
So were z. B. already introduced in January 2008 § 53a SGB II, according to which employable people in need of assistance who have received basic security benefits for jobseekers for at least twelve months after they have reached the age of 58 without being offered employment subject to social insurance contributions after expiry are not considered unemployed during this period. In 2016 there were 162,600 people.
In addition, all participants in labor market policy measures do not appear in the unemployment statistics, including unemployed people who are not sick, those in further training or those whose benefits have been sanctioned.
Due to the constantly changing way of counting, not even the figures from the last few years are essentially comparable. In 2009, the regulation was added that unemployed people are not counted for whom private employment agencies work on the basis of a voucher.
Current unemployment figures for Germany
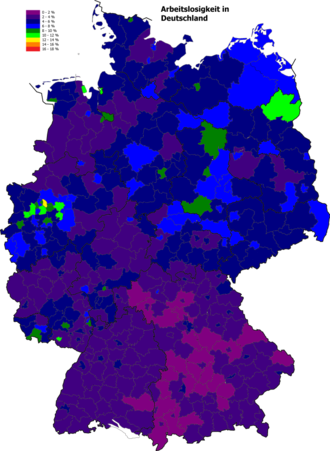
- Unemployment in the districts
October 2019
Federal: 4.8%
West: 4.6%
East: 6.1%
October 2018
Federal Government: 4.9%
West: 4.5%
East: 6.4%
October 2017
Federal Government: 5.4%
West: 5.0%
East: 7.0%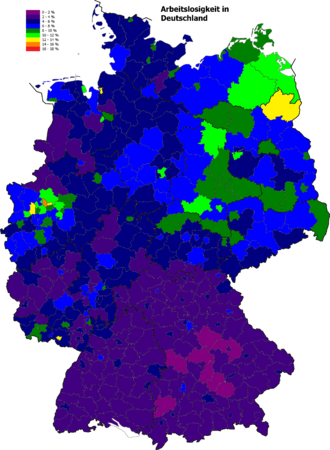
October 2016
Federal Government: 5.8%
West: 5.3%
East: 7.7%
October 2015
Federal Government: 6.0%
West: 5.5%
East: 8.6%
October 2014
Federal: 6.3%
West: 5.6%
East: 9.0%
October 2013
Federal Government: 6.5%
West: 5.8%
East: 9.5%
October 2012
Federal Government: 6.5%
West: 5.6%
East: 10.2%
October 2011
Federal Government: 7.0%
West: 6.1%
East: 10.7%
October 2010
Federal Government: 7.7%
West: 6.6%
East: 11.8%


Regional focal points of unemployment in Germany are primarily the Ruhr area on the one hand and the rural-peripheral regions in parts of eastern Germany on the other. Furthermore, some cities that have been severely affected by structural change are characterized by high local unemployment, such as Bremerhaven and Pirmasens . Areas with very low unemployment are mainly the rural regions in Bavaria, Baden-Württemberg and parts of Hesse, Lower Saxony and Rhineland-Palatinate. The number of unemployed in rural areas (in western and eastern Germany) has fallen particularly sharply due to demographic change and the declining number of economically active people in these areas.
The table is colored in 4 percent steps:
| from 24% | from 20 % | from 16% | from 12 % | from 8% | from 4 % | under 4% | other information / subtotals |
| # | country | East West | October 2019 | September 2019 | ||
|---|---|---|---|---|---|---|
| Unemployed | Quota | Unemployed | Quota | |||
| 1 |
|
west | 200,516 | 2.7% | 209,469 | 2.8% |
| 2 |
|
west | 198.200 | 3.2% | 202.775 | 3.2% |
| 3 |
|
west | 94,651 | 4.2% | 95,480 | 4.2% |
| 4th |
|
west | 146,519 | 4.3% | 146.752 | 4.3% |
| 5 |
|
west | 76,237 | 4.8% | 76,296 | 4.8% |
| 6th |
|
west | 210.144 | 4.8% | 212,807 | 4.9% |
| 7th |
|
east | 55,814 | 5.0% | 56,574 | 5.1% |
| 8th |
|
east | 109,124 | 5.1% | 110,851 | 5.2% |
| 9 |
|
east | 72,381 | 5.4% | 72,788 | 5.5% |
| 10 |
|
west | 64,377 | 6.1% | 64,593 | 6.2% |
| 11 |
|
west | 33,260 | 6.2% | 33,343 | 6.2% |
| 12 |
|
west | 626.191 | 6.4% | 635.034 | 6.5% |
| 13 |
|
east | 53,474 | 6.5% | 53,149 | 6.5% |
| 14th |
|
east | 74,898 | 6.7% | 75,760 | 6.7% |
| 15th |
|
east | 152.289 | 7.8% | 152.366 | 7.8% |
| 16 |
|
west | 36,015 | 10.0% | 35,993 | 10.0% |
| East Germany | 517.980 | 6.1% | 521.488 | 6.1% | ||
| West Germany | 1,686,110 | 4.6% | 1,712,542 | 4.6% | ||
|
|
2,204,090 | 4.8% | 2,234,030 | 4.9% | ||
Source current
Source comparative figures (as of October 2019)
Development of the unemployment rate in Germany
The unemployment rate in Germany has developed as follows since 1960. Source: Federal Employment Agency (BA). The values up to 1990 are only those for western Germany, those from 1991 onwards for the whole of Germany (eastern and western Germany).

The unemployment rate in Germany then fell continuously from 2013 to 2017: it was 6.9% (2013), 6.7% (2014), 6.4% (2015), 6.1% (2016) and 5, 7% (2017) - lower values were last reached in the early 1980s.
At the same time, one should consider the work volume per capita in Germany. It fell 30 percent between 1960 and 2010.
Historical figures on unemployment in Germany

The following table shows the registered unemployed, the unemployment rate and the working hours in Germany since 1950 (annual average).
The official working time (published by the Federal Statistical Office) is given as the average annual working time of the employees (AZ = volume of work by number of employees).
The average annual working time of the labor force can be specified as AZ * = volume of work divided by the number of labor force.
The unemployment rate is defined as follows:

From this follows the average working hours of the labor force:

| Registered unemployed and unemployment rate by area | ||||||||||||
| year | Germany | West Germany | East Germany | |||||||||
| number | Rate in% | AZ in h | AZ * in h | number | Rate in% | AZ in h | AZ * in h | number | Rate in% | AZ in h | AZ * in h | |
| 2018 | 2,340,082 | 5.2 | 1,758,627 | 4.8 | 581,455 | 6.9 | ||||||
| 2017 | 2,532,837 | 5.7 | 1,894,294 | 5.3 | 638,543 | 7.6 | ||||||
| 2016 | 2,690,975 | 6.1 | 1,978,672 | 5.6 | 712.303 | 8.5 | ||||||
| 2015 | 2,794,664 | 6.4 | 2,020,503 | 5.7 | 774.162 | 9.2 | ||||||
| 2014 | 2,898,388 | 6.7 | 2,074,553 | 5.9 | 823 835 | 9.8 | ||||||
| 2013 | 2,950,338 | 6.9 | 2,080,342 | 6.0 | 869.995 | 10.3 | ||||||
| 2012 | 2,896,985 | 6.8 | 1,999,837 | 5.9 | 897.148 | 10.7 | ||||||
| 2011 | 2,980,000 | 7.1 | 2,020,087 | 6.0 | 949.749 | 11.3 | ||||||
| 2010 | 3,244,470 | 7.7 | 2,231,694 | 6.6 | 1,012,775 | 12.0 | ||||||
| 2009 | 3,423,283 | 8.2 | 2.320.209 | 6.9 | 1,103,074 | 13.0 | ||||||
| 2008 | 3,267,907 | 7.8 | 2,144,651 | 6.4 | 1,123,256 | 13.1 | ||||||
| 2007 | 3,773,691 | 10.1 | 1432.6 | 1287.9 | 2,484,283 | 8.4 | 1,289,408 | 16.8 | ||||
| 2006 | 4,486,940 | 12.0 | 1432.6 | 1260.7 | 3,006,952 | 10.2 | 1,479,988 | 19.2 | ||||
| 2005 | 4,860,234 | 13.0 | 1435.0 | 1248.4 | 3,246,097 | 11.0 | 1,614,137 | 20.6 | ||||
| 2004 | 4,381,042 | 11.7 | 1441.8 | 1273.1 | 2,781,347 | 9.4 | 1425.7 | 1291.7 | 1,599,695 | 20.1 | 1463.9 | 1169.7 |
| 2003 | 4,376,028 | 11.6 | 1438.8 | 1271.9 | 2,752,589 | 9.3 | 1424.3 | 1291.8 | 1,623,439 | 20.1 | 1467.4 | 1172.5 |
| 2002 | 4,060,317 | 10.8 | 1441.1 | 1285.5 | 2,497,678 | 8.5 | 1421.4 | 1300.6 | 1,562,639 | 19.2 | 1467.1 | 1185.4 |
| 2001 | 3,852,564 | 10.4 | 1453.7 | 1302.5 | 2,320,500 | 8.0 | 1431.4 | 1316.9 | 1,532,064 | 18.8 | 1482.9 | 1204.1 |
| 2000 | 3,889,695 | 10.7 | 1467.9 | 1310.8 | 2,380,987 | 8.4 | 1442.5 | 1321.3 | 1,508,707 | 18.6 | 1505.3 | 1225.3 |
| 1999 | 4,100,499 | 11.7 | 1486.2 | 1312.3 | 2,604,720 | 9.6 | 1456.7 | 1316.9 | 1,495,779 | 18.7 | 1528.0 | 1242.3 |
| 1998 | 4,280,630 | 12.3 | 1497.8 | 1313.6 | 2,751,535 | 10.3 | 1465.4 | 1314.5 | 1,529,095 | 19.2 | 1543.9 | 1247.5 |
| 1997 | 4,384,456 | 12.7 | 1503.5 | 1312.6 | 2,870,021 | 10.8 | 1471.4 | 1312.5 | 1,514,435 | 19.1 | 1553.8 | 1257.0 |
| 1996 | 3,965,064 | 11.5 | 1513.0 | 1339.0 | 2,646,442 | 9.9 | 1477.4 | 1331.1 | 1,318,622 | 16.6 | 1565.8 | 1305.9 |
| 1995 | 3,611,921 | 10.4 | 1529.3 | 1370.3 | 2,427,083 | 9.1 | 1494.4 | 1358.4 | 1,184,838 | 14.8 | 1593.1 | 1357.3 |
| 1994 | 3,698,057 | 10.6 | 1513.0 | 1352.6 | 2,426,276 | 9.0 | 1506.5 | 1370.9 | 1,271,781 | 15.7 | 1629.2 | 1373.4 |
| 1993 | 3,419,141 | 9.8 | 1529.3 | 1379.4 | 2,149,465 | 8.0 | 1506.1 | 1385.6 | 1,269,676 | 15.4 | 1648.0 | 1394.2 |
| 1992 | 2,978,570 | 8.5 | 1543.4 | 1412.2 | 1,699,273 | 6.4 | 1531.7 | 1433.7 | 1,279,297 | 14.4 | 1642.7 | 1406.2 |
| 1991 | 2,602,203 | 7.3 | 1546.3 | 1433.4 | 1,596,457 | 6.2 | 1542.3 | 1446.7 | 1,005,746 | 10.2 | 1497.6 | 1344.8 |
| 1990 | - | - | - | - | 1,883,147 | 7.2 | 1566.0 | 1453.2 | - | - | - | - |
| 1989 | - | - | - | - | 2,037,781 | 7.9 | 1589.1 | 1463.6 | - | - | - | - |
| 1988 | - | - | - | - | 2,241,556 | 8.7 | 1612.5 | 1472.2 | - | - | - | - |
| 1987 | - | - | - | - | 2,228,788 | 8.9 | 1617.6 | 1473.6 | - | - | - | - |
| 1986 | - | - | - | - | 2,228,004 | 9.0 | 1639.5 | 1491.5 | - | - | - | - |
| 1985 | - | - | - | - | 2,304,014 | 9.3 | 1658.5 | 1504.3 | - | - | - | - |
| 1984 | - | - | - | - | 2,265,559 | 9.1 | 1680.8 | 1527.8 | - | - | - | - |
| 1983 | - | - | - | - | 2,258,235 | 9.1 | 1691.6 | 1537.7 | - | - | - | - |
| 1982 | - | - | - | - | 1,833,244 | 7.5 | 1702.1 | 1574.4 | - | - | - | - |
| 1981 | - | - | - | - | 1,271,574 | 5.5 | 1716.8 | 1622.4 | - | - | - | - |
| 1980 | - | - | - | - | 888,900 | 3.8 | 1739.1 | 1673.0 | - | - | - | - |
| 1979 | - | - | - | - | 876.137 | 3.8 | 1758.4 | 1691.6 | - | - | - | - |
| 1978 | - | - | - | - | 992.948 | 4.3 | 1771.9 | 1695.7 | - | - | - | - |
| 1977 | - | - | - | - | 1,029,995 | 4.5 | 1794.1 | 1713.4 | - | - | - | - |
| 1976 | - | - | - | - | 1,060,336 | 4.6 | 1809.4 | 1726.2 | - | - | - | - |
| 1975 | - | - | - | - | 1,074,217 | 4.7 | 1797.1 | 1712.6 | - | - | - | - |
| 1974 | - | - | - | - | 582,481 | 2.6 | 1836.5 | 1788.8 | - | - | - | - |
| 1973 | - | - | - | - | 273,498 | 1.2 | 1869.5 | 1847.1 | - | - | - | - |
| 1972 | - | - | - | - | 246,433 | 1.1 | 1899.8 | 1878.9 | - | - | - | - |
| 1971 | - | - | - | - | 185.072 | 0.8 | 1924.7 | 1909.3 | - | - | - | - |
| 1970 | - | - | - | - | 148,846 | 0.7 | 1956.4 | 1942.7 | - | - | - | - |
| 1969 | - | - | - | - | 178,579 | 0.9 | 1971.7 | 1954.0 | - | - | - | - |
| 1968 | - | - | - | - | 323,480 | 1.5 | 1991.3 | 1961.4 | - | - | - | - |
| 1967 | - | - | - | - | 459.489 | 2.1 | 2003.7 | 1961.6 | - | - | - | - |
| 1966 | - | - | - | - | 161.059 | 0.7 | 2041.1 | 2026.8 | - | - | - | - |
| 1965 | - | - | - | - | 147.352 | 0.7 | 2067.2 | 2052.7 | - | - | - | - |
| 1964 | - | - | - | - | 169.070 | 0.8 | 2081.3 | 2064.6 | - | - | - | - |
| 1963 | - | - | - | - | 185,646 | 0.8 | 2069.9 | 2053.3 | - | - | - | - |
| 1962 | - | - | - | - | 154,523 | 0.7 | 2100.1 | 2085.4 | - | - | - | - |
| 1961 | - | - | - | - | 180.855 | 0.8 | 2136.9 | 2119.8 | - | - | - | - |
| 1960 | - | - | - | - | 270,678 | 1.3 | 2163.3 | 2135.2 | 7.107 | 0.1 | - | - |
| 1959 | - | - | - | - | 539.942 | 2.6 | - | - | 10,433 | 0.1 | - | - |
| 1958 | - | - | - | - | 763,850 | 3.7 | - | - | 16.198 | 0.2 | - | - |
| 1957 | - | - | - | - | 753.711 | 3.7 | - | - | 37,914 | 0.5 | - | - |
| 1956 | - | - | - | - | 876.287 | 4.4 | - | - | 40,763 | 0.5 | - | - |
| 1955 | - | - | - | - | 1,073,576 | 5.6 | - | - | 43,634 | 0.5 | - | - |
| 1954 | - | - | - | - | 1,410,717 | 7.6 | - | - | 54,277 | 0.7 | - | - |
| 1953 | - | - | - | - | 1,491,000 | 8.4 | - | - | 90,876 | 1.1 | - | - |
| 1952 | - | - | - | - | 1,651,915 | 9.5 | - | - | 107.162 | 1.3 | - | - |
| 1951 | - | - | - | - | 1,713,887 | 10.4 | - | - | 243.351 | 3.0 | - | - |
| 1950 | - | - | - | - | 1,868,504 | 11.0 | - | - | 325,400 | 4.1 | - | - |
Source:.
Criticism of the official statistics
Hans Jörg Duppré from the German District Association criticized in April 2010 that the supposed positive development on the labor market was a mirage, as the number of ALG II recipients had risen steadily. In April 2010, the number of beneficiaries rose to around 7.4 million, but the unemployment statistics only include around 2.5 million people.
It was also criticized that the number of Hartz IV recipients has so far been narrowed to the long-term unemployed. Already purely subsidized posts with more than 15 hours per week, such as B. One-euro jobs , sick people or those looking for apprenticeships, for example, are not found in the unemployment statistics, although their situation is often no better. The same applies to workers in the low-wage sector who are also dependent on Hartz IV. Likewise, unemployed people who take part in further training have not been counted as unemployed for a long time. Unemployed people older than 58 do not appear in the official statistics either. Another exception was added in May 2009: If private employment agencies are employed, the unemployed person they look after does not appear in the unemployment statistics either. The Institute for Employment Research (IAB) and the Federal Statistical Office determined a so-called “ hidden reserve ”. This means participants in the qualification and further training measures of labor market policy as well as all those who want to work but do not appear in the statistics. According to estimates by both institutes, the so-called “hidden reserve” amounts to around 1.1 to 1.4 million additional unemployed.
It is also criticized that the increased use of temporary work by the Federal Employment Agency significantly reduces the actual number of unemployed. In 2012 there were already around 1 million employees in temporary employment agencies. Unemployed people can end their unemployment with it, even with low qualifications, but, contrary to the often propagated sticking effect , temporary work rarely proves to be a stepping stone into a regular job. According to an IAB study, only a small proportion of previously unemployed people succeed in making the move from temporary work to conventional employment for a period of two years after being hired out. Employees at temporary employment agencies no longer appear in the unemployment statistics, but this only has a temporary effect for the majority. Instead of a takeover rate of around 30%, a value of 7% is now considered realistic.
Austria
The following figures were calculated using the national Austrian method. This means that the unemployed registered with the employment office are put in relation to the employed persons registered with the Main Association of Social Insurance Institutions (HV). This calculation method differs fundamentally from the LF concept .
The table is colored in 4 percent steps:
| from 24% | from 20 % | from 16% | from 12 % | from 8% | from 4 % | under 4% | other information / subtotals |
| country | 2016 | 2015 | 2014 | 2013 | 2012 | |||||
|---|---|---|---|---|---|---|---|---|---|---|
| Unemployed | Quota | Unemployed | Quota | Unemployed | Quota | Unemployed | Quota | Unemployed | Quota | |
|
|
10.306 | 9.3% | 10,263 | 9.3% | 9,598 | 8.9% | 9,085 | 8.5% | 8,149 | 7.8% |
|
|
25,463 | 10.9% | 25,670 | 11.1% | 24,666 | 10.8% | 23,330 | 10.2% | 20,853 | 9.1% |
|
|
59,851 | 9.1% | 58,522 | 9.1% | 53,608 | 8.4% | 48,950 | 7.8% | 44,461 | 7.1% |
|
|
41,716 | 6.1% | 41,192 | 6.1% | 37,483 | 5.7% | 33,270 | 5.1% | 28,995 | 4.7% |
|
|
14,870 | 5.6% | 15,450 | 5.9% | 14,672 | 5.7% | 13.114 | 5.1% | 11,894 | 4.7% |
|
|
44,388 | 8.2% | 44,461 | 8.3% | 41,858 | 7.9% | 38,708 | 7.4% | 35.101 | 6.8% |
|
|
22,276 | 6.4% | 23,845 | 7.0% | 23,242 | 6.9% | 21,190 | 6.4% | 19,329 | 5.9% |
|
|
10,067 | 5.9% | 10,243 | 6.1% | 9,827 | 6.0% | 9,331 | 5.8% | 8,845 | 5.6% |
|
|
128,375 | 13.6% | 124,685 | 13.5% | 104,404 | 11.6% | 90.230 | 10.2% | 83.016 | 9.5% |
|
|
357.313 | 9.1% | 354,332 | 9.1% | 319.357 | 8.4% | 287.207 | 7.6% | 260,643 | 7.0% |
Source: Public Employment Service Austria
Switzerland
In Switzerland, too, the statistics do not include everyone who is out of work, (also) because they do not register as unemployed - "In Switzerland there are twice as many unemployed as there are registered, almost 5 percent of the population," they said NZZ in August 2018.
The table is colored in 4 percent steps:
| from 24% | from 20 % | from 16% | from 12 % | from 8% | from 4 % | under 4% | other information / subtotals |
| Canton | Unemployed | Unemployment rate |
|---|---|---|
|
|
10,116 | 4.3% |
|
|
3,684 | 4.0% |
|
|
14'022 | 3.5% |
|
|
1,243 | 3.4% |
|
|
3,131 | 3.2% |
|
|
1,333 | 3.1% |
|
|
4,713 | 2.8% |
|
|
4,429 | 2.5% |
|
|
8,919 | 2.5% |
|
|
4,122 | 2.5% |
|
|
18,895 | 2.3% |
|
|
1,445 | 2.1% |
|
|
2,865 | 2.0% |
|
|
2,921 | 2.0% |
|
|
5'232 | 1.9% |
|
|
2,877 | 1.9% |
|
|
9,809 | 1.7% |
|
|
3,577 | 1.6% |
|
|
346 | 1.5% |
|
|
462 | 1.5% |
|
|
1'511 | 1.4% |
|
|
1,077 | 1.2% |
|
|
236 | 1.0% |
|
|
141 | 0.7% |
|
|
155 | 0.7% |
|
|
54 | 0.6% |
| German Switzerland | 64,986 | 2.0% |
| French-speaking Switzerland and Ticino | 42,329 | 3.3% |
| 107,315 | 2.4% |
| Canton | 1990 | 1991 | 1992 | 1993 | 1994 | 1995 | 1996 | 1997 | 1998 | 1999 | 2000 | 2001 | 2002 | 2003 | 2004 | 2005 | 2006 |
|---|---|---|---|---|---|---|---|---|---|---|---|---|---|---|---|---|---|
| Total | 0.5 | 1.1 | 2.5 | 4.5 | 4.7 | 4.2 | 4.7 | 5.2 | 3.9 | 2.7 | 1.8 | 1.7 | 2.5 | 3.7 | 3.9 | 3.8 | 3.3 |
|
|
0.3 | 0.7 | 2.1 | 4.1 | 4.5 | 4.0 | 4.3 | 5.2 | 4.2 | 2.9 | 1.8 | 1.7 | 3.0 | 4.5 | 4.5 | 4.0 | 3.3 |
|
|
0.3 | 0.6 | 2.0 | 3.9 | 4.1 | 3.5 | 3.9 | 4.4 | 2.9 | 1.9 | 1.3 | 1.2 | 1.8 | 2.8 | 2.9 | 2.8 | 2.5 |
|
|
0.3 | 0.7 | 1.9 | 3.6 | 3.6 | 3.2 | 4.0 | 4.3 | 2.9 | 1.9 | 1.3 | 1.2 | 2.0 | 3.1 | 3.2 | 3.1 | 2.7 |
|
|
0.0 | 0.2 | 0.8 | 1.6 | 1.6 | 1.6 | 2.3 | 2.4 | 1.5 | 1.0 | 0.5 | 0.4 | 0.7 | 1.1 | 1.2 | 1.3 | 1.1 |
|
|
0.1 | 0.4 | 1.2 | 2.4 | 2.3 | 2.0 | 2.9 | 2.8 | 2.1 | 1.5 | 0.7 | 0.6 | 1.2 | 2.1 | 2.3 | 2.3 | 2.0 |
|
|
0.1 | 0.3 | 0.8 | 2.0 | 2.0 | 1.7 | 2.1 | 2.3 | 1.4 | 0.6 | 0.4 | 0.5 | 1.0 | 1.6 | 1.7 | 1.6 | 1.5 |
|
|
0.2 | 0.4 | 1.8 | 3.1 | 2.7 | 2.1 | 2.5 | 2.6 | 1.5 | 0.6 | 0.4 | 0.6 | 1.1 | 1.9 | 1.9 | 2.0 | 1.6 |
|
|
0.1 | 0.4 | 1.3 | 2.3 | 2.0 | 2.0 | 3.3 | 2.9 | 2.0 | 1.5 | 0.9 | 0.7 | 1.6 | 2.3 | 2.4 | 2.5 | 2.3 |
|
|
0.3 | 0.7 | 2.0 | 3.8 | 3.5 | 2.8 | 3.4 | 3.9 | 3.1 | 2.3 | 1.1 | 1.4 | 2.7 | 3.6 | 3.4 | 3.2 | 2.5 |
|
|
0.5 | 1.1 | 2.6 | 5.0 | 5.9 | 5.2 | 4.8 | 4.7 | 3.7 | 2.5 | 1.5 | 1.3 | 1.8 | 2.7 | 2.9 | 3.1 | 3.0 |
|
|
0.2 | 0.7 | 2.5 | 4.6 | 4.4 | 3.5 | 4.6 | 6.0 | 3.7 | 2.5 | 1.6 | 1.4 | 2.3 | 3.3 | 3.6 | 3.4 | 2.9 |
|
|
1.2 | 1.9 | 3.6 | 5.5 | 5.7 | 4.9 | 4.7 | 4.9 | 3.7 | 2.5 | 2.1 | 2.2 | 3.0 | 4.3 | 4.6 | 4.1 | 3.7 |
|
|
0.7 | 1.0 | 2.0 | 3.4 | 3.6 | 3.0 | 3.4 | 3.7 | 2.6 | 1.8 | 1.4 | 1.4 | 1.9 | 2.9 | 3.4 | 3.3 | 2.8 |
|
|
0.6 | 1.3 | 2.5 | 4.3 | 4.2 | 3.8 | 4.5 | 5.3 | 4.1 | 2.8 | 1.7 | 1.6 | 2.3 | 3.1 | 3.4 | 3.3 | 2.9 |
|
|
0.2 | 0.5 | 1.5 | 2.8 | 2.6 | 1.9 | 2.3 | 2.5 | 1.4 | 0.9 | 0.8 | 0.9 | 1.6 | 2.1 | 2.3 | 2.2 | 1.9 |
|
|
0.0 | 0.3 | 0.9 | 1.6 | 1.2 | 0.8 | 1.5 | 1.9 | 0.8 | 0.5 | 0.3 | 0.3 | 0.8 | 1.4 | 1.6 | 1.5 | 1.1 |
|
|
0.3 | 0.8 | 2.0 | 3.4 | 3.3 | 2.8 | 3.5 | 4.0 | 2.8 | 2.2 | 1.4 | 1.3 | 2.1 | 3.0 | 3.1 | 3.0 | 2.5 |
|
|
0.3 | 0.4 | 0.9 | 1.8 | 1.9 | 2.0 | 2.6 | 3.2 | 2.5 | 1.6 | 1.0 | 1.0 | 1.4 | 2.0 | 2.1 | 2.2 | 1.8 |
|
|
0.2 | 0.5 | 1.6 | 3.4 | 3.3 | 2.9 | 3.8 | 4.7 | 3.0 | 2.1 | 1.4 | 1.2 | 2.1 | 3.3 | 3.4 | 3.3 | 2.9 |
|
|
0.2 | 0.5 | 1.5 | 2.9 | 3.0 | 2.6 | 3.5 | 4.3 | 3.2 | 2.0 | 1.2 | 1.2 | 2.0 | 2.9 | 3.1 | 3.1 | 2.7 |
|
|
1.5 | 2.4 | 4.4 | 6.3 | 6.5 | 6.7 | 7.6 | 7.8 | 6.3 | 4.4 | 3.1 | 2.6 | 3.5 | 4.2 | 4.5 | 4.9 | 4.9 |
|
|
0.7 | 1.8 | 4.0 | 6.9 | 7.5 | 7.0 | 7.3 | 7.2 | 5.6 | 4.1 | 2.9 | 2.7 | 3.3 | 4.6 | 5.4 | 5.3 | 4.8 |
|
|
0.9 | 1.7 | 3.6 | 6.5 | 7.4 | 7.0 | 6.7 | 6.9 | 4.7 | 3.5 | 2.2 | 2.1 | 2.6 | 3.4 | 3.8 | 4.0 | 3.5 |
|
|
1.1 | 2.4 | 4.6 | 6.3 | 6.5 | 5.8 | 5.5 | 6.3 | 5.3 | 3.9 | 2.3 | 2.1 | 3.3 | 4.4 | 4.5 | 4.3 | 4.1 |
|
|
1.2 | 2.7 | 4.7 | 7.2 | 7.6 | 6.9 | 6.8 | 7.8 | 6.1 | 5.1 | 4.1 | 4.0 | 5.1 | 6.5 | 7.1 | 7.4 | 7.0 |
|
|
0.7 | 1.9 | 3.6 | 5.9 | 6.4 | 5.4 | 6.2 | 6.6 | 3.9 | 2.8 | 1.9 | 2.0 | 3.6 | 4.8 | 4.6 | 4.2 | 3.8 |
Other states
literature
Web links
Germany:
- Unemployment rate in the new federal states (in economic reports)
- Labor market statistics from the Federal Employment Agency
- Unemployment , from: Figures and facts: The social situation in Germany , extensive online offer from the Federal Agency for Civic Education / bpb (2008)
- What the labor market statistics hide , tagesschau.de
- Unemployment and underemployment - explanations on the statistical values of the Federal Employment Agency
- Key figures according to §48a SGB II
Austria:
- Labor market information , employment service AMS Austria
- Unemployed, job seekers , Statistics Austria → Statistics → Labor market
- Arbeitsmarktprofile.at , data by country and district, AMS / ÖIR project house
Individual evidence
- ↑ a b c Sabrina Bersheim, Frank Oschmiansky, Stefan Sell: How to measure unemployment? Federal Agency for Civic Education, January 1, 2014, accessed December 20, 2014 .
- ^ IAB: The silent reserve belongs in the picture of the labor market (PDF; 441 kB), November 14, 2005
- ↑ IAB: The job market is stagnant (PDF; 982 kB)
- ↑ Labor market Millions of Germans are underemployed , Die Zeit , August 15, 2012, accessed on August 21, 2012
- ↑ Maike Rademaker, Monika Dunkel: Government fudges statistics for the unemployed . ( Memento from August 1, 2012 in the web archive archive.today ) Financial Times Deutschland
- ↑ Spiegel Online: SPRING UPWARD . May 29, 2009.
- ↑ Statistics from the Federal Employment Agency: Information on basic security for job seekers (SGB II)
- ↑ a b c Public Employment Service: Labor Market Situation 2010 , Section Affectedness and Duration , p. 20 ff (pdf, ams.at; 3.7 MB)
- ↑ Statistics Austria: Registered unemployed according to the labor market service (national definition) according to selected groups ( memento of the original from November 14, 2011 in the Internet Archive ) Info: The archive link was inserted automatically and has not yet been checked. Please check the original and archive link according to the instructions and then remove this notice. (pdf), unemployment rates according to the labor market service (national definition) by gender, citizenship or federal state (pdf) and unemployment and unemployment rates (international definition) (pdf), all updated regularly; Public Employment Service: Labor market situation , Tables 7: Unemployed , 8: People affected by unemployment , 9: Ways to unemployment , 10: Ways out of unemployment , p. 51 ff (PDF link see above)
- ↑ tagesschau.de: Questions and answers on labor market statistics, ( Memento from August 31, 2008 in the Internet Archive ) April 25, 2009.
- ↑ See Panorama , NDR : Unemployment figures: The government's computing tricks (PDF; 63 kB), June 4, 2009; as a video contribution
- ↑ cf. RP: Change in statistics causes 200,000 unemployed to disappear, ( Memento of the original from June 5, 2009 in the Internet Archive ) Info: The archive link was inserted automatically and has not yet been checked. Please check the original and archive link according to the instructions and then remove this notice. May 26, 2009.
- ↑ 2006/07 Labor and Social Trends in ASEAN 2008: Driving Competitiveness and Prosperity with Decent Work - Key Findings (pdf); 2000/06 ASEAN and ILO to cooperate in addressing labor and employment issues ; both ilo.org
- ↑ LABORSTA Internet: Unemployment → Main statistics (annual) → 3A Unemployment, general level (online database)
- ↑ Employment and unemployment (LFS / LFS - Labor Force Survey) (employ) → Main indicators (lfsi) → Population, economically active persons, inactive persons (lfsi_act) → Employment (lfsi_emp) → Unemployment (une) → Unemployment rates, annual averages, by gender and age group ( %) (une_rt_a) , Eurostat
- ↑ Labor market data according to EU standard in accordance with Eurostat ( MS Excel ; 47 kB); Access: September 18, 2019.
- ^ Bettina Isengard: Youth Unemployment in the European Union: Development and Individual Risk Factors . In: DIW Berlin - German Institute for Economic Research e. V .: weekly report of DIW Berlin , 4, 2001, pp. 57-64 ( abstract diw.de)
- ^ Karl Brenke : Unemployment: Young people are much more affected than adults . In: DIW Berlin - German Institute for Economic Research e. V .: weekly report of DIW Berlin 30, 2012, p. 6 ( weekly report no.30, diw.de)
- ↑ Unemployment: More than 160,000 older unemployed people are excluded from the statistics. In: Zeit Online. March 11, 2017, accessed April 1, 2018 .
- ↑ Official figures are wrong: Unemployment statistics are embellished. In: n-tv. December 30, 2011, accessed April 8, 2018 .
- ↑ Unemployment statistics on the official homepage of the employment agency for October 2019
- ↑ Unemployment statistics on the official homepage of the employment agency for September 2019
- ↑ Unemployment and unemployment rate. In absolute numbers and as a percentage of all civilian labor force, 1980 to 2017. Federal Agency for Civic Education (bpb), April 4, 2018, accessed on April 8, 2018 .
- ↑ grundeinkommenblog.blogspot.com: The current employment optimism from a historical perspective . November 3, 2010.
- ↑ Results of the Federal Employment Agency (BA) Registered unemployed, unemployment rate by area
- ↑ Federal Agency for Employment, Unemployment and Unemployment Rates - Germany and West / East (time series monthly and annual figures from 1950), accessed on September 19, 2019
- ↑ Number of "Hartz IV" recipients reaches the highest level of the daily mirror
- ↑ Labor market: Apparently more older people are unemployed than officially named Focus.de
- ↑ Monthly unemployment figures: What the official statistics hide tagesschau.de
- ↑ Temporary workers and rental companies - Germany, Federal Employment Agency.
- ↑ Ulrike Meyer-Timpe: Temporary work: worker on call . In: Die Zeit No. 18, April 26, 2007, p. 23
- ↑ Tobias Schormann: Temporary work - using the "sticking effect" . In: Hamburger Abendblatt, August 17, 2010.
- ↑ Karin Finkenzeller: Temporary Workers: For a few euros less . In: Die Zeit No. 42, October 14, 2010.
- ↑ Reports and evaluations. AMS Austria, accessed on March 25, 2019 .
- ↑ Albert Steck, In Switzerland there are twice as many unemployed as there are registered . NZZ, August 11, 2018 - “Switzerland is proud of the low unemployment rate: the rate is 2.4 percent according to the latest statistics. The internationally common measurement shows, however, that almost 5 percent of the population are unemployed. "
- ^ The situation on the labor market