
Election for the Berlin House of Representatives in 2011
The election for the Berlin House of Representatives in 2011 took place on September 18, 2011. The House of Representatives and the District Council Assemblies were newly elected in Berlin . All Germans who were at least 18 years old on the day of the election and had been resident in Berlin for at least three consecutive months were eligible to vote in the House of Representatives election. Those Germans and EU citizens who had reached the age of 16 and had been resident in Berlin for at least three consecutive months were eligible to vote for the district council meetings.
The SPD under the ruling mayor Klaus Wowereit maintained its position as the strongest party despite losses. Since Die Linke also lost votes, the government alliance of these two parties, which had existed since 2002, could not be continued. The CDU was able to expand its result slightly and assert itself as the second strongest party in front of the strengthened Greens . The FDP remained at 1.8 percent, well below the five-percent threshold and thus missed the re-entry into the House of Representatives. The Pirate Party , which appeared for the first time, achieved the greatest increase in votes with 8.9 percent, which enabled it to enter a German state parliament for the first time .
After the election, the SPD initially held exploratory talks with the Greens and the CDU. This led to coalition negotiations with the Greens, in which no agreement could be reached regarding the further construction of the A 100 urban motorway . As a result, coalition negotiations began with the CDU.
After the successful conclusion of the negotiations to form a grand coalition , the Senate Wowereit IV was sworn in on December 1, 2011 .
Nominations

Top candidate of the Berlin SPD : Klaus Wowereit , Governing Mayor
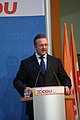
Top candidate of the Berlin CDU : Frank Henkel

Top candidate of the Berlin Greens : Renate Künast

Top candidate of the Berlin Left : Harald Wolf

Top candidate of the Berlin pirates : Andreas Baum


22 parties submitted nominations and were allowed to vote. The state election committee made the decision on the approval of the nominations on July 22, 2011. To approve the nominations, 2200 supporter signatures had to be submitted for state lists ; the Bundestag parties CDU, SPD, FDP, Left, Greens were excluded because they were already represented in the Berlin Parliament. 18 parties competed across the country, including the SPD, CDU and FDP with national district lists; four parties only competed in individual districts:
Explanation of the list: The number in brackets is the uniform number sequence of the nominations on the ballot papers. The following people in brackets represent their top candidates.
- (1.) SPD - Social Democratic Party of Germany ( Klaus Wowereit )
- (2.) CDU - Christian Democratic Union of Germany ( Frank Henkel )
- (3.) GREEN - Alliance 90 / The Greens ( Renate Künast )
- (4.) DIE LINKE - Die Linke ( Harald Wolf )
- (5.) FDP - Free Democratic Party ( Christoph Meyer )
- (6.) NPD - National Democratic Party of Germany ( Udo Voigt )
- (7.) Animal Welfare Party - Human Environment Animal Welfare Party (Sabrina Bacholke)
- (9.) BüSo - Civil Rights Movement Solidarity (Stefan Tolksdorf)
- (10.) ödp - Ecological Democratic Party (Christian Schantz)
- (11.) PSG - Party for Social Equality ( Ulrich Rippert )
- (13.) The PARTY - Party for Labor, Rule of Law, Animal Welfare, Elite Promotion and grassroots initiative ( Martin Sonneborn )
- (15.) BIG - Alliance for Innovation and Justice (Ismet Mısırlıoğlu)
- (17.) pro Germany - Citizens' movement pro Germany ( Manfred Rouhs )
- (18.) FREEDOM - Civil Rights Party for More Freedom and Democracy - Freedom ( René Stadtkewitz )
- (19.) ddp - German Democratic Party (Wolfgang Rogalski)
- (20.) DKP - German Communist Party (Rainer Perschewski)
- (21.) German Conservatives - German Conservative Party (Andreas Corinth)
- (26.) PIRATES - Pirate Party Germany ( Andreas Baum )
Four parties only competed in individual districts:
- (8.) APPD - Anarchist Pogo Party of Germany
- (14.) B - Mountain Party, the Überpartei
- (22.) FAMILY - German family party
- (27) INDEPENDENTS - Independents for community democracy
Election proposals for individual constituencies came from the parties (12th) Democratic Left , (16th) Citizen-Determined Berlin, (23rd) Free Union , (24th) Free Voters , (25th) Free Voters Germany and the (42nd) Party social center Germany. Furthermore, seven (28th – 34th) individual applicants competed. Numbers 35. – 41. accounted for nominations for the simultaneous elections to the district council meetings .
Originally 37 associations had indicated their participation in the election. 34 were recognized as parties. Of these, twelve did not submit nominations for a state or district list.
Constituency division
For the election on September 18, 2011, votes could be cast in 100 voting districts and 27 postal voting districts.
78 of the 130 MPs were directly elected with the first vote . Compared to the old constituency division from 2006 , the Marzahn-Hellersdorf district lost one constituency, while the Friedrichshain-Kreuzberg district gained an electoral district. There were also boundary changes in the eight constituencies of Tempelhof-Schöneberg and constituencies 2, 3 and 4 of Treptow-Köpenick .
initial situation
Since 2002 a red-red coalition ruled in Berlin under Klaus Wowereit . The SPD had 53 seats and the coalition partner Die Linke.PDS had 23 seats. The Linke.PDS merged with the WASG to form Die Linke during the legislative period . In addition, the CDU was represented with 37 seats, the Greens with 23 seats and the FDP with 13 seats in the House of Representatives.
Before the parliamentary elections in September 2011, a series of state elections took place: the state elections in Hamburg (February 20), the state elections in Saxony-Anhalt (March 20), in Baden-Württemberg and in Rhineland-Palatinate (March 27), the state elections in Bremen (May 22nd) and the state elections in Mecklenburg-Western Pomerania on September 4th just two weeks before the election .
Election results in Berlin since 2006
All parties are listed that achieved at least 1.0% at state level in one of the last elections since 2006 and ran for the 2011 election nationwide.
| Political party | House election September 17, 2006 |
European elections June 7, 2009 |
Bundestag election Sept. 27, 2009 |
|---|---|---|---|
| SPD | 30.8% | 18.8% | 20.2% |
| CDU | 21.3% | 24.3% | 22.8% |
| GREEN | 13.1% | 23.6% | 17.4% |
| The left | PDS 13.4%, WASG 2.9% | 14.7% | 20.2% |
| FDP | 7.6% | 8.7% | 11.5% |
| PIRATES | - | 1.4% | 3.4% |
| NPD | 2.6% | - | 1.6% |
| Animal welfare party | 0.8% | 1.4% | 1.4% |
Ballot
There is a white ballot paper for the first votes for each of the 78 constituencies. There are twelve ballot papers with a blue border for the second votes, one for each district. The formerly colored ballot papers have been redesigned so that people with visual impairments can better recognize them and cast their votes without outside help. Now the background is white and the note has a colored border. Blind people and people with severe visual impairments can use a voting form and vote without outside help.
Polls
The so-called " Sunday question ", which party the Berliners would vote in a House of Representatives election next Sunday, were answered by the relevant polling institutes as follows:
| Institute | date |
SPD |
CDU |
LEFT |
GREEN |
FDP |
PIRATES | Other | "Right" |
|---|---|---|---|---|---|---|---|---|---|
| Info GmbH | 09/15/2011 | 31% | 22% | 12% | 18% | 2% | 9% | 3% | NPD 3% |
| Research group elections | 09/09/2011 | 32% | 21% | 11% | 19.5% | 3% | 5.5% | 8th % | |
| Infratest dimap | 09/08/2011 | 29.5% | 22% | 11% | 20% | 3% | 6.5% | 8th % | |
| Emnid | 04.09.2011 | 32% | 23% | 11% | 20% | 4% | 4% | 6% | |
| Forsa | 02.09.2011 | 32% | 21% | 11% | 19% | 4% | 5% | 8th % | |
| Infratest dimap | 08/30/2011 | 30% | 22% | 11% | 22% | 3% | 4.5% | 7.5% | |
| Emnid | 08/30/2011 | 33% | 24% | 11% | 19% | 5% | 4% | 4% | NPD 1% |
| Research group elections | 08/26/2011 | 33% | 20.5% | 10.5% | 20.5% | 3.5% | 4.5% | 4.5% | NPD 3% |
| Info GmbH | 08/18/2011 | 36% | 23% | 8th % | 22% | 2% | 4.5% | 4% | 1 % |
| Infratest dimap | 08/10/2011 | 31% | 22% | 12% | 22% | 4% | 3% | 9% | |
| Forsa | 07/31/2011 | 30% | 19% | 13% | 24% | 3% | 11% | ||
| Info GmbH | 07/21/2011 | 29% | 21% | 13% | 26% | 2% | 7% | 2% | |
| Emnid | 07/17/2011 | 32% | 21% | 14% | 22% | 3% | 8th % | ||
| Infratest dimap | 07/06/2011 | 29% | 23% | 14% | 23% | 3% | 7% | ||
| Forsa | 04/07/2011 | 31% | 18% | 11% | 27% | 3% | 10% | ||
| Info GmbH | 06/18/2011 | 33% | 17% | 12% | 29% | 3% | 5% | 1 % | |
| Infratest dimap | 06/08/2011 | 30% | 21% | 12% | 25% | 4% | 8th % | ||
| Forsa | 05/29/2011 | 31% | 17% | 10% | 27% | 3% | 12% | ||
| Info GmbH | 05/21/2011 | 28% | 20% | 11% | 31% | 2% | 7% | 3% | |
| Infratest dimap | 05/11/2011 | 29% | 21% | 13% | 26% | 3% | 8th % | ||
| Forsa | 05/01/2011 | 29% | 18% | 10% | 29% | 2% | 12% | ||
| Info GmbH | 04/24/2011 | 27% | 20% | 13% | 30% | 3% | 7% | ||
| Emnid | 04/10/2011 | 27% | 20% | 14% | 29% | 3% | 7% | ||
| Infratest dimap | 04/06/2011 | 26% | 21% | 15% | 28% | 3% | 7% | ||
| Info GmbH | March 31, 2011 | 32% | 19% | 11% | 29% | 3% | 6% | ||
| Forsa | 03/26/2011 | 29% | 19% | 13% | 24% | 3% | 12% | ||
| Info GmbH | 03/06/2011 | 30% | 20% | 12% | 22% | 4% | 9.3% | 2.4% | |
| Forsa | 02/25/2011 | 30% | 18% | 13% | 23% | 4% | 12% | ||
| Infratest dimap | 02/16/2011 | 28% | 23% | 16% | 23% | 3% | 7% | ||
| Forsa | January 15, 2011 | 28% | 19% | 14% | 24% | 3% | 12% | ||
| Infratest dimap | 01/10/2011 | 29% | 20% | 17% | 25% | 4% | 5% | ||
| Forsa | December 18, 2010 | 27% | 19% | 15% | 25% | 4% | 10% | ||
| Infratest dimap | December 8, 2010 | 27% | 21% | 17% | 27% | 3% | 5% | ||
| Forsa | 11/27/2010 | 26% | 18% | 16% | 28% | 3% | 9% | ||
| Forsa | 11/01/2010 | 27% | 17% | 14% | 29% | 3% | 10% | ||
| Infratest dimap | 10/27/2010 | 22% | 20% | 17% | 30% | 3% | 8th % | ||
| Forsa | 10/01/2010 | 26% | 16% | 15% | 30% | 3% | 10% | ||
| Emnid | 09/13/2010 | 28% | 19% | 15% | 25% | 4% | 9% | ||
| Infratest dimap | 09/08/2010 | 24% | 22% | 16% | 28% | 4% | 6% | ||
Election result
Because of a counting span in the Lichtenberg district ( constituency 1 ), the votes there had to be counted again; as a result, the SPD, the Greens and the Left each lost one mandate. The tables show the final election results. In addition to the gains and losses of the individual parties, it should be added to the election result that the differences between the election results in the former West and East halves have continued to decrease, as in the previous election, even if they are still clearly present.
| No. | Region / district |
electoral participation |
SPD |
CDU |
GREEN |
LEFT |
PIRATES |
Parties below 5% |
NPD |
FDP | ||
|---|---|---|---|---|---|---|---|---|---|---|---|---|
|
|
60.2% | 28.3% | 23.3% | 17.6% | 11.7% | 8.9% | 10.2% | 2.1% | 1.8% | |||
|
|
62.0% | 27.9% | 29.5% | 20.3% | 4.3% | 8.1% | 9.9% | 1.6% | 2.3% | |||
|
|
57.8% | 28.8% | 14.2% | 13.5% | 22.7% | 10.1% | 10.7% | 2.9% | 1.2% | |||
| 1 |
|
55.9% | 28.7% | 17.9% | 22.5% | 11.0% | 10.5% | 9.4% | 1.4% | 1.7% | ||
| 2 |
|
62.2% | 23.9% | 8.4% | 30.3% | 13.0% | 14.7% | 9.7% | 1.0% | 1.0% | ||
| 3 |
|
60.8% | 29.1% | 13.8% | 19.1% | 17.9% | 10.5% | 9.6% | 2.0% | 1.3% | ||
| 4th |
|
65.1% | 31.2% | 28.2% | 21.7% | 3.6% | 7.0% | 8.3% | 0.8% | 3.0% | ||
| 5 |
|
58.0% | 31.7% | 34.2% | 12.5% | 3.7% | 7.3% | 10.6% | 2.2% | 2.1% | ||
| 6th |
|
70.0% | 25.1% | 36.2% | 21.1% | 3.0% | 6.4% | 8.2% | 1.0% | 3.0% | ||
| 7th |
|
64.1% | 27.1% | 28.9% | 23.0% | 4.0% | 7.8% | 9.2% | 1.5% | 2.0% | ||
| 8th |
|
57.2% | 27.4% | 26.7% | 17.9% | 5.6% | 9.6% | 12.8% | 3.1% | 1.8% | ||
| 9 |
|
60.9% | 28.9% | 15.9% | 10.7% | 23.0% | 9.3% | 12.2% | 4.1% | 1.2% | ||
| 10 |
|
51.0% | 28.2% | 17.5% | 5.6% | 27.4% | 8.8% | 12.5% | 4.0% | 1.3% | ||
| 11 |
|
53.5% | 30.9% | 12.3% | 7.6% | 29.0% | 9.3% | 10.9% | 3.5% | 0.9% | ||
| 12 |
|
62.1% | 28.1% | 38.4% | 13.6% | 3.3% | 6.7% | 9.9% | 1.9% | 2.3% | ||
| Colors of the district numbers: formerly West , formerly East , West / East fusion districts, all of Berlin | ||||||||||||
| No. | Political party | First votes | percent | Second votes | percent | Seats | Constituencies |
|---|---|---|---|---|---|---|---|
| Eligible voters | 2,469,716 | ||||||
| Voters | 1,487,487 | 60.2 | |||||
| Invalid votes | 31,515 | 2.1 | 23,992 | 1.6 | |||
| Valid votes | 1,452,430 | 97.9 | 1,461,185 | 98.4 | 149 | 78 | |
| 1 | SPD | 453,768 | 31.2 | 413,332 | 28.3 | 47 | 34 |
| 2 | CDU | 371.201 | 25.6 | 341.158 | 23.3 | 39 | 25th |
| 3 | GREEN | 266,511 | 18.3 | 257.063 | 17.6 | 29 | 11 |
| 4th | THE LEFT | 183,452 | 12.6 | 171.050 | 11.7 | 19th | 8th |
| 26th | PIRATES | 73,333 | 5.0 | 130.105 | 8.9 | 15th | 0 |
| 6th | NPD | 13,074 | 0.9 | 31,241 | 2.1 | 0 | 0 |
| 5 | FDP | 20,842 | 1.4 | 26,943 | 1.8 | 0 | 0 |
| 7th | Animal welfare party | 277 | 0.0 | 21,654 | 1.5 | 0 | 0 |
| 17th | per Germany | 37,467 | 2.6 | 17,834 | 1.2 | 0 | 0 |
| 18th | THE FREEDOM | 10,527 | 0.7 | 14,073 | 1.0 | 0 | 0 |
| 13 | The party | 6,680 | 0.5 | 12,861 | 0.9 | 0 | 0 |
| 15th | BIG | 4,879 | 0.3 | 8,012 | 0.5 | 0 | 0 |
| 20th | DKP | 96 | 0.0 | 3,618 | 0.2 | 0 | 0 |
| 21st | German Conservatives | 608 | 0.0 | 2,332 | 0.2 | 0 | 0 |
| 10 | ödp | 74 | 0.0 | 1,940 | 0.1 | 0 | 0 |
| 11 | PSG | - | - | 1,690 | 0.1 | 0 | - |
| 9 | BüSo | 1,860 | 0.1 | 1,676 | 0.1 | 0 | 0 |
| 22nd | FAMILY | 646 | 0.0 | 1,421 | 0.1 | 0 | 0 |
| 19th | ddp | 220 | 0.0 | 1,272 | 0.1 | 0 | 0 |
| 27 | INDEPENDENT | 1,220 | 0.1 | 834 | 0.1 | 0 | 0 |
| 14th | B. | 1,213 | 0.1 | 671 | 0.0 | 0 | 0 |
| 8th | APPD | 155 | 0.0 | 401 | 0.0 | 0 | 0 |
| 16 | CITIZEN-DETERMINED | 1,337 | 0.1 | - | - | 0 | 0 |
| 25th | FREE VOTERS | 210 | 0.0 | - | - | 0 | 0 |
| 42 | PsMD | 189 | 0.0 | - | - | 0 | 0 |
| 23 | Free Union | 71 | 0.0 | - | - | 0 | 0 |
| 12 | DL | 61 | 0.0 | - | - | 0 | 0 |
| 25th | FWD | 39 | 0.0 | - | - | 0 | 0 |
| Individual applicants | 2,423 | 0.2 | - | - | 0 | 0 |
Voting card

Majorities in the constituencies

Election analysis
SPD
Despite slight losses, the ruling SPD remained the strongest force with a 28.3 percent share of the vote. This enabled her top candidate, Klaus Wowereit, to take up his third term as governing mayor . However, since the previous coalition of the SPD and the Left has lost its majority, the SPD had to look for a new junior partner. On the evening of the election, the SPD considered both the CDU and the Greens. After exploratory talks with both parties, the SPD decided in favor of coalition negotiations with the Greens, which were, however, broken off shortly afterwards due to disagreements about the further construction of the Federal Motorway 100 . The SPD then began coalition negotiations with the CDU, which led to the formation of a grand coalition.
The fact that the SPD did not suffer any major loss of votes was mainly attributed to the popularity of Wowereit. According to infratest dimap, Wowereit achieved the highest satisfaction value of all top candidates with 60 percent and according to the Wahlen research group, 67 percent of all respondents said that he was doing rather well. 48 percent thought he was the most likeable candidate and 59 percent thought he was a better fit for Berlin than his competitors. He also received the highest scores for questions about credibility and the greatest expertise. 61 percent of those eligible to vote said that the SPD would have no chance in Berlin without Wowereit. 69 percent said that Wowereit made sure that Berlin is hip again (motto: "poor but sexy"). In a runoff election for the governing mayor, according to infratest dimap , he would have clearly won against his challenger Henkel (CDU) with 60 to 28 percent. Against Künast (Greens) Wowereit would have prevailed even more clearly with 65 to 23 percent. When asked by the Elections Research Group who the Berlin electorate would prefer to be the governing mayor, 49 percent named Wowereit, 22 percent Henkel, 17 percent Künast and 12 percent another or no candidate.
However, satisfaction with the party itself was lower among the population. 61 percent said that many people in Berlin voted for the SPD because there was no alternative and 59 percent said that the SPD had not managed to solve the biggest problems in its ten years of government work. Nevertheless, the SPD received the best overall rating of all parties (1.6 on a scale from −5 to +5) and a majority of 54 percent agreed that the Berlin Senate should be led by the SPD. The SPD was awarded the highest level of competence in the areas of school / education, jobs, economics, social affairs, foreigner policy and the future, in the area of finance it was on par with the CDU, whereas the CDU only scored higher than the SPD in the area of crime. Compared to the previous parliamentary elections, the SPD lost the most net voters to the Greens (18,000), the Pirates (14,000) and the CDU (12,000).
In contrast to most of the other parties, the SPD achieved almost the same result in the western and eastern parts of the city (West Berlin: 28.0 percent, East Berlin: 28.8 percent). There were no extreme deviations by district either; The SPD achieved the highest share of second votes in Spandau with 31.7 percent, the lowest in Friedrichshain-Kreuzberg with 23.9 percent. In terms of activity group, the SPD was voted most by pensioners (35 percent) and least by the self-employed (16 percent). The SPD was chosen most frequently by people with a secondary school certificate (34 percent) and the least by people with a university degree (24 percent), i.e. there was a negative correlation between school education and the choice of the SPD.
CDU
The CDU was able to reach a vote share of 23.4 percent due to easy gains. It is, however, historically the second worst result in a Berlin parliamentary election after 2006. This was justified by election researchers, among other things, with the lack of popularity of the top candidate Frank Henkel . Only 14 percent thought he was the most likeable candidate and only 11 percent thought he was a better fit for Berlin than his competitors. When it came to questions about credibility and greatest expertise, Henkel received the lowest scores of 9 percent of all candidates. 53 percent of those entitled to vote said that Henkel did not have the format to become mayor, only 28 percent were satisfied with his political work. However, the party itself was also given a low level of competence. Of those entitled to vote, 64 percent said that the CDU was neglecting the interests of the workers and 58 percent said that they no longer provided security and prosperity. Only 36 percent said that the CDU could take responsibility. The SPD was given higher scores for almost all of the issues that were decisive for the election; the CDU was only ahead when it came to combating crime. In addition, the reputation of the black-yellow coalition in the federal government was more of a burden for the election campaign of the state CDU. 67 percent said that the federal government had lost track of the crisis, and a majority of 55 percent thought the CDU was at odds. Compared to the area code, the CDU won the most net voters from the FDP (30,000) and from the SPD (12,000).
The CDU's share of the votes varies greatly depending on the region. In the west of the city, the Christian Democrats were the strongest force with 29.5 percent, while in the east they only took third place with 14.2 percent. According to districts, the CDU achieved the highest share of second votes in Reinickendorf with 38.4 percent, the lowest in Friedrichshain-Kreuzberg with 8.4 percent, making it only the fifth strongest party there, behind the pirates. The CDU was elected particularly frequently in areas with a low proportion of unemployment benefit II recipients entitled to vote and in good residential areas. In terms of activity groups, the CDU was chosen the most by pensioners (31 percent) and least by the unemployed (10 percent). The CDU was chosen most frequently by people with a secondary school certificate (32 percent) and the least by people with a university degree (18 percent), i.e. there was a negative correlation between school education and the choice of CDU.
Green
Bündnis 90 / Die Grünen achieved a strong gain of 4.5 percentage points and a share of 17.6 percent of the vote and thus their historically best result in Berlin. The party thus recorded an increase in votes in every election to a German state parliament in 2009, 2010 and 2011. Nevertheless, the Greens in Berlin clearly missed their declared election target of becoming the strongest party and being able to provide the governing mayor with their top candidate Renate Künast . In April 2011, polls saw the Greens as the strongest party ahead of the SPD, but from August they even fell behind the CDU.
The fact that the Greens fell short of their expectations was attributed, among other things, to the top candidate Künast. Only 10 percent thought she was the most likeable candidate, and just 6 percent thought she was a better fit for Berlin than her competitors. This gave it even worse scores than the CDU candidate Henkel. 54 percent of those eligible to vote were of the opinion that the Greens had put up the wrong candidate in Künast, only 43 percent were satisfied with their political work. 53 percent said that the Greens would have lost their chances of winning through a poor election campaign. With a value of +0.6 on a scale from −5 to +5, the Greens were the only party besides the SPD (+1.6) to receive a positive value. This is why a coalition of these two parties found the most approval among the population with 58 percent, compared with a grand coalition (35 percent) and the previous red-red government (32 percent). 71 percent of all eligible voters surveyed said that government participation would be good. When asked which party actually committed to all of their goals, the Greens achieved the highest approval with 50 percent.
The Greens saw significant voter migration. Compared to the area code, the party won 18,000 net votes from the SPD and 9,000 from non-voters. At the same time, however, the Greens lost 17,000 votes to the pirates; the main reason for this is that the Greens are now considered established and adapted, so that the pirates could take on the role of the new left protest party.
In 11 of the 78 constituencies, all of which are in the center of Berlin, the Greens became the strongest party. In terms of districts, the Greens had their best result in Friedrichshain-Kreuzberg with 30.2 percent , while in Marzahn-Hellersdorf they achieved even fewer votes than the pirates with 5.6 percent. Among the under 45-year-olds, the Greens were the second strongest party in both the western and eastern parts of the city and were thus well ahead of the CDU in this age group. Among the 30 to 44 year olds, the Greens in West Berlin were even the strongest party with 29 percent. The Greens were chosen particularly often in areas with a high proportion of foreigners and in good residential areas. According to activity groups, the Greens were chosen most by the self-employed (24 percent) and the least by workers and pensioners (9 percent each). The Greens were chosen most frequently by people with a university degree (28 percent) and the least by people with a secondary school diploma (8 percent), i.e. there was a positive correlation between school education and the choice of the Greens.
The left
After the left had already suffered a dramatic loss of votes in the 2006 election, it now lost another 1.7 percentage points and achieved its worst result since 1990 with only 11.7 percent of the second votes. Because of the losses of both parties, the coalition of the SPD and the Left could not will not be continued after two terms. The left's loss of votes was justified, among other things, with the continuing disagreement at the federal level; 70 percent of those eligible to vote were of the opinion that the Left was too divided to be able to seriously shape politics. 71 percent said that the left had not yet properly broken away from its SED past. In addition, Die Linke received by far the worst competence values in state politics by the four major parties; In the social area alone, Die Linke achieved a value similar to the CDU and the Greens, far behind the SPD. 57 percent said that Die Linke had given up many of their principles during the government in Berlin. Even among the voters of the Left Party, only 46 percent were satisfied with the work of the Berlin Senate. The top candidate Harald Wolf could not improve the result of the left either, only 35 percent were satisfied with his political work. Compared to the area code, the Left lost by far the most voters to the Pirate Party (13,000).
Traditionally, the left is mainly elected in the east of the city, where, with a share of the vote of 22.6 percent, it nevertheless suffered significant losses of 5.5 percentage points and thus achieved its worst result. In West Berlin, the Left remained stable at a relatively low level with a result of 4.3 percent. In terms of districts, Die Linke achieved its best result in Lichtenberg with 29.0 percent and its lowest result in Steglitz-Zehlendorf with 3.0 percent. According to activity group, Die Linke was voted the most by the unemployed (16 percent) and the least by employees (10 percent).
Pirates
The newly formed Pirate Party received 8.9 percent of the vote and thus made it into a German state parliament for the first time. Even in the 2009 Bundestag election , the Pirate Party in Berlin had achieved the best country result with 3.4 percent. In the House of Representatives election, the pirates benefited above all from the dissatisfaction with the established parties, as many voters found both the work of the Berlin government parties and the opposition to be unconvincing. From the point of view of 80 percent of those questioned, the pirates were chosen because of dissatisfaction with the other parties and only 10 percent because of the content. Accordingly, the pirates are seen primarily as a protest party ; 59 percent agreed that they were elected in order to give other parties a lesson. At least 38 percent of all eligible voters questioned believed that the pirates should be represented in the House of Representatives. 86 percent said the pirates are an alternative for those who would otherwise not vote. In addition, in a progressive and politically more left-wing city like Berlin, the party found an optimal electoral structure. The Pirate Party was able to win the most voters from the other left parties (Greens 17,000, SPD 14,000, Left 13,000) and from the former non-voters (23,000). 93 percent said that the pirates made sure that the younger ones finally have something to say. 51 percent were of the opinion that the pirates are the only party to stand up for individual freedom. Of the pirates' voters, 55 percent thought data protection and 42 percent a more transparent administration for their party's competencies. However, like the FDP, the Pirate Party received only very low levels of competence from all eligible voters.
The pirates were elected slightly more often in the east (10.1 percent) than in the west (8.1 percent) of the city. Among the under 30s in East Berlin, the pirates were even the second largest party with 20 percent. According to districts, they achieved the highest share of second votes in Friedrichshain-Kreuzberg with 14.7 percent and were ahead of the CDU there, the lowest in Steglitz-Zehlendorf with 6.4 percent. The Pirate Party was often elected in areas with a high proportion of eligible unemployment benefit II recipients and in simple residential areas. The pirates received the most votes from male first-time voters with 21 percent. According to activity group, the Pirate Party was voted most by the self-employed (14 percent) and the least by pensioners (3 percent).
FDP
The FDP reached only 1.8 percent of the vote their historically lowest score in Berlin and missed much of the re-entry into the House of Representatives. The Free Democrats lost more than three quarters of their share of the vote, after having stood at 7.6 percent in 2006. The party had to accept dramatic losses in the sixth election to a German state parliament. The Berlin election once again highlighted the severe crisis in which the FDP found itself, which led to further discussions about the role of the federal FDP.
Electoral researchers see the reasons for the dramatic losses in the fact that the state FDP was unable to assert itself against the very poor federal trend, as most voters were dissatisfied with the work of the black-yellow coalition at the federal level. Only 14 percent of Berliners eligible to vote agreed that the Federal FDP was on the right track with its new leadership. The vast majority of those entitled to vote, however, said that the FDP lacked good politicians at the top (83 percent) and that they were too divided to be able to seriously shape politics (75 percent). When asked which party actually committed to all of its goals, the FDP achieved the lowest approval rate with 21 percent. 65 percent were of the opinion that the FDP was not needed in Berlin. In fact, the FDP generally receives low results when there is no realistic prospect of coalition participation. When evaluating the parties, the FDP received by far the worst value of all parties at −2.4 on a scale from −5 to +5. The top candidate, Christoph Meyer , was unable to improve the election results either, as only 4 percent of those eligible to vote were satisfied with his political work. Contrary to media reports, however, according to election researchers, the discussion initiated by the FDP about the bankruptcy of Greece had no significant impact on the election result, as the voters of the FDP in any case recognized the least competence of all parties in this matter. Compared to the area code, the FDP lost the most net voters to the CDU (30,000) and to the non-voters (14,000). The FDP suffered massive loss of votes in all voter groups and clearly missed the five percent hurdle even among the self-employed, where it achieved its highest share of votes with 3 percent .
voter turnout
The turnout rose to 60.2 percent (+ 2.2). Nevertheless, it is the historically lowest value in a Berlin House of Representatives election since 2006. The turnout was 61.9 percent (+ 0.8) in the west of the city, slightly higher than in the east with 57.8 percent (+ 4.0). By district, the highest turnout was in Steglitz-Zehlendorf (69.8 percent) and the lowest in Marzahn-Hellersdorf (51.0 percent).
Trivia
Heinz Keßler entered the list of the DKP . At the time of the election, Keßler was the last living member of the first Berlin City Council 1946–1948, at that time a member of the SED .
See also
- List of members of the Berlin House of Representatives (17th electoral term)
- List of parliamentary electoral districts in Berlin 2011
- Germany 2011
Web links
- Information from the regional returning officer
- Information on the voting system
- Wahl-O-Mat Berlin 2011
- Facts about the election to the Berlin House of Representatives in 2011
Individual evidence
- ↑ Official final result
- ↑ Politics current - Berlin elects in 2011: Senate sets a date. At: berlin.de on October 19, 2010
- ↑ Call for election by the regional returning officer for the 2011 election (PDF; 48 kB)
- ↑ rp-online.de ( page no longer available , search in web archives ) Info: The link was automatically marked as defective. Please check the link according to the instructions and then remove this notice.
- ↑ nzz.ch
- ↑ nzz.ch
- ↑ Press release of the regional returning officer of July 13, 2011 (PDF; 29 kB)
- ↑ Press release of the regional returning officer of July 22, 2011 (PDF; 54 kB)
- ↑ Number sequence of the nominations. (PDF; 19 kB) The State Returning Officer for Berlin, July 29, 2011, accessed on August 6, 2011 .
- ↑ a b Election to the House of Representatives in Berlin 2011 . Mirror online
- ↑ ÖDP: Candidates for the election to the Berlin House of Representatives ( page no longer available , search in web archives ) Info: The link was automatically marked as defective. Please check the link according to the instructions and then remove this notice.
- ↑ The Party for Social Equality runs for the Berlin House of Representatives election
- ↑ Report from the state party conference 2010 ( page no longer available , search in web archives ) Info: The link was automatically marked as defective. Please check the link according to the instructions and then remove this notice. at the Berlin regional association of the party The Party
- ↑ BIG Berlin website
- ↑ proberlin.net
- ^ Announcement of the participation of the party Die Freiheit
- ^ Website of the ddp Berlin
- ↑ Top candidate Rogalski
- ↑ DKP Berlin decides on the election program and candidacy for the House of Representatives elections ( Memento of the original from February 20, 2013 in the Internet Archive ) Info: The archive link has been inserted automatically and has not yet been checked. Please check the original and archive link according to the instructions and then remove this notice.
- ^ Homepage of The Conservatives Our Competent Candidates for the Berlin House of Representatives
- ↑ Pirate-less top spot for the country list
- ↑ Family party: Elections to the House of Representatives in Berlin ( page no longer available , search in web archives ) Info: The link was automatically marked as defective. Please check the link according to the instructions and then remove this notice.
- ^ Message from the regional returning officer of September 24, 2010
- ↑ Berlin elections 2006. Final results determined ( Memento from April 12, 2011 in the Internet Archive ) Press release W60 / 06 from October 6, 2006, The State Returning Officer for Berlin
- ↑ Press release of August 3, 2011 (PDF; 21 kB)
- ↑ Elective barometer ( Memento of the original from January 31, 2012 in the Internet Archive ) Info: The archive link was inserted automatically and has not yet been checked. Please check the original and archive link according to the instructions and then remove this notice. at Berliner Rundfunk
- ↑ a b c d e f g h i j k l m n o p q r s t u v w x y z aa ab ac ad ae Polls for the House of Representatives in Berlin.
- ↑ Without "Bussi-Bussi" against Wowi. In: stern.de
- ↑ SPD wins the poll . In: Berliner Zeitung , 18./19. December 2010, p. 23.
- ↑ The Greens are stagnating - at a high level . In: Berliner Zeitung , November 1, 2010.
- ↑ BerlinTrend October 2010 . In: Abendschau ( RBB ) from October 27, 2010
- ↑ Why? Why? Why? . In: Berliner Zeitung , September 22, 2011
- ↑ Counting chaos in Berlin - SPD loses direct mandate . Welt Online , accessed September 28, 2011
- ^ Berlin elections 2011 - results by region - second votes - table of results - final result. In: wahlen-berlin.de. The regional returning officer for Berlin, accessed on May 1, 2012 .
- ↑ a b c d e f g h i j k l m n o p q r s t Election archive infratest dimap ( Memento of the original from October 14, 2011 in the Internet Archive ) Info: The archive link was inserted automatically and has not yet been checked. Please check the original and archive link according to the instructions and then remove this notice. tagesschau.de; Retrieved September 29, 2011
- ↑ a b c d e f g h i j k l m n o p q r election analyzes. Research Group Elections; Retrieved October 1, 2011
| Elections to the city council of Berlin | ||
| Elections to the city council of Greater Berlin | ||
| Elections to the city council of Berlin (West) | ||
| Elections for the Berlin House of Representatives (West) |
1950 • 1954 • 1958 • 1963 • 1967 • 1971 • 1975 • 1979 • 1981 • 1985 • 1989 |
|
| Election of the city council of Berlin (East) | ||
| Elections to the Berlin House of Representatives | ||
| Referendums |
Pro Reli 2009 • Water company 2011 • Energy supply 2013 • Tempelhofer Feld 2014 • Rent referendum 2015 (withdrawn) • Continued operation of Tegel 2017 |
