
Wichlinghofen
|
Wichlinghofen
City of Dortmund
Coordinates: 51 ° 27 ′ 4 " N , 7 ° 29 ′ 26" E
|
|
|---|---|
| Height : | approx. 200 m above sea level NHN |
| Area : | 1.71 km² |
| Residents : | 2438 (Dec. 31, 2019) |
| Population density : | 1,429 inhabitants / km² |
| Incorporation : | May 1, 1922 |
| Incorporated into: | Wellinghofen |
| Postal code : | 44265 |
| Area code : | 0231 |
| Statistical District : | 57 |
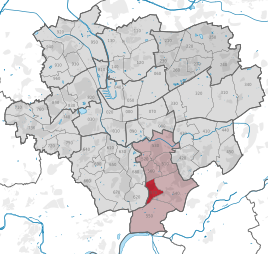  Location of Wichlinghofen in Dortmund
|
|
Wichlinghofen is the statistical district 57 and at the same time a southern part of the city of Dortmund . It is located in the Hörde district between Wellinghofen and Syburg . On May 1, 1922, he was incorporated into Wellinghofen.
Wichlinghofen has an area of 170.4 hectares . There are 15 inhabitants per hectare. Wichlinghofen was founded before 1424.
The place is mainly characterized by single-family houses and is considered one of the wealthy and preferred residential areas in Dortmund.
population
On December 31, 2019, 2,438 people lived in Wichlinghofen.
Structure of the Wichlinghofen population:
- Share of the population under 18-year-olds: 13.3% [Dortmund average: 16.2% (2018)]
- Population share of at least 65-year-olds: 25.4% [Dortmund average: 20.2% (2018)]
- Proportion of foreigners: 3.9% [Dortmund average: 18.8% (2019)]
- Unemployment rate: 3.1% [Dortmund average: 11.0% (2017)]
The average income in Wichlinghofen is around 60% above the Dortmund average.
Population development
| year | 1987 | 2003 | 2008 | 2010 | 2013 | 2016 | 2018 |
|---|---|---|---|---|---|---|---|
| Residents | 2554 | 2571 | 2508 | 2469 | 2415 | 2439 | 2429 |
Individual evidence
- ↑ Population figures in the statistical districts on December 31, 2019 (PDF)
- ↑ Stephanie Reekers: The regional development of the districts and communities of Westphalia 1817-1967 . Aschendorff, Münster Westfalen 1977, ISBN 3-402-05875-8 , p. 295 .
- ^ Incorporation of four communities into the community of Wellinghofen
- ↑ Population share of the under 18 year olds Statistical Atlas 2019 (PDF file)
- ↑ Population share of at least 65-year-olds Statistical Atlas 2019 (PDF file)
- ↑ Nationalities in the statistical districts on December 31, 2019 (PDF file)
- ↑ Unemployment rates by statistical district on June 30, 2017 (PDF file)

Aplerbeck :
Aplerbeck (with Aplerbecker Mark ) |
Berghofen (with Berghofer Mark ) |
Stoke |
Sölde |
Sölderholz (with Lichtendorf )
Brackel :
woodlice |
Brackel (with Neuasseln ) |
Wobble |
Wickede
Eving :
Brechte |
Eving (with Kemminghausen ) |
Holthausen |
Lindenhorst
Hombruch :
Barop (with Schönau ) |
Bitter pulp |
Brünninghausen (with Renninghausen ) |
Eichlinghofen (with spreaders ) |
Hombruch |
Kirchhörde-Löttringhausen (with Großholthausen , Kirchhörde , Kleinholthausen , Löttringhausen and Schanze ) |
Menglinghausen |
Persebeck-Kruckel-Schnee (with Kruckel , Persebeck and Schnee ) |
Rombergpark-Lücklemberg (with Lücklemberg )
Hörde :
Benninghofen (with Loh ) |
Hacheney |
Wood (with highest ) |
Hörde (with Clarenberg ) |
Syburg (with Buchholz ) |
Wellinghofen (with Niederhofen ) |
Wichlinghofen
Huckarde :
Deusen |
Huckarde (with whiskers ) |
Jungferntal cream (with Jungferntal and cream ) |
Kirchlinde (with Hangeney )
city center north :
Borsigplatz |
Port |
Nordmarkt
Innenstadt-Ost :
Kaiserbrunnen (with grains ) |
Ruhrallee |
Westfalendamm (with Gartenstadt ) City Center
West :
City |
Dorstfeld |
Dorstfeld Bridge |
Westfalenhalle (with Kreuzviertel )
Lütgendortmund :
Bövinghausen |
Kley |
Lütgendortmund (with Holte-Kreta and Somborn ) |
Marten |
Oespel |
Westrich (with Dellwig )
Mengede :
Bodelschwingh |
Mengede (with Brüninghausen ) |
Nice |
Oestrich |
Schwieringhausen (with Ellinghausen and Groppenbruch ) |
Westerfilde
Scharnhorst :
Alt-Scharnhorst |
Derne |
Hostedde (with Grevel ) |
Kirchderne |
Kurl-Husen (with Fleier , Husen and Kurl ) |
Lanstrop |
Scharnhorst-Ost