
Demographics of the People's Republic of China

The People's Republic of China is currently the most populous country in the world. For 2018 the total population is estimated by the United Nations at 1.415 billion, by the CIA at 1.384 billion and by the State Office for Statistics of the People's Republic of China at 1.395 billion. With a population density of 151 people per km², China is in the midfield worldwide. The country's population is particularly concentrated in the coastal areas, while the interior of China is very sparsely populated. The country has to feed around 20% of the world's population with only 10% of the world's arable land .
The government conducts a census every 10 years that covers all of mainland China. China conducted its sixth national census on November 1, 2010. According to the 2010 census, 91.6% of the population were Han Chinese and 8.4% were minorities. China's population growth is 0.59% and is thus in the lower midfield worldwide. The country is currently in a demographic transition towards an older population structure, as can already be observed in some parts of the world today.
population

Historical development
Historically, China has always had a share of at least 15% of the world's population.
The population of China fluctuated between 30 and 86 million people during the Han Dynasty .
After the collapse of the Han Dynasty, the population remained around 50 million until the advent of the Tang Dynasty .
During the Tang Dynasty, the population increased from 45 million to 80 million over 200 years.
At the beginning of the Song Dynasty , the population was over 100 million.
After the Ming Dynasty and the earlier period of the Qing Dynasty , the population moved from 100 million to 150 million by 1700.
In the period between 1749 and 1851 the population doubled in a century. During this time, more than a third of humanity lived in what is now China.
Under Mao Zedong , China's population almost doubled, from 540 million (1949) to 969 million (1979). At that time, the Great Chinese Famine from 1958 to 1961, one of the largest demographic catastrophes in Chinese history, with an estimated 15 to 40 million deaths, occurred .
Population growth only slowed down with the introduction of the one-child policy . Nevertheless, the population reached its all-time high of 1.4 billion in 2015.
Modern People's Republic

Population pyramid 1953

Population pyramid 1964

Population pyramid 1982

Population pyramid 1990
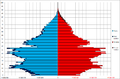
Population pyramid 2000

Population pyramid 2010


The People's Republic of China carried out its first census in 1953. Further censuses followed in 1964, 1982, 2000 and 2010. The 1982 census is considered to be the first census carried out according to modern standards and a milestone in the demographic recording of China and the world population. The census also confirmed for the first time that over a billion people live in China. The 2010 census was then the largest in human history. The next census is scheduled for 2020.
The following table shows the development of the population in all administrative units of the country since 1953.
| Province or city |
1953 census | 1964 census | 1982 census | 1990 census | 2000 census | 2010 census | ||||||
|---|---|---|---|---|---|---|---|---|---|---|---|---|
| number | % | number | % | number | % | number | % | number | % | number | % | |
| Beijing | 3,768,149 | 0.65 | 8,568,495 | 1.23 | 9,230,687 | 0.92 | 11,819,407 | 0.95 | 13,569,194 | 1.09 | 19,612,368 | 1.46 |
| Hebei | 35,984,644 | 6.18 | 49,687,781 | 6.58 | 53.005.876 | 5.26 | 61,082,439 | 5.39 | 66,684,419 | 5.33 | 79.854.202 | 5.36 |
| Tianjin | 2,693,831 | 0.46 | 7,764,141 | 0.77 | 8,785,402 | 0.77 | 9,848,731 | 0.79 | 12,938,224 | 0.97 | ||
| Shanxi | 14,314,485 | 2.46 | 18,015,067 | 2.59 | 25.291.389 | 2.51 | 28,759,014 | 2.54 | 32,471,242 | 2.60 | 35.712.111 | 2.67 |
| Inner Mongolia | 6.100.104 | 1.05 | 12,348,638 | 1.78 | 19.274.279 | 1.91 | 21,456,798 | 1.89 | 23,323,347 | 1.88 | 24,706,321 | 1.84 |
| Deer (dissolved) | 5,160,822 | 0.89 | ||||||||||
| Liaoning | 18,545,147 | 3.18 | 26,946,200 | 3.88 | 35,721,693 | 3.54 | 39,459,697 | 3.48 | 41,824,412 | 3.35 | 43,746,323 | 3.27 |
| Jilin | 11,290,073 | 1.94 | 15,668,663 | 2.26 | 22,560,053 | 2.24 | 24,658,721 | 2.18 | 26,802,191 | 2.16 | 27,462,297 | 2.05 |
| Heilongjiang | 11,897,309 | 2.04 | 20.118.271 | 2.90 | 32,665,546 | 3.24 | 35.214.873 | 3.11 | 36.237.576 | 2.91 | 38.312.224 | 2.86 |
| Shanghai | 6,204,417 | 1.06 | 10,816,458 | 1.56 | 11,859,748 | 1.18 | 13,341,896 | 1.18 | 16,407,734 | 1.32 | 23,019,148 | 1.72 |
| Jiangsu | 41.252.192 | 7.08 | 44.504.608 | 6.41 | 60,521,114 | 6.00 | 67.056.519 | 5.91 | 73.043.577 | 5.88 | 77.659.903 | 5.87 |
| Zhejiang | 22,865,747 | 3.92 | 28,318,573 | 4.08 | 38.884.603 | 3.86 | 41,445,930 | 3.66 | 45.930.651 | 3.69 | 54,426,891 | 4.06 |
| Anhui | 30,343,637 | 5.21 | 31.241.657 | 4.50 | 49,665,724 | 4.93 | 56.180.813 | 4.96 | 58,999,948 | 4.73 | 59,500,510 | 4.44 |
| Fujian | 13,142,721 | 2.26 | 16,757,223 | 2.41 | 25.931.106 | 2.57 | 30.097.274 | 2.65 | 34.097.947 | 2.74 | 36,894,216 | 2.75 |
| Jiangxi | 16,772,865 | 2.88 | 21,068,019 | 3.03 | 33.184.827 | 3.29 | 37.710.281 | 3.33 | 40,397,598 | 3.27 | 44,567,475 | 3.33 |
| Shandong | 48,876,548 | 8.39 | 55,519,038 | 7.99 | 74,419,054 | 7.38 | 84,392,827 | 7.44 | 89,971,789 | 7.17 | 95.793.065 | 7.15 |
| Henan | 44.214.594 | 7.59 | 50.325.511 | 7.25 | 74,422,739 | 7.38 | 85.509.535 | 7.54 | 91.236.854 | 7.31 | 94.023.567 | 7.02 |
| Hubei | 27,789,693 | 4.77 | 33,709,344 | 4.85 | 47.804.150 | 4.74 | 53.969.210 | 4.76 | 59,508,870 | 4.76 | 57.237.740 | 4.27 |
| Hunan | 33.226.954 | 5.70 | 37.182.286 | 5.35 | 54.008.851 | 5.36 | 60,659,754 | 5.35 | 63.274.173 | 5.09 | 65,683,722 | 4.90 |
| Guangdong | 34,770,059 | 5.97 | 42,800,849 | 6.16 | 59.299.220 | 5.88 | 62.829.236 | 5.54 | 85.225.007 | 6.83 | 104.303.132 | 7.79 |
| Hainan | 7,559,035 | 0.62 | 8,671,518 | 0.65 | ||||||||
| Guangxi | 19,560,822 | 3.36 | 20,845,017 | 3.00 | 36.420.960 | 3.61 | 42.245.765 | 3.73 | 43,854,538 | 3.55 | 46,026,629 | 3.55 |
| Sichuan | 62,303,999 | 10.69 | 67,956,490 | 9.78 | 99.713.310 | 9.89 | 107.218.173 | 9.46 | 82,348,296 | 6.58 | 80.418.200 | 6.00 |
| Chongqing | 30,512,763 | 2.44 | 28,846,170 | 2.15 | ||||||||
| Guizhou | 15.037.310 | 2.58 | 17.140.521 | 2.47 | 28,552,997 | 2.83 | 32.391.066 | 2.86 | 35.247.695 | 2.78 | 34,746,468 | 2.59 |
| Yunnan | 17,472,737 | 3.00 | 20,509,525 | 2.95 | 32,553,817 | 3.23 | 36,972,610 | 3.26 | 42.360.089 | 3.39 | 45.966.239 | 3.43 |
| Tibet Autonomous Region | 1,273,969 | 0.22 | 1,251,225 | 0.18 | 1,892,393 | 0.19 | 2,196,010 | 0.19 | 2,616,329 | 0.21 | 3,002,166 | 0.22 |
| Xikang (dissolved) | 3,381,064 | 0.58 | ||||||||||
| Shaanxi | 15,881,281 | 2.73 | 20,766,915 | 2.99 | 28,904,423 | 2.87 | 32,882,403 | 2.90 | 35,365,072 | 2.85 | 37,327,378 | 2.79 |
| Gansu | 12.093.600 | 2.06 | 12,630,569 | 1.82 | 19,569,261 | 1.94 | 22,371,141 | 1.97 | 25.124.282 | 2.02 | 25,575,254 | 1.91 |
| Ningxia | 1,506,200 | 0.26 | 2,107,500 | 0.30 | 3,895,578 | 0.39 | 4,655,451 | 0.41 | 5,486,393 | 0.44 | 6,301,350 | 0.47 |
| Qinghai | 1,676,534 | 0.29 | 2,145,604 | 0.31 | 3,895,706 | 0.39 | 4,456,946 | 0.39 | 4,822,963 | 0.41 | 5,626,722 | 0.42 |
| Xinjiang | 4,873,608 | 0.84 | 7,270,067 | 1.05 | 13,081,681 | 1.30 | 15.155.778 | 1.34 | 18,459,511 | 1.52 | 21,813,334 | 1.63 |
| Military personnel | 4,238,210 | 3,199,100 | 2,498,600 | 2,300,000 | ||||||||
| Location cannot be precisely determined | 4,649,985 | |||||||||||
| Total | 582,603,417 | 694,581,759 | 1.008.175.288 | 1,133,682,501 | 1.245.110.826 | 1,339,724,852 | ||||||
Population control

Originally, after 1949, China's leaders were ideologically inclined to view large populations as an asset. However, the problem of a large, rapidly growing population quickly became apparent. For a year, beginning in August 1956, the Department of Health's birth control programs received intensive support. However, these efforts have had little impact on fertility. After the great leap forward , Chinese leaders again saw rapid population growth as an obstacle to development and their interest in birth control revived. Programs in the early 1960s emphasized the virtues of late marriage a little more cautiously than in the first campaign. In 1964, birth control offices were established in the central government and some provincial governments. The second campaign was particularly successful in cities where the birth rate was halved between 1963 and 1966. However, the upheavals of the Cultural Revolution brought the program to a standstill.
In 1972 and 1973, the party mobilized its resources for nationwide birth control administered by a group in the State Council. Committees to monitor birth control have been set up at all administrative levels and in various collective enterprises. This extensive and seemingly effective network encompassed both rural and urban populations. In urban areas, the Central Public Security Administration monitored sections of the population. In rural areas, the country's “barefoot doctors” distributed information and contraceptives to community members. In 1973 Mao Zedong was personally identified with the family planning movement, which means more leadership than ever before for controlled population growth. However, until several years after Mao's death in 1976, the leadership hesitated to set out directly the reasons for population control for economic growth and the improvement of living standards.
The population growth target was set for both administrative units and individual families. In the mid-1970s, a maximum of two children in cities and three or four children in rural areas were recommended. In 1979 the government introduced a one-child limit for rural and urban areas, a maximum of two children in special circumstances. As of 1986, minority policy consisted of two children per couple, three in special circumstances, and no limit for very small ethnic groups. The overall goal of the one-child policy was to limit the total population to 1.2 billion in 2000, on the assumption that the modernization campaigns would be of little value if population growth were not brought under control.
The one-child policy was a very ambitious population control program. As with previous programs in the 1960s and 1970s, the one-child policy employed a combination of public education, social pressure and, in some cases, coercion. However, the one-child policy was unique in that it linked reproduction to economic costs or benefits.

Under the one-child program, a sophisticated system rewarded those who followed the rules and penalized those who did not. Couples with only one child received a “one-child certificate” which gave them cash benefits, longer maternity leave, better childcare and preferential housing, among other things . In return, they had to pledge not to have any more children. There was great pressure in the country to respect the one-child limit. With the rural population accounting for approximately 80% of the total population, the effectiveness of the one-child policy in rural areas was seen as a key to the success or failure of the program as a whole.
In rural areas, day-to-day family planning work was carried out by team and brigade-level cadres in charge of women's affairs and health workers. The women's team leader made regular household visits to track the status of each family under their jurisdiction and obtained information about which women were using contraception, what methods were used, and which had become pregnant. She then reported to the brigade leader, who documented the information and brought it to a monthly meeting of the community education committee. There were reports that caps or quotas had to be respected; In order to comply with these limits, unmarried young people were persuaded to postpone marriages, and couples without children were advised to “wait their time”. Women with unapproved pregnancies were forced to have abortions and those who had already had children were asked to use contraception or sterilization. Couples with more than one child were asked to be sterilized.
This policy, which was enforced much more rigidly in cities, led to a sharp slowdown in population growth. However, it is controversial among experts whether the government's policy was really responsible for the phenomenon of the post-1980s fall in the birth rate or whether the general modernization of China is the real reason. It is also criticized that this coercion-based system triggered the current surplus of men in the population, as parents often decided to abort girls (see sex-selective abortion ). Future challenges for China will be gender differences. According to the 2010 census, men make up 51.27% of the 1.34 billion people in China, while women make up 48.73% of the total population. The gender ratio (the number of men per woman in a population) at birth was 118.06 boys per 100 girls (54.14%) in 2010, up from 116.86 (53.89%) in 2000, but 0 .53 percentage points lower than the ratio of 118.59 (54.25%) in 2005. In most western countries, the gender ratio at birth is between 105 boys and 100 girls (51.22%). There are currently about 34 million more men than women in China. In the meantime, China is also faced with a severe aging of the population, which endangers the future sustainability of social systems.
The information on China's fertility rate is not uniform. The 2010 census recorded fertility rates of 1.18 (0.88 in cities, 1.15 in townships, and 1.44 in rural areas). The five regions with the lowest birth rates were Beijing (0.71), Shanghai (0.74), Liaoning (0.74), Heilongjiang (0.75), and Jilin (0.76). The five regions with the highest birth rates were Guangxi (1.79), Guizhou (1.75), Xinjiang (1.53), Hainan (1.51), and Anhui (1.48). However, due to the high number of unregistered births, this number is considered too low. The Ministry of Health and Family Planning estimates the fertility rate at 1.5 to 1.6 children per woman, the UN assumes 1.6 children. Because of the surplus of men, a rate above the limit of 2.1 children would be necessary in China to keep the population stable in the long term.
In 2015, the one-child policy was therefore officially abolished and replaced by a two-child policy. In 2018, the birth rate fell to its lowest level since the People's Republic of China was founded in 1949, despite the abolition of the one-child policy.
In 2020, reports emerged that the Chinese government was increasing the birth control of the Kazakhs and Uyghurs ethnic minorities in Xinjiang. This included the sterilization of people interned in camps and forced abortions. One person was reportedly sentenced to seven years in prison for their seven children.
Future development
The population is expected to decline from around 2025 onwards. The United Nations mean population forecast assumes a population of 1.364 billion in 2050. In 2100 the population is expected to be around 1 billion people and would be back to the level of the 1980s. Other prognoses for the future demographic development of China include continuing urbanization, a high surplus of men in younger age cohorts and a declining number of workers while the number of retirees is rising sharply . By 2050, the proportion of people over 60 could rise to 35.1% or about 430 million people.
statistics
Births and Deaths since 1950
Annual development of births and deaths:
| year | Population (in 1000) |
Births | Deaths | Natural change |
Birth rate (per 1,000 inhabitants) |
Death rate (per 1,000 inh.) |
Change (per 1,000 inhabitants) |
Fertility per woman |
|---|---|---|---|---|---|---|---|---|
| 1950 | 546.815 | 20,232,000 | 9,843,000 | 10,389,000 | 37.0 | 18.0 | 19.0 | 5.29 |
| 1951 | 557,480 | 21,073,000 | 9,923,000 | 11,150,000 | 37.8 | 17.8 | 20.0 | |
| 1952 | 568.910 | 21,050,000 | 9,671,000 | 11,379,000 | 37.0 | 17.0 | 20.0 | |
| 1953 | 581,390 | 21,511,000 | 8,139,000 | 13,372,000 | 37.0 | 14.0 | 23.0 | |
| 1954 | 595.310 | 22,604,000 | 7,846,000 | 14,758,000 | 37.97 | 13.18 | 24.79 | |
| 1955 | 608,655 | 19,842,000 | 7,474,000 | 12,368,000 | 32.60 | 12.28 | 20.32 | 5.98 |
| 1956 | 621.465 | 19,825,000 | 7,085,000 | 12,740,000 | 31.90 | 11.40 | 20.50 | |
| 1957 | 637.405 | 21,691,000 | 6,884,000 | 14,807,000 | 34.03 | 10.80 | 23.23 | |
| 1958 | 653.235 | 19,088,000 | 7,826,000 | 11,262,000 | 29.22 | 11.98 | 17.24 | |
| 1959 | 666.005 | 16,504,000 | 9,717,000 | 6,787,000 | 24.78 | 14.59 | 10.19 | |
| 1960 | 667.070 | 13,915,000 | 16,964,000 | −3,049,000 | 20.86 | 25.43 | −4.57 | 3.99 |
| 1961 | 660.330 | 11,899,000 | 9,403,000 | 2,496,000 | 18.02 | 14.24 | 3.78 | |
| 1962 | 665.770 | 24,640,000 | 6,671,000 | 17,969,000 | 37.01 | 10.02 | 26.99 | |
| 1963 | 682.335 | 29,593,000 | 6,851,000 | 22,742,000 | 43.37 | 10.04 | 33.33 | |
| 1964 | 698.355 | 27,334,000 | 8,031,000 | 19,303,000 | 39.14 | 11.50 | 27.64 | |
| 1965 | 715.185 | 27,091,000 | 6,794,000 | 20,297,000 | 37.88 | 9.50 | 28.38 | 6.02 |
| 1966 | 735,400 | 25,776,000 | 6,494,000 | 19,282,000 | 35.05 | 8.83 | 26.22 | |
| 1967 | 754,550 | 25,625,000 | 6,361,000 | 19,264,000 | 33.96 | 8.43 | 25.53 | |
| 1968 | 774.510 | 27,565,000 | 6,359,000 | 21,206,000 | 35.59 | 8.21 | 27.38 | |
| 1969 | 796.025 | 27,152,000 | 6,392,000 | 20,760,000 | 34.11 | 8.03 | 26.08 | |
| 1970 | 818.315 | 27,356,000 | 6,219,000 | 21,137,000 | 33.43 | 7.60 | 25.83 | 5.75 |
| 1971 | 841.105 | 25,780,000 | 6,157,000 | 19,623,000 | 30.65 | 7.32 | 23.33 | |
| 1972 | 862.030 | 25,663,000 | 6,560,000 | 19,103,000 | 29.77 | 7.61 | 22.16 | |
| 1973 | 881.940 | 24,633,000 | 6,209,000 | 18,424,000 | 27.93 | 7.04 | 20.89 | |
| 1974 | 900,350 | 22,347,000 | 6,609,000 | 15,738,000 | 24.82 | 7.34 | 17.48 | |
| 1975 | 916.395 | 21,086,000 | 6,708,000 | 14,378,000 | 23.01 | 7.32 | 15.69 | 3.58 |
| 1976 | 930.685 | 18,530,000 | 6,747,000 | 11,783,000 | 19.91 | 7.25 | 12.66 | |
| 1977 | 943.455 | 17,860,000 | 6,482,000 | 11,378,000 | 18.93 | 6.87 | 12.06 | |
| 1978 | 956.165 | 17,450,000 | 5,976,000 | 11,474,000 | 18.25 | 6.25 | 12.00 | |
| 1979 | 969.005 | 17,268,000 | 6,018,000 | 11,250,000 | 17.82 | 6.21 | 11.61 | |
| 1980 | 981.235 | 17,868,000 | 6,221,000 | 11,647,000 | 18.21 | 6.34 | 11.87 | 2.32 |
| 1981 | 993.885 | 20,782,000 | 6,321,000 | 14,461,000 | 20.91 | 6.36 | 14.55 | |
| 1982 | 1.008.065 | 21,260,000 | 6,653,000 | 14,607,000 | 22.28 | 6.60 | 15.68 | |
| 1983 | 1,020,180 | 18,996,000 | 7,223,000 | 11,773,000 | 20.19 | 6.90 | 13.29 | |
| 1984 | 1,034,750 | 18,022,000 | 6,890,000 | 11,132,000 | 19.90 | 6.82 | 13.08 | |
| 1985 | 1,045,320 | 21,994,000 | 7,087,000 | 14,907,000 | 21.04 | 6.78 | 14.26 | 2.65 |
| 1986 | 1,066,790 | 23,928,000 | 7,318,000 | 16,610,000 | 22.43 | 6.86 | 15.57 | |
| 1987 | 1,084,035 | 25,291,000 | 7,285,000 | 18,006,000 | 23.33 | 6.72 | 16.61 | |
| 1988 | 1,101,630 | 24,643,000 | 7,315,000 | 17,328,000 | 22.37 | 6.64 | 15.73 | |
| 1989 | 1,118,650 | 24,140,000 | 7,316,000 | 16,824,000 | 21.58 | 6.54 | 15.04 | |
| 1990 | 1,135,185 | 23,910,000 | 7,570,000 | 16,340,000 | 21.06 | 6.67 | 14.39 | 2.43 |
| 1991 | 1,150,780 | 22,650,000 | 7,710,000 | 14,940,000 | 19.68 | 6.70 | 12.98 | |
| 1992 | 1,164,970 | 21,250,000 | 7,740,000 | 13,510,000 | 18.24 | 6.64 | 11.60 | |
| 1993 | 1,178,440 | 21,320,000 | 7,820,000 | 13,500,000 | 18.09 | 6.64 | 11.46 | |
| 1994 | 1,191,835 | 21,100,000 | 7,740,000 | 13,360,000 | 17.70 | 6.49 | 11.21 | |
| 1995 | 1,204,855 | 20,630,000 | 7,920,000 | 12,710,000 | 17.12 | 6.57 | 10.55 | 1.68 |
| 1996 | 1,217,550 | 20,670,000 | 7,990,000 | 12,680,000 | 16.98 | 6.56 | 10.41 | |
| 1997 | 1,230,075 | 20,380,000 | 8,010,000 | 12,370,000 | 16.57 | 6.51 | 10.06 | |
| 1998 | 1,241,935 | 19,420,000 | 8,070,000 | 11,350,000 | 15.64 | 6.50 | 9.14 | |
| 1999 | 1,252,735 | 18,340,000 | 8,090,000 | 10,250,000 | 14.64 | 6.46 | 8.18 | |
| 2000 | 1,262,645 | 17,710,000 | 8,140,000 | 9,570,000 | 14.03 | 6.45 | 7.58 | 1.45 |
| 2001 | 1,271,850 | 17,020,000 | 8,180,000 | 8,840,000 | 13.38 | 6.43 | 6.95 | |
| 2002 | 1,280,400 | 16,470,000 | 8,210,000 | 8,260,000 | 12.86 | 6.41 | 6.45 | |
| 2003 | 1,288,400 | 15,990,000 | 8,250,000 | 7,740,000 | 12.41 | 6.40 | 6.01 | |
| 2004 | 1,296,075 | 15,930,000 | 8,320,000 | 7,610,000 | 12.29 | 6.42 | 5.87 | |
| 2005 | 1,303,720 | 16,170,000 | 8,490,000 | 7,680,000 | 12.40 | 6.51 | 5.89 | 1.51 |
| 2006 | 1,311,020 | 15,840,000 | 7,920,000 | 6,920,000 | 12.09 | 6.81 | 5.28 | |
| 2007 | 1,317,885 | 15,940,000 | 9,130,000 | 6,810,000 | 12.10 | 6.93 | 5.17 | |
| 2008 | 1,324,655 | 16,080,000 | 9,350,000 | 6,730,000 | 12.14 | 7.06 | 5.08 | |
| 2009 | 1,331,380 | 16,150,000 | 9,430,000 | 6,720,000 | 11.95 | 7.08 | 4.87 | |
| 2010 | 1,337,825 | 15,920,000 | 9,510,000 | 6,410,000 | 11.90 | 7.11 | 4.79 | 1.54 |
| 2011 | 1,344,130 | 16,040,000 | 9,600,000 | 6,440,000 | 11.93 | 7.14 | 4.79 | |
| 2012 | 1,353,821 | 16,350,000 | 9,660,000 | 6,690,000 | 12.07 | 7.14 | 4.93 | |
| 2013 | 1,360,720 | 16,400,000 | 9,720,000 | 6,680,000 | 12.08 | 7.16 | 4.92 | |
| 2014 | 1,367,820 | 16,870,000 | 9,770,000 | 7,100,000 | 12.37 | 7.16 | 5.21 | |
| 2015 | 1,374,620 | 16,550,000 | 9,750,000 | 6,800,000 | 12.07 | 7.11 | 4.96 | 1.60 |
| 2016 | 1,382,710 | 17,860,000 | 9,770,000 | 8,090,000 | 12.95 | 7.09 | 5.86 | 1.70 |
| 2017 | 1,390,080 | 17,230,000 | 9,860,000 | 7,370,000 | 12.43 | 7.11 | 5.32 | |
| 2018 | 1,395,380 | 15,230,000 | 9,930,000 | 5,300,000 | 10.94 | 7.13 | 3.81 | |
| 2019 | 1,400,050 | 14,650,000 | 9,980,000 | 4,670,000 | 10.48 | 7.14 | 3.34 |
Other statistics
The following statistics come from the CIA's World Factbook:
Population: 1,384,688,986 (July 2018, extrapolated / estimated)
Age structure:
0-14 years: 17.22%% (male 128,270,371; female 110,120,535)
15-24 years: 12.32% (male 91,443,139; female 79,181,726)
25-54 years: 47.84% (male 338,189,015; female 324,180,103)
55-64 years: 11.35% (male 79,340,391; female 77,857,806)
65 years and older: 11.27% (male 74,277,631; female 81,828,269) (2018 estimated)
Growth rate: 0.37% (2018 estimated)
Median age: 37.7 years (male 36.8 years; female 38.8 years) (2018 estimated)
Birth rate: 12.1 births per 1,000 population (2018 estimated)
Mortality rate: 8.0 deaths per 1,000 population (2018 estimated)
Net migration rate: −0.4 migrants per 1,000 inhabitants (2018 estimated)
Gender distribution:
Birth: 1.14 male / female
under 15 years: 1.17 male / female
15-24 years: 1.14 male / female
25-54 years: 1.04 male / female
55-64 years: 1.02 male / female
65 years and older: 0.92 male / female
Total population: 1.06 male / female (2018 estimated)
Child mortality rate: 11.8 deaths / 1,000 live births (2018 estimated)
Life expectancy at birth:
Total population: 75.8 years
male: 73.7 years
female: 78.1 years (2018 estimated)
Fertility: 1.60 children born per woman (2018 estimated)
Literacy rate:
Total population: 96.4%
male: 98.2%
female: 94.5% (2015 estimated)
ethnicities
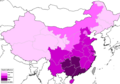
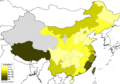
The People's Republic of China officially recognizes 56 different ethnic groups. The largest of these are the Han , who made up 91.6% of the total population in 2010. Han Chinese are the largest ethnic group in the world and form the majority in all provinces of the country with the exception of Xinjiang and Tibet . Ethnic minorities made up 8.4% or 112 million people in 2010. In the past few decades, ethnic minorities had higher growth rates than the majority of the Han population because they were not subject to the one-child policy. Their population share in China increased from 6.1% in 1953 to 8.04% in 1990, 8.47% in 2000 and in 2010 it was 8.4%. The large ethnic minorities (data based on the 2010 census) include the Zhuang (17 million, 1.27%), Hui (10 million, 0.79%), Manchu (10 million, 0.78%), Uighurs (10th Million, 0.76%), Miao (9 million, 0.71%), Yi (9 million, 0.65%), Tujia (8 million, 0.63%), Tibetans (6 million, 0.47% ), Mongols (5 million, 0.45%), Dong (3 million, 0.22%), Buyei (3 million, 0.22%), Bai (2 million, 0.15%) and Koreans (2 million , 0.14%).
A total of 297 different languages and dialects belonging to different language families are spoken in China. Besides minority languages, not all Han speak the same language. The language Mandarin is widespread mainly in the center and north of China and is spoken by around 900 million people as their mother tongue and learned by many Chinese as a second language, as it is the country's official language . Other important languages in China are Wu (80 million speakers), Cantonese (74 million) and Min Nan (50 million). Also worth mentioning are Jin , Gan , Zhuang , Hmong , Uighur and Tibetan .
Fertility rate per woman by ethnic group (2010 census): Han (1.14), Zhuang (1.59), Hui (1.48), Manchu (1.18), Uyghur (2.04), Miao (1, 82), Yi (1.82), Tujia (1.74) Tibetans (1.60), Mongols (1.26).
| Ethnic group | Language family | 1953 | % | 1964 | % | 1982 | % | 1990 | % | 2000 | % | 2010 | % |
|---|---|---|---|---|---|---|---|---|---|---|---|---|---|
| Han | Sinotibian | 547.283.057 | 93.94 | 651.296.368 | 94.22 | 936.703.824 | 93.30 | 1,039,187,548 | 91.92 | 1,137,386,112 | 91.53 | 1,220,844,520 | 91.60 |
| Minorities | 35.320.360 | 6.06 | 39,883,909 | 5.78 | 67.233.254 | 6.67 | 90,570,743 | 8.01 | 105.225.173 | 8.47 | 111.966.349 | 8.40 | |
| Zhuang | Tai-Kadai | 6,611,455 | 1.13 | 8,386,140 | 1.21 | 13,441,900 | 1.32 | 15,555,820 | 1.38 | 16,178,811 | 1.28 | 16,926,381 | 1.27 |
| Hui | Sinotibian | 3,559,350 | 0.61 | 4,473,147 | 0.64 | 7.207.780 | 0.71 | 8,612,001 | 0.76 | 9,816,802 | 0.78 | 10,586,087 | 0.79 |
| Manchu | Tungusian | 2,418,931 | 0.42 | 2,695,675 | 0.39 | 4,299,950 | 0.43 | 9,846,776 | 0.87 | 10,682,263 | 0.84 | 10,387,958 | 0.78 |
| Uighurs | Turkish | 3,640,125 | 0.62 | 3,996,311 | 0.58 | 5,917,030 | 0.59 | 7.207.024 | 0.64 | 8,399,393 | 0.66 | 10,069,346 | 0.76 |
| Miao | Hmong Mien | 2,511,339 | 0.43 | 2,782,088 | 0.40 | 5,017,260 | 0.50 | 7,383,622 | 0.65 | 8,940,116 | 0.71 | 9,426,007 | 0.71 |
| Yi | Tibeto Burmese | 3,254,269 | 0.56 | 3,380,960 | 0.49 | 5,492,330 | 0.54 | 6,578,524 | 0.58 | 7,762,286 | 0.61 | 8,714,393 | 0.65 |
| Tujia | Tibeto Burmese | 284,900 | 0.03 | 5,725,049 | 0.51 | 8,028,133 | 0.63 | 8,353,912 | 0.63 | ||||
| Tibetans | Tibeto Burmese | 2,775,622 | 0.48 | 2,501,174 | 0.36 | 3,821,950 | 0.38 | 4,593,072 | 0.41 | 5,416,021 | 0.43 | 6,282,187 | 0.47 |
| Mongols | Mongolian | 1,462,956 | 0.25 | 1,965,766 | 0.28 | 3,402,200 | 0.34 | 4,802,407 | 0.42 | 5,813,947 | 0.46 | 5,981,840 | 0.45 |
| Dong | Tai-Kadai | 712.802 | 0.12 | 836.123 | 0.12 | 1,446,190 | 0.14 | 2,508,624 | 0.22 | 2,960,293 | 0.24 | 2,879,974 | 0.22 |
| Buyei | Tai-Kadai | 1,247,883 | 0.21 | 1,348,055 | 0.19 | 2.103.150 | 0.21 | 2,548,294 | 0.22 | 2,971,460 | 0.23 | 2,870,034 | 0.22 |
| Yao | Hmong Mien | 665.933 | 0.11 | 857.265 | 0.12 | 1,414,870 | 0.14 | 2,137,033 | 0.19 | 2,637,421 | 0.21 | 2,796,003 | 0.21 |
| Bai | Sinotibian | 567.119 | 0.10 | 706.623 | 0.10 | 1,147,360 | 0.11 | 1,598,052 | 0.14 | 1,858,063 | 0.15 | 1,933,510 | 0.15 |
| Korean | Korean | 1,120,405 | 0.19 | 1,339,569 | 0.19 | 1,783,150 | 0.18 | 1,923,361 | 0.17 | 1,923,842 | 0.15 | 1,830,929 | 0.14 |
| Hani | Tibeto Burmese | 481.220 | 0.08 | 628.727 | 0.09 | 1,063,300 | 0.11 | 1,254,800 | 0.11 | 1,439,673 | 0.12 | 1,660,932 | 0.12 |
| Li | Tai-Kadai | 360,950 | 0.06 | 438.813 | 0.06 | 882.030 | 0.09 | 1,112,498 | 0.10 | 1,247,814 | 0.10 | 1,463,064 | 0.11 |
| Kazakhs | Turkish | 509.375 | 0.09 | 491,637 | 0.08 | 878.570 | 0.09 | 1,110,758 | 0.10 | 1,250,458 | 0.10 | 1,462,588 | 0.11 |
| Dai | Tai-Kadai | 478,966 | 0.08 | 535.389 | 0.08 | 864.340 | 0.09 | 1,025,402 | 0.09 | 1,158,989 | 0.09 | 1,261,311 | 0.09 |
| She | Hmong Mien | 234.167 | 0.03 | 379.080 | 0.04 | 634,700 | 0.06 | 709.592 | 0.06 | 708.651 | 0.05 | ||
| Lisu | Tibeto Burmese | 317,465 | 0.05 | 270,628 | 0.04 | 466.760 | 0.05 | 574,589 | 0.05 | 634.912 | 0.05 | 702.839 | 0.05 |
| Dongxiang | Mongolian | 155,761 | 0.03 | 147,443 | 0.02 | 279,523 | 0.03 | 373,669 | 0.03 | 513,805 | 0.04 | 621,500 | 0.05 |
| Gelao | Tai-Kadai | 26,852 | 0.00 | 59,810 | 0.01 | 438.192 | 0.04 | 579.357 | 0.05 | 550.746 | 0.04 | ||
| Lahu | Tibeto Burmese | 139.060 | 0.02 | 191.241 | 0.03 | 320,350 | 0.03 | 411,545 | 0.04 | 453.705 | 0.04 | 485.966 | 0.04 |
| Va | Austro-Asian | 286.158 | 0.05 | 200.272 | 0.03 | 271.050 | 0.03 | 351.980 | 0.03 | 396.610 | 0.03 | 429,709 | 0.03 |
| Sui | Tai-Kadai | 133,566 | 0.02 | 156.099 | 0.02 | 300,690 | 0.03 | 347.116 | 0.03 | 406.902 | 0.03 | 411,847 | 0.03 |
| Naxi | Tibeto Burmese | 143,453 | 0.02 | 156,796 | 0.02 | 248,650 | 0.02 | 277,750 | 0.02 | 308,839 | 0.02 | 326.295 | 0.02 |
| Qiang | Tibeto Burmese | 35,660 | 0.00 | 49.105 | 0.00 | 109,760 | 0.01 | 198,303 | 0.02 | 306.072 | 0.02 | 309.576 | 0.02 |
| Do | Mongolian | 53,277 | 0.01 | 77,349 | 0.01 | 148.760 | 0.01 | 192,568 | 0.02 | 241.198 | 0.02 | 289,565 | 0.02 |
| Mulao | Tai-Kadai | 52,819 | 0.00 | 91,790 | 0.01 | 160,648 | 0.01 | 207.352 | 0.02 | 216.257 | 0.02 | ||
| Xibe | Tungusian | 19,022 | 0.00 | 33,438 | 0.00 | 77,560 | 0.01 | 172.932 | 0.02 | 188,824 | 0.02 | 190.481 | 0.01 |
| Kyrgyz | Turkish | 70,944 | 0.01 | 70.151 | 0.01 | 108,790 | 0.01 | 143,537 | 0.01 | 160,823 | 0.01 | 186,708 | 0.01 |
| Jingpo | Tibeto Burmese | 101,852 | 0.01 | 57,762 | 0.00 | 100.180 | 0.01 | 119.276 | 0.01 | 132.143 | 0.01 | 147,828 | 0.01 |
| Daur | Mongolian | 63,394 | 0.00 | 94.126 | 0.01 | 121,463 | 0.01 | 132.143 | 0.01 | 131.992 | 0.01 | ||
| Salar | Turkish | 30,658 | 0.00 | 69,135 | 0.01 | 68.030 | 0.01 | 82,398 | 0.01 | 104.503 | 0.01 | 130.607 | 0.01 |
| Blang | Austro-Asian | 39,411 | 0.00 | 58,473 | 0.01 | 87,546 | 0.01 | 91,882 | 0.01 | 119,639 | 0.01 | ||
| Maonan | Tai-Kadai | 22,382 | 0.00 | 37,450 | 0.00 | 72,370 | 0.01 | 107.106 | 0.01 | 101.192 | 0.01 | ||
| Tajiks | Indo-European (Iranian) | 14,462 | 0.00 | 16,236 | 0.00 | 27,430 | 0.00 | 33,223 | 0.00 | 41,028 | 0.00 | 51,069 | 0.00 |
| Pumi | Tibeto Burmese | 14,298 | 0.00 | 18,860 | 0.00 | 29,721 | 0.00 | 33,600 | 0.00 | 42,861 | 0.00 | ||
| Achang | Tibeto Burmese | 12,032 | 0.00 | 31,490 | 0.00 | 27,718 | 0.00 | 33,936 | 0.00 | 39,555 | 0.00 | ||
| Nu | Tibeto Burmese | 15,047 | 0.00 | 25,980 | 0.00 | 27,190 | 0.00 | 28,759 | 0.00 | 37,523 | 0.00 | ||
| Evenki | Tungusian | 4,957 | 0.00 | 9,681 | 0.00 | 19,440 | 0.00 | 26,379 | 0.00 | 30.505 | 0.00 | 30,875 | 0.00 |
| Vietnamese | Austro-Asian | 12,140 | 0.00 | 18,749 | 0.00 | 22,517 | 0.00 | 28.199 | 0.00 | ||||
| Jino | Tibeto Burmese | 11,260 | 0.00 | 18,022 | 0.00 | 20,899 | 0.00 | 23,143 | 0.00 | ||||
| De'ang | Austro-Asian | 15,461 | 0.00 | 17,935 | 0.00 | 20,556 | 0.00 | ||||||
| Bonan | Mongolian | 4,957 | 0.00 | 5.125 | 0.00 | 6,620 | 0.00 | 12,683 | 0.00 | 16,505 | 0.00 | 20,074 | 0.00 |
| Russians | Indo-European (Slavic) | 22,656 | 0.00 | 1,326 | 0.00 | 2.830 | 0.00 | 13,500 | 0.00 | 15,609 | 0.00 | 15,393 | 0.00 |
| Yugur | Turkish | 3,861 | 0.00 | 5,717 | 0.00 | 7,670 | 0.00 | 12,293 | 0.00 | 13,719 | 0.00 | 14,378 | 0.00 |
| Uzbeks | Turkish | 13,626 | 0.00 | 7,717 | 0.00 | 13,810 | 0.00 | 14,763 | 0.00 | 13,370 | 0.00 | 10,569 | 0.00 |
| Monba | Tibeto Burmese | 3,809 | 0.00 | 1,040 | 0.00 | 7,498 | 0.00 | 8,923 | 0.00 | 10,561 | 0.00 | ||
| Oroqen | Tungusian | 2,262 | 0.00 | 2,709 | 0.00 | 2,280 | 0.00 | 7.004 | 0.00 | 8,196 | 0.00 | 8,659 | 0.00 |
| Derung | Tibeto Burmese | 4,250 | 0.00 | 5,825 | 0.00 | 7,426 | 0.00 | 6,930 | 0.00 | ||||
| Hezhen | Tungusian | 718 | 0.00 | 670 | 0.00 | 4,254 | 0.00 | 4,640 | 0.00 | 5,354 | 0.00 | ||
| Gaoshan | Austronesian | 329 | 0.00 | 366 | 0.00 | 1,750 | 0.00 | 2,877 | 0.00 | 4,461 | 0.00 | 4,009 | 0.00 |
| Lhoba | Tibeto Burmese | 1,030 | 0.00 | 2,322 | 0.00 | 2,965 | 0.00 | 3,682 | 0.00 | ||||
| Tatars | Turkish | 6,929 | 0.00 | 2,294 | 0.00 | 7,510 | 0.00 | 5,064 | 0.00 | 4,890 | 0.00 | 3,556 | 0.00 |
| Others | 3,370,880 | 0.33 | 3,498 | 0.00 | 734.379 | 0.06 | 640.101 | 0.05 | |||||
| Unknown | 4,720 | 0.00 | 752.347 | 0.07 | 735.379 | 0.06 | - | - | |||||
| Unknown foreigners | - | - | - | - | 941 | 0.00 | 1,448 | 0.00 | |||||
| total | 582,603,417 | 694,581,759 | 1.008.175.288 | 1,133,682,501 | 1,242,612,226 | 1,332,810,869 | |||||||
Foreigners
The 2010 census counted 234,829 people from Hong Kong (Chinese citizens), 21,201 people from Macau (Chinese citizens), 170,283 people from Taiwan , and 593,832 people from other places, for a total of 1,020,145 people. The proportion of foreigners in the country is among the lowest in the world. Most of the foreign citizens came from the following countries in 2010:
| nationality | number |
|---|---|
|
|
120,750 |
|
|
71,493 |
|
|
66,159 |
|
|
39,776 |
|
|
36.205 |
|
|
19,990 |
|
|
15,087 |
|
|
15.051 |
|
|
14,446 |
|
|
13,286 |
| other | 181,589 |
Diaspora
Over the centuries, many people have left China and settled abroad for various reasons. The number of people of Chinese origin who live abroad is therefore estimated at around 50 million, making them one of the largest diaspora groups in the world. The preferred emigration destination has historically been Southeast Asia , where there has been a strong Chinese presence for many centuries. The proportion of people of Chinese origin in Singapore is over 75%, approx. 23% in Malaysia , approx. 14% in Thailand , approx. 10% in Brunei and approx. 1% in Indonesia , Vietnam and the Philippines . Many members of these Chinese minorities have achieved prosperity and influence there (bamboo network).
More recently, many Chinese have emigrated to North America , Australia , Europe and, increasingly, Africa , where the Chinese make up significant minorities. Approximately 8 million people born in the People's Republic of China currently live abroad. The so-called birth tourism, in which a woman gives birth to her child in another country, is increasingly widespread among the Chinese upper class so that the child later has a right to citizenship of the corresponding state. The main destinations for birth tourism are Canada , Australia and the United States .
In 2015, more than 500,000 students from the People's Republic of China studied abroad.
Most Chinese immigrants lived in the following countries in 2017:
| country | number |
|---|---|
|
|
2,422,998 |
|
|
741.012 |
|
|
711,555 |
|
|
614.012 |
|
|
472.931 |
|
|
207.278 |
|
|
203,959 |
|
|
166,646 |
|
|
157.190 |
|
|
102,709 |
health
The National Health and Family Planning Commission, together with its colleagues in the local commissions, monitors the health needs of the Chinese people. A focus on public health and preventive medicine has shaped Chinese health policy since the early 1950s. At that time, the Communist Party launched the Patriotic Health Campaign, which aimed to improve hygiene, and treat and prevent various diseases. Diseases such as cholera , typhoid and scarlet fever , which were previously widespread in China, were all but wiped out by the campaign. After Deng Xiaoping began introducing economic reforms in 1978, the health of the Chinese people improved rapidly due to better nutrition, although many of the free public health services in the countryside along with the people's communes disappeared. The health system in China was largely privatized and experienced a significant increase in quality. In 2009, the government launched a three-year major health initiative with investments valued at $ 124 billion. In 2011, the program resulted in 95% of the Chinese population having basic health insurance coverage. It was estimated that China was the third largest supplier of medicines in the world in 2011, but its population has suffered from the development and distribution of counterfeit medicines .
In 2016, the average life expectancy at birth in China was 76.3 years and the infant mortality rate was 0.7 percent in 2018. Both have improved significantly since the 1950s. The stunted growth of young children caused by malnutrition decreased from 33.1% in 1990 to 9.9% in 2010. Despite significant improvements in health and the construction of advanced medical facilities, there are several public health problems in China, such as respiratory diseases caused by widespread air pollution , hundreds of millions of cigarette smokers, and an increase in obesity among urban youth. China's large population and densely populated cities have led to serious disease outbreaks in recent years , such as the SARS outbreak in 2003, although these have largely been pushed back since then. In 2010, air pollution caused 1.2 million deaths. At the end of 2019, a severe outbreak of the novel SARS-CoV-2 virus began in central China, marking the start of the global COVID-19 pandemic .
| period |
Life expectancy in years |
period |
Life expectancy in years |
|---|---|---|---|
| 1950-1955 | 43.8 | 1985-1990 | 68.9 |
| 1955-1960 | 44.5 | 1990-1995 | 69.7 |
| 1960-1965 | 44.6 | 1995-2000 | 70.9 |
| 1965-1970 | 55.5 | 2000-2005 | 73.1 |
| 1970-1975 | 61.7 | 2005-2010 | 74.7 |
| 1975-1980 | 65.5 | 2010-2015 | 75.7 |
| 1980-1985 | 67.8 |
Source: UN World Population Prospects
religion

Followers of Chinese folk religions (ancestor worship)

Followers of Chinese folk religions (Confucianism and jiaohua)
Followers of Taoism
Followers of Buddhism

Followers of Christianity

Followers of islam
.png)
.png)
.png)
.png)
.png)
.png)
The government of the People's Republic of China is officially atheist , despite the fact that Chinese civilization has historically hosted a variety of the most enduring religious and philosophical traditions in the world. Confucianism and Taoism, and later Buddhism, form the “three teachings” that have shaped Chinese culture. There are often no clear boundaries between these religious systems, which do not claim to be exclusive, and elements of popular religion. The Christianity and Islam arrived in the 7th century to China. Christianity did not establish itself until it was revitalized by Jesuit missionaries in the 16th century .
In the early 20th century, reform-minded officials and intellectuals attacked all religions as "superstitious". Since 1949, China has been ruled by the Communist Party, an atheist organization that forbids party members from practicing religion while in office. The government officially recognizes five religions: Buddhism, Taoism, Catholicism , Protestantism and Islam. In the early 21st century, Confucianism and Chinese folk religions were officially recognized as part of China's cultural heritage.
According to estimates by the CIA, 21.9% of the population were followers of Chinese folk religions, 18.2% are Buddhists, 5.1% Christians, 1.8% Muslims and 0.7% are members of other religions. A majority of 52.2% does not belong to any religious group, which is one of the highest values in the world. Even if the situation has improved since the Cultural Revolution, religious minorities continue to be victims of repression and persecution.
urbanization

Until 1979, the government set an upper limit for the urban population, thus preventing urbanization . The urbanization process began in China with economic liberalization and increasing industrialization from the 1980s. Since then, hundreds of millions of people have moved to the country's cities. There was also migration from the inner provinces such as Sichuan or Yunnan to the booming coastal cities. People from these provinces often live as migrant workers in the big cities and still have relatives in their home countries. The number of these people is estimated at over 200 million.
In 2017, approximately 58% of China's population lived in cities, which is 803 million people and is the largest urban population in the world. The rural-city migration in China thus represents one of the largest population movements in history. Even if precarious living conditions exist in the cities, thanks to very high investments in the infrastructure, a slump in the cities could be largely prevented. Due to the Houkou system , however, many younger urban migrants are still excluded from many state services and disadvantaged compared to long- established urban residents. It is estimated that there will be an additional 250 million migrants in Chinese cities by 2030, increasing the urban population to 1 billion.
Characteristic of the country's urban boom is the city of Shenzhen in the southern province of Guangdong , which grew from a fishing village with 3,000 residents to a mega-city with over 10 million residents. Almost all of the country's major cities have at least doubled their population since 1995.
The following table shows the development of the population of the 10 largest urban agglomerations (in thousands of people) in China according to estimates by the UN:
| Rank 2018 |
Agglomeration | Population 1950 |
Population 1970 |
Population 1990 |
Population 2000 |
Population 2010 |
Population 2018 |
|---|---|---|---|---|---|---|---|
| 1 | Shanghai | 4,288 | 6,052 | 8,606 | 14,247 | 20,314 | 25,582 |
| 2 | Beijing | 1,671 | 4,426 | 6,788 | 10,285 | 16,441 | 19,618 |
| 3 | Chongqing | 1,567 | 2,237 | 4.011 | 7,863 | 11,244 | 14,838 |
| 4th | Tianjin | 2,467 | 3,318 | 4,558 | 6,989 | 10.150 | 13,215 |
| 5 | Guangzhou | 1,049 | 1,155 | 1,542 | 3,246 | 7,812 | 12,638 |
| 6th | Shenzhen | 3 | 22nd | 875 | 6,550 | 10,223 | 11,908 |
| 7th | Cheng you | 646 | 1,750 | 2,955 | 4,607 | 7,573 | 8,813 |
| 8th | Nanjing | 1,037 | 1,459 | 2,893 | 4,279 | 6.162 | 8,245 |
| 9 | Wuhan | 1,068 | 2,039 | 3,417 | 6,638 | 7,515 | 8,176 |
| 10 | Xi'an | 575 | 960 | 2,221 | 3,788 | 5,526 | 7,444 |
See also
Individual evidence
- ↑ a b c World Population Prospects - Population Division - United Nations . Retrieved February 22, 2019.
- ↑ a b c d e f g h i j k l m n The World Factbook, CIA , as of 2019; Accessed February 14, 2019
- ^ A b National National Economic Performance Maintained within an Appropriate Range in 2018 with Main Development Goals Achieved . Retrieved February 22, 2019.
- ↑ Factbox: China's 2010 Census . In: Reuters . April 28, 2011 ( reuters.com [accessed February 19, 2019]).
- ↑ a b Judith Banister: A Brief History of China's Population . In: A Brief History of China's Population, The Population of Modern China 1992, ISBN 978-0-306-44138-7 , pp. 51-57, doi : 10.1007 / 978-1-4899-1231-2_3 .
- ↑ Peng Xizhe (彭希哲), Demographic Consequences of the Great Leap Forward in China's Provinces , Population and Development Review 13, no. 4 (1987), 639-70. For a summary of other estimates, please refer to Necrometrics
- ↑ a b 中华人民共和国 国家 统计局 >> 人口普查 公报 . Archived from the original on December 27, 2013. Retrieved October 14, 2013.
- ↑ Thomas Scharping : Population Policy and Demographic Development: Old Problems, New Perspectives . In: Doris Fischer (Ed.): Country Report China . Federal Agency for Civic Education, 2014, p. 71 ff .
- ^ Yong Cai: China's New Demographic Reality: Learning from the 2010 Census . In: Popul Dev Rev . tape 39 , no. 3 , September 1, 2013, p. 371–396 , doi : 10.1111 / j.1728-4457.2013.00608.x , PMID 25620818 (English).
- ↑ a b Hendrik Ankenbrand, Shanghai: Consequences of the one-child policy: In China there are 34 million men too many . ISSN 0174-4909 ( faz.net [accessed February 19, 2019]).
- ^ "Chinese mainland gender ratios most balanced since 1950s: census data" . Xinhua . April 28, 2011
- ↑ Demography: Ancient China . In: ZEIT ONLINE . ( zeit.de [accessed on February 22, 2019]).
- ↑ 财 新网 - 原创 财经 新 媒体 -CAIXIN.COM . Retrieved August 31, 2017.
- ↑ a b c New fertility changes and characteristics from the sixth population census in China (PDF) August 31, 2017. Retrieved February 22, 2019.
- ^ ZEIT ONLINE: Family policy: China ends one-child policy . In: The time . October 29, 2015, ISSN 0044-2070 ( zeit.de [accessed February 18, 2019]).
- ↑ Deutsche Welle (www.dw.com): China's birth rate falls to historic low | DW | 01/21/2019. Retrieved January 27, 2019 (UK English).
- ↑ China is preparing to end the two-child policy. Tagesspiegel, accessed on February 19, 2019 .
- ↑ tagesschau.de: Uyghurs in China: Violent birth control. Retrieved July 29, 2020 .
- ↑ Bernhard Zand, DER SPIEGEL: China: Uyghur women should be forced to sterilize and have an abortion - DER SPIEGEL - Politics. Retrieved July 29, 2020 .
- ↑ China: population share aged 60 and older until 2100 | Statistic. Retrieved February 18, 2019 .
- ↑ Peng Du, Hui Yang: China's population aging and active aging . In: China Journal of Social Work . 3, No. 2-3, 2010, pp. 139-152. doi : 10.1080 / 17525098.2010.492636 .
- ^ National Bureau of Statistics of China. Retrieved February 22, 2019 .
- ↑ National Bureau of Statistics of China: China Statistical yearbook 2011, chapter 3 Population . October 14, 2013.
- ^ Max Roser: Fertility Rate . In: Our World in Data . February 19, 2014 ( ourworldindata.org [accessed February 22, 2019]).
- ↑ China's Economy Realized a Moderate but Stable and Sound Growth in 2015 . Retrieved August 31, 2017.
- ↑ a b Global Times: Two-child policy brings China 1 million more newborns in 2016 - Global Times . Retrieved August 31, 2017.
- ^ National Economy Maintained the Momentum of Stable and Sound Development and Exceeded the Expectation . Retrieved February 22, 2019.
- ↑ National Economy was Generally Stable in 2019 with Main Projected Targets for Development Achieved. In: NBSC. Retrieved February 20, 2020 .
- ↑ Lilly, Amanda: A Guide to China's Ethnic Groups . In: Washington Post , July 7, 2009. Archived from the original on December 9, 2013.
- ^ Rachel Deason: 9 Languages Besides Mandarin That Are Still Spoken in China. Retrieved February 22, 2019 .
- ↑ Summary by language size. Retrieved February 22, 2019 .
- ↑ 2-1 全国 各 民族 分 年龄 、 性别 的 人口 (XLS) Accessed August 31, 2017.
- ↑ Major Figures on Residents from Hong Kong, Macao and Taiwan and Foreigners Covered by 2010 Population Census . Archived from the original on May 14, 2011. Retrieved October 14, 2013.
- ↑ Reforms urged to attract overseas Chinese - China.org.cn. Retrieved February 19, 2019 .
- ↑ ASIA: Like bamboo in the wind . In: Der Spiegel . tape 8 , February 16, 1998 ( spiegel.de [accessed February 19, 2019]).
- ↑ Johnny Erling: Quickly to America when the baby comes . May 28, 2015 ( welt.de [accessed February 22, 2019]).
- ↑ In 2015, more than 500,000 Chinese students studied abroad_China.org.cn. Retrieved February 22, 2019 .
- ↑ World Migration. January 15, 2015, accessed February 19, 2019 .
- ^ Ministry National Health and Family Planning Commission . nhfpc.gov.cn. Archived from the original on September 28, 2014. Info: The archive link was inserted automatically and has not yet been checked. Please check the original and archive link according to the instructions and then remove this notice. Retrieved September 6, 2015.
- ↑ China's $ 124 Billion Health-Care Plan Aims to Boost Consumption . In: Bloomberg LP , January 22, 2009.
- ↑ Great Progress, but More Is Needed . In: New York Times , November 1, 2011.
- ↑ David Barboza: 2,000 Arrested in China in Counterfeit Drug Crackdown . In: New York Times , August 5, 2012. Retrieved March 23, 2013.
- ↑ Life expectancy at birth, total (years) | Data. Retrieved February 19, 2019 .
- ↑ Mortality rate, infant (per 1,000 live births) | Data. Retrieved February 19, 2019 .
- ^ R. Stone: Despite Gains, Malnutrition Among China's Rural Poor Sparks Concern . In: Science . 336, No. 6080, 2012, p. 402. bibcode : 2012Sci ... 336..402S . doi : 10.1126 / science.336.6080.402 . PMID 22539691 .
- ↑ Fat children in China - this is how the state takes action. Retrieved February 22, 2019 .
- ^ Edward Wong: Air Pollution Linked to 1.2 Million Premature Deaths in China . In: New York Times , April 1, 2013.
- ↑ a b China's Communist Party and Religion - Churches in a Cage. Retrieved on February 19, 2019 (German).
- ↑ A Centenary Mission - Jesuit Influence in China. Retrieved February 22, 2019 .
- ^ Philipp Gessler: Religious persecution in China: The underground priests . In: The daily newspaper: taz . November 23, 2010, ISSN 0931-9085 ( taz.de [accessed on February 18, 2019]).
- ↑ China Now Has More Than 260 Million Migrant Workers Whose Average Monthly Salary Is 2,290 Yuan ($ 374.09) . In: International Business Times , May 28, 2013.
- ↑ Urban population (% of total) | Data. Retrieved February 18, 2019 .
- ↑ Zai Liang, Zhongdong Ma: China's floating population: new evidence from the 2000 census . In: Population and Development Review . 30, No. 3, 2004, pp. 467-488. doi : 10.1111 / j.1728-4457.2004.00024.x .
- ↑ How cities determine the future of China | Robert Bosch Foundation. Retrieved February 18, 2019 .
- ↑ World Urbanization Prospects - Population Division - United Nations. Retrieved February 22, 2019 .