
Economy of Poland
| Poland | |
|---|---|

|
|
| World economic rank | 24. (nominal) (2017) |
| currency | Zloty (PLN) |
| Conversion rate | 1 PLN = 0.25324 EUR |
| Trade organizations |
EU , WTO , OECD |
| Key figures | |
|
Gross domestic product (GDP) |
$ 524.9 billion (nominal) (2017) $ 1,121.0 billion ( PPP ) (2017) |
| GDP per capita | $ 13,822 (nominal) (2017) $ 29,521 (PPP) (2017) |
| GDP by economic sector |
Agriculture : 3.5% (2010) Industry : 31.7% (2010) Services : 64.7% (2010) |
| growth | 3.9% (2015) |
| inflation rate | -0.9% (2015) |
| Employed | 13.782 million (2009) |
| Employed persons by economic sector |
Agriculture : 15.4% (2010) Industry : 27.4% (2010) Services : 57.2% (2010) |
| Activity rate | 36.1% (real) |
| Unemployed | 2.15 million (February 2011) |
| Unemployment rate |
CIS : 8.5% (August 2016) Eurostat : 5.9% (August 2016) |
| Foreign trade | |
| export | $ 199.4 billion (2015) |
| Export goods | Machines, automobile parts, chemical products |
| Export partner |
Germany : 27.1% (2015) Great Britain : 6.8% (2015) Czech Republic : 6.6% (2015) |
| import | $ 195.2 billion (2015) |
| Import goods | Machinery, technology, chemical products |
| Import partner |
Germany : 22.9% (2015) China : 11.3% (2015) Russia : 7.4% (2015) |
| Foreign trade balance | US $ 4.2 billion (2015) |
| public finances | |
| Public debt | 51.4% of GDP (2017) |
| Government revenue | 39.6% of GDP (2017) |
| Government spending | 41.2% of GDP (2017) |
| Budget balance | 1.7% of GDP (2017) |
.jpg)
In 2015, Poland's economy was the twenty-fifth largest economy in the world , measured against the then gross domestic product of $ 474.9 billion . In 2014 it was the eighth largest economy in the EU with a GDP roughly the size of Belgium.
history
Poland-Lithuania
The basis of the country's wealth was agriculture with the export of grain, cattle and forest products. Seven to ten percent of Poland's total grain production of around 1.5 million tons was exported, with the Netherlands being the main buyer with 80 percent. The grain trade ensured that the republic's foreign trade balance was mostly positive. Poland also exported potash , wool, textiles, as well as fur and leather products. This resulted in a high degree of susceptibility to economic fluctuations on the European markets. In addition to cloth, iron and steel, the imported goods mainly included metal products such as scythes, sickles and weapons. The first factories with up to 40 workers emerged in the 16th century .
German occupation of Poland
In a meeting with senior officers of the Wehrmacht on May 23, 1939, Hitler had already given economic reasons for the decision to attack Poland: "For us it is about expanding the living space in the east and ensuring food." Against this background the Wehrmacht had been instructed to ensure that economic life could soon be resumed. The OKH therefore issued the following principle on October 3, 1939: "The economic forces of the country will be put fully at the service of the German war economy ." The Economic and Armaments Office (WiRüAmt) assumed a longer war for which one had to mobilize the economic forces of the occupied country. The kidnapping of 2.81 million Polish citizens for forced labor served this purpose .

Poster for recruiting Polish workers, 1940/1941
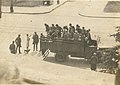
Arbitrary arrest for forced labor, Warsaw 1941
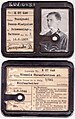
ID card of a 16-year-old Polish forced laborer at Kienzle Uhren

Marking for Polish forced laborers

Facsimile of a Poland decree , March 8, 1940


“Aryanization” of Poland's economy

Due to the disenfranchisement of the Polish (Slavic and Jewish) population and their increasing deportation and liquidation, at the beginning of the occupation, Polish assets were taken away for individual or local use. This was institutionalized through the establishment of the "General Government Trust Office" and the "Main Trust Office East". The Ordinance on the Treatment of Property of Members of the Former Polish State of September 17, 1940 was adopted as the legal basis . Numerous Aryan entrepreneurs and banks founded or bought assets cheaply. One of the best known is the dazzling Oskar Schindler , who saved the lives of numerous Jews.
Economy in the annexed provinces
The industrially and agriculturally developed areas of Poland were annexed on October 26, 1939. Before the war, 100 percent of Poland's coal, 100 percent of zinc, 97.5 percent of pig iron, 90 percent of steel and 70 percent of sugar were produced in these areas. 80 percent of Poland's industrial operations were concentrated in these areas and the grain yields were considerably higher than the national average. The remaining part of occupied Poland was made the " General Government", which was to be de-industrialized, home for a people of migrant workers and dumping ground for "undesirable" sections of the population in Germany.
The objective was to quickly integrate the local economy into the economy of the German Reich and to use all raw materials and labor resources for the war effort. In particular, Poles and Jews were to be expropriated and production increased. Initially, the assets of the Polish state institutions, political organizations and religious communities were confiscated by the newly established Central Trust Agency East (HTO). Private businesses and companies owned by Poles and Jews were also confiscated. In this way, almost 100% of the property that went to the German civil authorities, the NSDAP, the Wehrmacht, the SS, settlers or German bomb victims was confiscated. Furthermore, workers were recruited for German industry or later forced into employment. A total of around 2.8 million Polish forced laborers were deported from all territories, so that in the Wartheland, for example, a population decline of 12.2% was recorded.
The industrial area in Upper Silesia was of particular importance . In this area there were 1764 companies with 65 hard coal mines alone (production: 79 million t), 24 ore mines (production: 60,000 t), 96 iron works (production: 3 million t of crude steel and 1.9 million t of steel), 67 Chemical plants, four power plants and seven cement plants and a total of 178,449 skilled workers (as of 1940). In particular, steel and hard coal production played a significant role in the war economy . Industrial production was systematically increased, while 75% of the craft businesses and retail stores were closed without replacement by 1942.
Agriculture also gained great importance in the annexed provinces, especially in the Wartheland , which was considered a surplus area. The large Polish companies were dissolved and given to prominent National Socialists or high officers. Only in West Prussia and Southeast Prussia could Polish farmers stay on their farms, but had to deliver the harvest to the German authorities. Incidentally, medium-sized businesses were taken over by ethnic Germans and the Polish owners were deported to the Generalgouvernement. In 1942 the Wartheland alone, with three million tons of grain, provided 13% of the total German demand and 30% of the sugar demand.
Economy in the General Government
In the Generalgouvernement the expropriations were limited in comparison to the annexed areas. However, the German occupiers confiscated the property of the Polish state, the Jews and the Polish citizens who fled abroad. Overall, this made up about a third of the assets in the Generalgouvernement. High taxes were imposed on the population , the income of which covered the salaries of the Wehrmacht, SS, police and administration stationed in the Generalgouvernement. In addition, it was used to finance the road construction programs in preparation for the war against the Soviet Union in 1940 and 1941 .
The Generalgouvernement itself was not considered by Hitler to be of any great economic importance, despite the objections of the Office of Economic Affairs. It should only provide workers and otherwise be able to supply itself with the bare minimum. Therefore, in October 1939, they began to dismantle all existing industrial plants and machines and bring them to the German Reich. This caused mass unemployment and a shortage of goods. However, the dismantling also had negative consequences for the German armaments industry, so that from January 1940 the factory in the Generalgouvernement was repaired again and production was used directly to support the German war effort. In the period from September 1940 to June 1944, the number of companies in the Generalgouvernement which produced directly for the armaments industry rose from 186 to 404, which was largely due to the fact that some German companies followed suit because of the Allied bombing raids on the Reich Poland evaded. Their production rose in the same period from RM 12,550,000 to RM 86,084,000.
While the surplus areas in the affiliated provinces were already producing for the German Reich, the territory of the Generalgouvernement was an agricultural subsidy area. That is why ensuring self-sufficiency was the primary goal there. Attempts to achieve this through rational management were unsuccessful until 1942 and the yields even fell short of the prewar yields due to unfavorable weather conditions. In order to increase production, coercive and terrorist measures were used from 1942 to collect the income. In this way, and also through the systematic extermination of the Jewish population, there was a surge in agricultural exports. While only 55,000 tons of grain and 122,000 tons of potatoes were exported to the German Reich in 1940/41, this increased to 571,700 tons of grain and 387,000 tons of potatoes in 1943/44. In addition, the Generalgouvernement supplied about 500,000 soldiers of the Wehrmacht, 50,000 members of the police and SS, and about 400,000 Soviet prisoners of war .
People's Republic of Poland
In March 1963 Poland and the Federal Republic of Germany established trade missions in each other. After Poland's western border was secured with the Warsaw Treaty in December 1970 with the Federal Republic of Germany , the government believed that it could use the relief provided by the population to raise prices and increased the prices of consumer goods by 13 to 38 percent. There was a popular uprising . The external debt in 1970 was $ 1.2 billion. After the uprising, the government was initially reluctant to raise prices; on June 24, 1976 she had to raise prices drastically. She wanted to raise the prices for butter and cheese by 50%, for meat by 68% and for sugar by 100%. After strikes and demonstrations broke out again, the government said it was just a plan.
In 1980 the external debt was US $ 24.1 billion; a large part of the loans taken out had gone into consumer spending. On July 1, 1980 meat prices were increased again. In the ensuing riots, the Solidarność union was formed .
Transition from the planned economy to the market economy


In 1988 the first reforms began with the aim of transforming the Polish centrally planned economy into a market economy . In contrast to the other socialist countries, about 20 percent of the companies were in private hands as early as 1988. On January 1, 1989, a law made it easier to set up private companies and register commercial activities. In March 1989 the possibility was created to set up private exchange offices. On August 1, 1989, centralized pricing for food products was abandoned. At that time, these products were rarely offered in shops, but were mainly sold at weekly markets and bazaars.
In October 1989 the so-called Balcerowicz Plan was presented by Leszek Balcerowicz . The plan envisaged a rapid transformation of the socialist economic system into a market economy. A debt moratorium, which Balcerowicz managed to achieve, gave Poland the freedom it needed to implement reforms. On December 27, 1989, the Sejm passed ten economic laws that the government had presented ten days earlier. These laws, drawn up under the direction of Balcerowicz, are considered to be one of the most important cornerstones for economic reforms. Government revenues plummeted in 1990 and 1991 due to the general recession . The inflation was 1990 585 percent, but declined in 1991 already to 160.4 percent. Industrial production fell by 27 percent and real wages by 30 percent. The Warsaw Stock Exchange ( GPW ) was opened on April 16, 1991 . On January 1, 1995, as part of a currency reform, the zloty was revalued from 10,000 old to a new zloty (PLN).
With the transition to a market economy, the importance of mining also declined. Its previous importance as a source of foreign currency dwindled and the industry had to face the competition. In 1989, 404,000 people were employed in the mining industry, three years later there were only 350,000.
In 1989 5.1 million people were employed in agriculture, which in 1990 produced five percent of the gross domestic product. The number of people working in this branch fell to 2.9 million by 2002, which in 2004 only made up around three percent of the gross domestic product. However, a large proportion of those who work as farmers are only registered as such in order to benefit from subsidies; around a quarter also pursue other activities. As a result of the economic reforms, the proportion of farmers who only produced for self-sufficiency fell sharply.
Development since 1989
After 1989, many Germans were surprised that the prerequisites for the new capitalist system in Poland were already in place during the communist government. Again and again, hundreds of thousands of self-employed people had already acquired the tools for their later entrepreneurship before the system change. The GDR citizens did not enjoy these practical "management seminars". Even without massive help from the West , the economy of Poland recovered faster after the collapse of the communist system than the economy of East Germany, but also of other states of the former Eastern Bloc.
The long-lasting success of Poland's economy in comparison to other post-communist countries ensured that the term Polish economy became more and more a synonym and a stylistic variant of the term real Polish economy . However, in February 2015 a Polish city guide complained about German tourists in Warsaw : “Poland as a success story? Many just don't believe that. "
In the latest studies on the Polish economy, the positive judgment about this is put into perspective. In an article titled “How lost is Poland?” In the September 2016 issue of the business magazine Capital , Nils Kreimeier criticizes that the Polish government is pursuing an “anti-German and EU-hostile course” and thus “of all things on the two pillars that are driving the economic boom have fired ”, shook. The result: "The first indicators are already pointing downwards".
gross domestic product
The gross domestic product is distributed very differently from region to region. The richest regions are Mazovia (133% of the national average) and Lower Silesia (114%). The poorest regions are Lublin (68% of the national average), Subcarpathian (71%) and Świętokrzyskie (74%).
| year | 1996 | 1997 | 1998 | 1999 | 2000 | 2001 | 2002 | 2003 | 2004 | 2005 | 2006 | 2007 | 2008 | 2009 | 2010 | 2011 | 2012 | 2013 | 2014 | 2015 | 2016 | 2017 | 2018 |
|---|---|---|---|---|---|---|---|---|---|---|---|---|---|---|---|---|---|---|---|---|---|---|---|
| Growth rate | 6.1 | 6.5 | 4.6 | 4.6 | 4.6 | 1.2 | 2.0 | 3.6 | 5.1 | 3.5 | 6.2 | 7.0 | 4.2 | 2.8 | 3.6 | 5.0 | 1.6 | 1.4 | 3.3 | 3.8 | 3.1 | 4.8 | 5.1 |
Source: Eurostat
inflation
| year | 1950 | 1951 | 1952 | 1953 | 1954 | 1955 | 1956 | 1957 | 1958 | 1959 | 1960 | 1961 | 1962 | 1963 | 1964 | 1965 | 1966 | 1967 | 1968 | 1969 | 1970 | 1971 | 1972 | 1973 | 1974 | 1975 | 1976 | 1977 | 1978 | 1979 | 1980 | 1981 | 1982 | 1983 | 1984 | 1985 | 1986 | 1987 | 1988 | 1989 | 1990 | 1991 | 1992 | 1993 | 1994 | 1995 | 1996 | 1997 | 1998 | 1999 | 2000 | 2001 | 2002 | 2003 | 2004 | 2005 | 2006 | 2007 | 2008 | 2009 | 2010 | 2011 | 2012 | 2013 | 2014 | 2015 | 2016 | 2017 | 2018 |
|---|---|---|---|---|---|---|---|---|---|---|---|---|---|---|---|---|---|---|---|---|---|---|---|---|---|---|---|---|---|---|---|---|---|---|---|---|---|---|---|---|---|---|---|---|---|---|---|---|---|---|---|---|---|---|---|---|---|---|---|---|---|---|---|---|---|---|---|---|---|
| inflation rate | 7.5 | 9.6 | 14.4 | 41.9 | 6.3 | 2.4 | 1.0 | 5.4 | 2.7 | 1.1 | 1.8 | 0.7 | 2.5 | 0.8 | 1.2 | 0.9 | 1.2 | 1.5 | 1.6 | 1.4 | 1.1 | 0.1 | 0.0 | 2.8 | 7.1 | 3.0 | 4.4 | 4.9 | 8.1 | 7.0 | 9.4 | 21.2 | 100.8 | 22.1 | 15.0 | 15.1 | 17.7 | 25.2 | 60.2 | 251.1 | 585.8 | 70.3 | 43.0 | 35.3 | 32.2 | 27.8 | 19.9 | 14.9 | 11.8 | 7.3 | 10.1 | 5.5 | 1.9 | 0.8 | 3.5 | 2.1 | 1.0 | 2.5 | 4.2 | 3.5 | 2.6 | 4.3 | 3.7 | 0.9 | 0.0 | 0.9 | 0.6 | 2.0 | 1.6 |
Source: CIS
Public debt


According to the Polish statistician Teresa Malecka, in 1929 Poland was in debt with 34% of the national income. The main creditors were the USA, which in 1930 had a share of 38.2% of the total debt. The US share of government debt in 1930 was 69 percent and that of local government was 82.8 percent. Malecka draws the conclusion that "against all appearances" the role of American capital in Poland could not have been negative, since the indebtedness was not very high and, in her opinion, it is not necessary to attribute political motives to American capital groups in their activities in Poland .
Poland's national debt ratio increased between 2008 and 2013 due to the financial crisis . While the national debt of 600.8 billion zlotys at the end of 2008 corresponded to a government debt ratio of 47.1%, the national debt ratio at the end of 2013, given the debt level of then 934.4 billion zloty, reached a value of 57.1%. In 2014, the debt ratio fell significantly because the state reformed pension funds. The government bonds owned by private pension funds were transferred to a state pension fund. This means that the government in Poland has more financial leeway again, since if the national debt ratio were above 55%, the constitution would require it to take serious measures to avoid a further increase. If a second limit of 60% was exceeded, the government would be forced to balance the budget without further delay.
| year | 1995 | 1996 | 1997 | 1998 | 1999 | 2000 | 2001 | 2002 | 2003 | 2004 | 2005 | 2006 | 2007 | 2008 | 2009 | 2010 | 2011 | 2012 | 2013 | 2014 | 2015 | 2016 | 2017 | 2018 |
|---|---|---|---|---|---|---|---|---|---|---|---|---|---|---|---|---|---|---|---|---|---|---|---|---|
| Budget balance | 4.2 | 4.5 | 4.6 | 4.2 | 2.2 | 3.0 | 4.8 | 4.8 | 6.1 | 5.0 | 4.0 | 3.6 | 1.9 | 3.6 | 7.3 | 7.3 | 4.8 | 3.7 | 4.1 | 3.7 | 2.7 | 2.2 | 1.5 | 0.4 |
Source: Eurostat
labour market

In 1990 official unemployment was 6.1 percent (1.13 million people); In 1991 it was 11.4 percent. The highest unemployment rate in the Third Polish Republic was reached in 2002/2003 at 20.0 percent (around 3.2 million people). In June 2008 the rate was 9.6 percent, which equates to around 1.5 million people of working age. Unemployment in Poland is distributed very differently from region to region. In the cities of Poznan and Warsaw, unemployment is below 3%, in the rural areas of Masuria it is over 20%. In 1990 80% of the registered unemployed received unemployment benefits, in November 2006 it was 13.2%.
In the second quarter of 2007, 15% of the workforce was employed in agriculture, 30.6% in industry and 54.2% in the service sector. In 2004, 30% worked in the public sector and 70% in the private sector.
Foreign trade
.jpg)
The export totaled 199.4 billion USD in 2015 and the import 195.2 billion USD. With 27.1 and 22.9%, Germany was the largest trading partner. The most important export countries were also Great Britain (6.8%), the Czech Republic (6.6%) and France (5.6%). Besides Germany, the largest import volume came from China (11.6%), Russia (7.4%) and Italy (5.3%).
| 2003 | 2004 | 2005 | 2006 | 2007 | 2008 | 2009 | 2010 | 2011 | 2012 | 2013 | 2014 | 2015 | 2016 | 2017 | |
|---|---|---|---|---|---|---|---|---|---|---|---|---|---|---|---|
| import | 67,886 | 88,156 | 101,539 | 125,645 | 164.172 | 210.479 | 149,570 | 178.063 | 212,331 | 198.463 | 208.780 | 225,898 | 197,682 | 198.421 | 227,774 |
| export | 53,450 | 73,781 | 89,378 | 109,584 | 138,785 | 171,860 | 136,641 | 159,758 | 190.247 | 184,661 | 206.138 | 222,339 | 200,343 | 203.725 | 228.182 |
| balance | -14,435 | -14,375 | -12,161 | -16,061 | -25,387 | -38,619 | -12,929 | -18,305 | -22,083 | -13,803 | -2,642 | -3,559 | 2,661 | 5,304 | 408 |
Source:
Foreign direct investment
In terms of foreign direct investment, France and the UK led the way. The Federal Republic's share was smaller. Foreign investors primarily invested in the financial sector. At the end of 2004, the largest Polish bank, PKO BP, was privatized. The merger of Bank Pekao SA and Bank BPH as part of the takeover of HVB by Unicredit resulted in one of the largest banks in Poland.
Economic structure
Agriculture and mining
Agriculture
The primary sector was the main economic branch in the aristocratic republic until the 19th century, which was considered the breadbasket of Europe until the partitions of Poland . The agricultural products from the huge magnate estates of Lesser Poland and the Ukraine with their black earth and loess soils were shipped to Western Europe via the Vistula and Gdansk .
In the People's Republic of Poland , less than ten percent of the arable area was collectivized in the agricultural cooperatives. This was a very small proportion compared to the other socialist states. After the political change in 1989 and the introduction of the market economy, these companies were unable to cope with the competition and were quickly closed. The privately run farms also had to fight for their survival and the farmers are seen as losers in the transformation process.
In 2004 the agricultural sector consisted of 2.2 million farms which made up 4% of the gross domestic product. Nevertheless, in 2007, 14.7% of the workforce was still employed in this sector. In 2004, EU subsidies per hectare were only 25% of what their colleagues in the old "EU of 15" received. This proportion increased gradually to 100 percent by 2013. The export of agricultural products to the European Union rose from 2.6 billion euros in 2003 to over 8.5 billion euros in 2008. Exports to other countries also rose.
In 2008 Poland was the largest apple producer in the European Union and the second largest rye producer. Grain production rose in 2004 by 26.7% to 29.6 million tons (in 2000 it was 22.3 million tons), which was mainly due to good weather conditions. The total plant production increased by 17% and the agricultural and food exports increased in 2004 compared to 2003 by 30% to 4.9 billion euros. 3.5 billion of this went to the EU. Many Polish smallholders faced competition from the large industrialized farms in Western Europe by specializing in organic products, which Poland is now the EU leader in producing. According to a study by the Rheinische Friedrich-Wilhelms-Universität Bonn, the “organic cultivation area” was expanded from 82,730 ha (2004) to 521,970 ha (2010) within six years. This corresponds to an increase of +531%. Almost half of the agricultural production is for personal use and is not sold, 80 percent of the farms are small and very small. Leading Polish agricultural processing companies listed on the stock exchange are Wawel , Colian , Żywiec and Indykpol .
Mining

Poland has long been a mining country with tradition thanks to the areas of Silesia. So it is not surprising that the largest publicly traded corporations are mining companies.
The leading listed mining companies / processing companies are PKN Orlen (with over 500 petrol stations (Orlen and Star petrol stations) in Germany) and LOTOS (both petroleum processing and petrol station operators ) as well as KGHM (copper / silver mining and processing), Kęty (aluminum mining and - processing).
Of the countries in Europe (excluding the Russian Federation ), Poland ranks first in terms of annual copper and silver production .
Industry
The industrial sector has played the leading role since the late 19th century. After 1989, however, he had to give it up to the service sector. Industrial production has shrunk considerably due to the closure of many large industrial plants in the 1990s. The existing production facilities have been modernized and are now successfully competing with producers from all over the world. In addition, numerous new, privately initiated industrial companies in niche sectors emerged. Investments in the secondary sector were particularly high in the 1990s, especially in the automotive and electrical industries; see Solaris , Melex , Orlen , Tauron, and Lotos . The agricultural machinery industry has specialized in inexpensive, smaller machines; see Pronar and Ursus . Polish manufacturers are also leaders in the segment of semi-trailers, trailers and bodies for trucks; see Wielton , Feber and Zasław . Many foreign companies have opened production facilities in Poland because of the relatively low costs (wages, ancillary wage costs and taxes) as well as the high supply of highly qualified workers and, not least, because of the large sales market with almost 40 million increasingly consumable consumers.
The ceramics manufacturer Cersanit and the pharmaceutical company Bioton should be mentioned as leading listed industrial companies . The clothing company LPP is also listed and growing rapidly. There are also a number of large former state-owned companies that were privatized (such as the mineral oil and natural gas company PGNiG ) or partially privatized (such as the mining company KGHM Polska Miedź ) through the IPO .
Services

The service sector has dominated Poland's economy since 1989 and accounts for well over half of GDP. It is the fastest growing area of the Polish economy. The largest service center is the financial metropolis and capital Warsaw , where most of the companies from the tertiary sector are based. But the trade fair city of Poznan and the southern Polish metropolises Krakow and Wroclaw are also important service locations . Last year, the former textile industry city of Łódź caught up with numerous investments in services to these cities. This is mainly thanks to the central location and the connection to the new motorway network (A1 from Gdansk to Cieszyn and A2 from Świecko to Terespol ).
Banking and financial services
The top 20 listed companies include the following banks: PKO Bank Polski , Bank Pekao SA , Bank BPH , Santander Bank Polska as well as the insurance company Powszechny Zakład Ubezpieczeń and the host company of the Warsaw Stock Exchange GPW SA.
Infrastructure and telecommunications
In 1989 around 25 percent of Poles had a telephone connection, in 2005 it was 78 percent. In 2004, 45 percent of the inhabitants of Poland had a mobile phone, in the European Union the spread was 80 percent. The only underground in Poland is the Warsaw Metro , which started operating in 1995. The top 20 stock market stocks also include the telecommunications companies Orange Polska and Netia , the IT company Asseco and the media groups Agora and TVN . The large service companies still to be privatized include the railway company Polskie Koleje Państwowe , the airline Polskie Linie Lotnicze LOT and the state post office Poczta Polska .
Biggest company
The headquarters , turnover and branch of the 20 largest Polish companies (excluding banks and insurance companies) are listed. The figures are given in million euros and refer to the 2018 financial year.
| rank |
Surname |
Headquarters |
Sales (€ million) |
Branch |
|---|---|---|---|---|
| 1. | PKN Orlen | Plock | 22,831.0 | oil and gas |
| 2. | Jeronimo Martins Polska | Kostrzyn | 11,531.0 | retail trade |
| 3. | Polskie Górnictwo Naftowe i Gazownictwo | Warsaw | 8,584.0 | oil and gas |
| 4th | Grupa LOTOS | Danzig | 5,790.0 | oil and gas |
| 5. | Eurocash SA | Komorniki | 5,571.0 | retail trade |
| 6th | PGE Polska Grupa Energetyczna | Warsaw | 5,530.0 | Supplier |
| 7th | KGHM Polska Miedź | Lubin | 4,874.0 | Mining |
| 8th. | Tauron Polska Energia | Katowice | 4,170.0 | Supplier |
| 9. | ArcelorMittal Poland | Katowice | 3,041.0 | steel |
| 10. | Volkswagen Poznań | Poses | 3,869.0 | Automobiles |
| 11. | Lidl Polska | Tarnowo Podgórne | 3,409.0 | retail trade |
| 12. | Volkswagen Polska | Poses | 3,149.0 | Automobiles |
| 13. | Tesco Polska | Krakow | 2,849.0 | retail trade |
| 14th | Enea SA | Poses | 2,739.0 | Supplier |
| 15th | Orange Polska | Warsaw | 2,725.0 | telecommunications |
| 16. | BP Polska | Krakow | 2,636.0 | oil and gas |
| 17th | Energa | Danzig | 2,522.0 | Supplier |
| 18th | Auchan Polska | Warsaw | 2,445.0 | retail trade |
| 19th | Kaufland Polska | Warsaw | 2,429.0 | retail trade |
| 20th | Cyfrowy Polsat | Poses | 2,353.0 | telecommunications |
Capital market

The development of the Polish capital market began in the Middle Ages due to the immigration of merchants from northern Italy and the Netherlands in the guilds of the large trading cities. The Polish word for stock exchange Giełda comes from Gilda , which in Central High Polish corresponded to the Middle High German guild . Stock exchange trading in bills of exchange and other promissory notes originated around 1300. In the Polish-Lithuanian aristocratic republic , merchants received certain trading privileges for stock exchange trading, which can be seen as the first stock exchange regulations . Stock exchanges existed in Gdansk ( Artushof ), Krakow, Poznan, Zamość and Warsaw. Since the 18th century z. B. the Warsaw merchants recorded their twice a week exchange meetings. The first Polish joint-stock companies also date from this period , the oldest surviving Polish share being that of Kompania Manufaktur Wełnianych w Warszawie from 1768. The first modern Polish stock exchanges were founded in Warsaw and Krakow in 1817 and 1818. The objects of trade were bonds and shares. In the Second Republic there were already seven stock exchanges in Warsaw, Krakow, Poznan, Łódź , Katowice , Lemberg and Vilnius . With the start of World War II , all of them were shut down by the Germans and the Soviets. Only after 50 years did the Polish capital market emerge again in 1989. In 1991 the Warsaw Stock Exchange was rebuilt. In 1996, the CeTO ( Centralna Tabela Ofert ) trading platform was added as a regulated non- exchange market, which is also based in Warsaw.
The Warsaw Stock Exchange is the largest exchange in Central Eastern Europe and one of the fastest growing in the world. In 2005 it overtook the Vienna Stock Exchange in terms of market capitalization. The capitalization of the Warsaw Stock Exchange is almost USD 300 billion. In 2004, almost 40 initial public offerings (IPOs) took place on the stock exchange , which placed it in second place in Europe after the London Stock Exchange, with the PKO BP IPO being one of the five largest in Europe in 2004 with almost USD 2 billion. Foreign issuers and several foreign brokerage houses have also been members of the stock exchange since 2004. B. MOL , Credit Austria , SkyEurope , Raiffeisenbank etc. The total number of listed companies is almost 300.
The investor audience is divided into three roughly equal parts: Polish private investors, Polish institutional investors and foreign institutional investors (76% of these are from Great Britain, 5% from the USA, 3% from Italy, 2% from Germany and 1% from France ). The share of Polish institutional investors is growing fastest, as a third of the pension contributions of Polish employees enter the capital market through pension funds. After the global bear market in the years 2000–2002, GPW had been in a bull phase since 2003 . In recent months, new all-time highs for the WIG ( Warszawski Indeks Giełdowy - main index) and the WIG 20 (index of the 20 large golden shares ) have been reached. Further indices of the stock exchange are the MIDWIG (medium-sized AGs), WIRR (small AGs), TechWIG (technical AGs), WIG-PL (large and medium-sized AGs based in Poland), NIF (investment funds) and the industry indices WIG-Banken, WIG -Construction, TIG-IT, TIG-Medien, TIG-Food and TIG-Telecommunication.
capital
According to a study by Bank Credit Suisse from 2017, Poland ranked 31st worldwide in terms of total national assets . Total real estate, stocks, and cash holdings totaled $ 859 billion. The wealth per adult person is $ 28,057 on average and $ 10,302 in median (in Germany: $ 203,946 and $ 47,091). In terms of wealth per inhabitant, Poland is one of the top countries, but is still well behind the countries of Western Europe. Since the country joined the EU, private wealth in Poland has risen sharply. In 2017 it grew by 18%.
In total, 47.5% of the total wealth of Poles was financial wealth and 52.5% was non-financial wealth. The Gini coefficient for wealth distribution was 71.7 in 2017, which indicates a relatively moderate wealth inequality. The top 10% of the Polish population owned 65% of the property and the top 1% owned 39.2% of the property. The proportion of Poles with wealth over $ 1 million is estimated at 0.2% of the population, while 48.7% owned less than $ 10,000. According to Forbes , there were 4 billionaires in Poland (as of August 2018).
tourism

Tourism in Poland is on the upswing, partly due to the opening of Polish airspace to low-cost airlines and the gradual expansion of the motorway network, and partly to the rediscovery of Poland by tourists from all over the world. The low prices in Poland compared to other European countries are likely to play an important role. For tourists the cities on the one hand and the untouched nature on the other hand are very attractive. The former royal city of Krakow is often considered the most beautiful city in Poland, it was visited by around 12 million tourists in 2005. The cultural offerings in the Polish metropolises are varied and affordable even for the less well-off visitor. The pub culture and nightlife are particularly attractive for young guests in the large student cities of Krakow, Warsaw , Wroclaw and Poznan . There are a total of 13 UNESCO World Heritage Sites in Poland. Medical tourism ( dental technology , cosmetic surgery ) has also increased significantly.
Many cities that were destroyed in World War II were rebuilt in exemplary fashion by the Polish restorers. These include above all Warsaw, Poznan, Wroclaw and Gdansk .
Recreation areas and health resorts can be found in the south and north of Poland, in the Voivodeships of Warmia-Masuria , West Pomerania , Pomerania , Kuyavian-Pomerania , Lesser Poland , Subcarpathian and Lower Silesia . You can do water sports on the Baltic Sea , the lake districts and some mountain rivers, v. a. Dunajec , San , Poprad , Bobr and their reservoirs operate. The mountain regions Tatry , Beskydy , Kraków-Czestochowa Jura , Świętokrzyskie Mountains , Sudetes with the Giant Mountains in the first place invite you to go on a skiing and hiking holiday. Zakopane is the winter sports capital of Poland . Many attractive natural treasures are protected in 23 national parks.

See also
Web links
- Small Statistical Yearbook Poland 2010 ( Memento from November 15, 2010 in the Internet Archive ) (Polish, English)
- Polish Information and Foreign Investment Agency (German)
- OECD Economic Survey of Poland (English)
- CIA World Factbook: Poland (English)
Individual evidence
- ^ A b International Monetary Fund, World Economic Outlook Database, April 2016: Nominal GDP list of countries. Data for the year 2015. In: International Monetary Fund. Retrieved May 14, 2016 .
- ↑ Exchange rates of the Polish zloty.Retrieved April 16, 2011
- ↑ MFW - "World Economic Outlook Database, April 2018" (By Countries). In: International Monetary Fund. Retrieved May 14, 2016 .
- ^ World Economic Outlook Database, April 2018. In: International Monetary Fund. Retrieved May 14, 2016 .
- ↑ Eurostat - Gross Value Added in Agriculture.Retrieved April 16, 2011
- ↑ Eurostat - Gross Value Added Industry Accessed April 16, 2011
- ↑ Eurostat - Gross Value Added Services Accessed on April 16, 2011
- ↑ a b GDP and main components (output, expenditure and income). Eurostat, accessed on 31 January 2017 .
- ↑ a b Roczne wskaźniki cen towarów i usług Konsumpcyjnych od 1950 roku. In: gov.pl. Retrieved July 17, 2019 (Polish).
- ^ A b Central Statistical Office - Employment in national economy in 2009.Retrieved on April 16, 2011
- ^ Central Statistical Office - Unemployment.Retrieved April 16, 2011
- ↑ Stopa bezrobocia w latach 1990–2016. In: CIS. Retrieved September 30, 2016 (Polish).
- ↑ European Union: Unemployment rates in the member states in August 2016. In: Statista . Retrieved September 30, 2016 .
- ↑ a b c d e Central Statistical Office - Yearbook of foreign trade statistics 2010.Retrieved April 16, 2011
- ↑ Eurostat - Government debt. Accessed 16 April 2011
- ↑ Eurostat - Government Revenue.Retrieved April 16, 2011
- ↑ Eurostat - total expenditure. Accessed April 16, 2011
- ↑ Eurostat - Government deficit.Retrieved April 16, 2011
- ↑ Quoting from Hans-Erich Volkmann: Economy and Expansion - Basic Features of Nazi Economic Policy , Munich 2003, p. 222.
- ^ Quote from Robert Seidel: German Occupation Policy in Poland - The Radom District 1939–1945. Paderborn / Munich / Vienna / Zurich 2006, p. 89.
- ↑ Bogdan Musial: The battlefield of two totalitarian regimes , in: Klaus-Michael Mallmann, Bogdan Musial (ed.): Genesis des Genozids - Poland 1939–1941. Darmstadt 2004, p. 18.
- ↑ Ordinance on the Treatment of Property of Members of the Former Polish State, accessed on September 16, 2014.
- ↑ "Hero in the Twilight". In: Spiegel. October 4, 2005, accessed September 16, 2014 .
- ↑ Wolfgang Bleyer, Elisabeth Brachmann-Teubner, Gerhart Hass , Helma Kaden, Manfred Kuhnt, Norbert Müller, Ludwig Nestler, Fritz Petrick, Werner Röhr , Wolfgang Schumann, Martin Seckendorf (ed. College under the direction of Wolfgang Schumann ): Night over Europe : the occupation policy of German fascism (1938–1945). Eight-volume document edition, Vol. 2, The Fascist Occupation Policy in Poland (1939–1945). Cologne 1989, ISBN 3-7609-1260-5 , p. 23.
- ↑ Hans-Jürgen Bömelburg: The German occupation policy in Poland 1939-1945 , in: Bernhard Chiari (Ed.): The Polish Home Army - History and Myth of the Armia Krajowa since the Second World War , Munich 2003, p. 70.
- ↑ Bogdan Musial: The battlefield of two totalitarian regimes , in: Klaus-Michael Mallmann, Bogdan Musial (ed.): Genesis des Genozids - Poland 1939–1941 , Darmstadt 2004, p. 18 f.
- ↑ Hans-Jürgen Bömelburg: The German occupation policy in Poland 1939-1945 , in: Bernhard Chiari (ed.): The Polish Home Army - History and Myth of the Armia Krajowa since the Second World War. Munich 2003, p. 69.
- ↑ Bogdan Musial: The battlefield of two totalitarian regimes , in: Klaus-Michael Mallmann, Bogdan Musial (ed.): Genesis des Genozids - Poland 1939–1941. Darmstadt 2004, p. 20.
- ↑ Bogdan Musial: The battlefield of two totalitarian regimes , in: Klaus-Michael Mallmann, Bogdan Musial (ed.): Genesis des Genozids - Poland 1939–1941. Darmstadt 2004, p. 21.
- ↑ a b Manfred Alexander, Kleine Geschichte Polens , Stuttgart 2008, pp. 343–344. ISBN 978-3-15-017060-1
- ↑ a b Manfred Alexander, Kleine Geschichte Polens , Stuttgart 2008, p. 350. ISBN 978-3-15-017060-1
- ↑ Manfred Alexander, Kleine Geschichte Polens , Stuttgart 2008, p. 348. ISBN 978-3-15-017060-1
- ^ Andrzej Chwalba: Brief history of the Third Polish Republic. Wiesbaden 2010, p. 79
- ^ Andrzej Chwalba: Brief history of the Third Polish Republic. Wiesbaden 2010, p. 72
- ^ Andrzej Chwalba: Brief history of the Third Polish Republic. Wiesbaden 2010, p. 76
- ↑ Brigitte Jäger-Dabek, Poland - A neighborhood customer. Bonn 2006, ISBN 3-89331-747-3 , p. 147
- ^ Andrzej Chwalba: Brief history of the Third Polish Republic. Wiesbaden 2010, pp. 73-74
- ^ Andrzej Chwalba: Brief history of the Third Polish Republic. Wiesbaden 2010, p. 96
- ^ Andrzej Chwalba: Brief history of the Third Polish Republic Wiesbaden 2010, p. 99
- ↑ Klaus-Peter Schmid: Quick, quick, money! . The time . June 13, 2001
- ^ Berthold Merkle: Because of "Polish economy" - post-turnaround balance sheet . rp-online . March 11, 2015
- ↑ Poland's development is like a miracle . The world . October 16, 2011
- ↑ Ulrich Halasz: Big Blickpunkt-Reportage: Why Poland's Economy is Booming ( Memento from January 2, 2016 in the Internet Archive ). Focus on economy . February 26, 2015
- ↑ Nils Kreimeier: How lost is Poland? . In: Capital . September 2016, p. 67f.
- ^ Regiony Polski - Regions of Poland. (PDF; 2.7 MB) Główny Urząd Statystyczny, Warszawa 2009
- ↑ Teresa Malecka: American Capital in Poland in the interwar period . In: Harm G. Schröter, Clemens A. Wurm (eds.): Politics, economics and international relations, studies on their relationship in the period between the world wars . Mainz 1991. p. 79 ff.
- ↑ International Monetary Fund: World Economic Outlook Database, October 2014, General government gross debt (National currency, Percent of GDP)
- ↑ Neue Zürcher Zeitung: Dismantling the pension reform - Poland dismantles the second pillar September 11, 2013, accessed on March 5, 2015.
- ↑ Poland must step on the debt brake
- ^ Government revenues, expenditures and main aggregates. In: Eurostat . Retrieved January 31, 2017 .
- ↑ a b c d e Małgorzata Szylko-Skoczny, Ulrich Heiße (translator): Labor market situation and labor market policy. In: Dieter Bingen, Krzysztof Ruchniewicz (ed.): Country report Poland. Bonn 2009, ISBN 3-8933-906-0 , pp. 294-308.
- ↑ Aktuellności - Sytuacja na rynku pracy w czerwcu 2008 r. Ministerstwo Pracy i Polityki Społecznej, July 4th 2008
- ↑ Obroty handlu zagranicznego ogółem i według krajów w okresie styczeń - grudzień 2015 r. (PDF) In: GUS. Pp. 1–2 , accessed on May 13, 2016 (Polish).
- ↑ POLSKA 2015 RAPORT O STANIE HANDLU ZAGRANICZNEGO. (PDF) In: GUS. Ministerstwo Rozwoju, p. 31 , accessed on May 13, 2016 (Polish).
- ↑ Obroty handlu zagranicznego ogółem i według krajów w okresie styczeń - grudzień 2015 roku. In: CIS. Retrieved May 13, 2016 (Polish).
- ↑ Obroty towarowe handlu zagranicznego ogółem i według krajów w okresie styczeń grudzień 2016 roku. In: CIS. Retrieved March 20, 2017 (Polish).
- ↑ OCENA SYTUACJI W HANDLU ZAGRANICZNYM W 2017 ROKU. (PDF) In: mpit.gov.pl. P. 6 , accessed on April 4, 2018 (Polish).
- ↑ Mały Rocznik Statystyczny 2012 r. In: stat.gov.pl. Retrieved April 24, 2018 (Polish).
- ↑ Kolektywizacja rolnictwa . Encyclopedia PWN. Retrieved June 7, 2015.
- ↑ a b c d e f g Research Center Eastern Europe at the University of Bremen, Poland-Analyzes 51/09 , May 5, 2009 ( Memento from October 14, 2015 in the Internet Archive ) ()
- ↑ http://www.tagesschau.de/wirtschaft/bio-importe100.html ( Memento from May 9, 2013 in the Internet Archive )
- ^ Andrzej Chwalba: Brief history of the Third Polish Republic. Wiesbaden 2010, p. 104
- ↑ [1]
- ↑ Global Wealth Report 2017 . In: Credit Suisse . ( credit-suisse.com [accessed January 1, 2018]).
- ^ The World's Billionaires. Forbes, accessed August 22, 2018 .
Albania | Belgium | Bosnia and Herzegovina | Bulgaria | Denmark | Germany | Estonia | Finland | France | Greece | Ireland | Iceland | Italy | Kazakhstan | Croatia | Latvia | Liechtenstein | Lithuania | Luxembourg | Malta | Moldova | Montenegro | Netherlands | North Macedonia | Norway | Austria | Poland | Portugal | Romania | Russia | San Marino | Sweden | Switzerland | Serbia | Slovakia | Slovenia | Spain | Czech Republic | Turkey | Ukraine | Hungary | United Kingdom | Belarus | Cyprus
National economies in: Africa | Asia | Australia and Oceania | Europe | North America | South America