Morrow County (Ohio)
![Morrow County Courthouse in Mount Gilead, listed on the NRHP with No. 74001586 [1]](https://upload.wikimedia.org/wikipedia/commons/thumb/3/3f/Mount-gilead-ohio-courthouse.jpg/298px-Mount-gilead-ohio-courthouse.jpg) Morrow County Courthouse in Mount Gilead, listed on the NRHP as # 74001586 |
|
| administration | |
|---|---|
| US state : | Ohio |
| Administrative headquarters : | Mount Gilead |
| Address of the administrative headquarters: |
County Courthouse 80 N. Walnut Street Mount Gilead, OH 43338-0000 |
| Foundation : | February 24, 1848 |
| Made up from: |
Delaware County Knox County Marion County Richland County |
| Area code : | 001 419 |
| Demographics | |
| Residents : | 34,827 (2010) |
| Population density : | 33.1 inhabitants / km 2 |
| geography | |
| Total area : | 1055 km² |
| Water surface : | 3 km² |
| map | |
| Website : www.morrowcounty.info | |
Morrow County is a county in the state of Ohio in the United States . The county seat is Mount Gilead .
geography
The county is located north of the geographic center of Ohio and has an area of 1055 square kilometers, of which three square kilometers are water. It is bordered in a clockwise direction by the following counties: Crawford County , Richland County , Knox County , Delaware County, and Marion County .
history
Morrow County was formed on February 24, 1848 from parts of Delaware, Knox, Marion and Richland Counties. It was named after Jeremiah Morrow , Ohio's ninth governor and senator .
15 buildings and sites in the county are listed on the National Register of Historic Places (as of May 16, 2018).
Demographic data
| growth of population | |||
|---|---|---|---|
| Census | Residents | ± in% | |
| 1850 | 20,280 | - | |
| 1860 | 20,445 | 0.8% | |
| 1870 | 18,583 | -9.1% | |
| 1880 | 19,072 | 2.6% | |
| 1890 | 18,120 | -5% | |
| 1900 | 17,879 | -1.3% | |
| 1910 | 16,815 | -6% | |
| 1920 | 15,570 | -7.4% | |
| 1930 | 14,489 | -6.9% | |
| 1940 | 15,646 | 8th % | |
| 1950 | 17.168 | 9.7% | |
| 1960 | 19,405 | 13% | |
| 1970 | 21,348 | 10% | |
| 1980 | 26,480 | 24% | |
| 1990 | 27,749 | 4.8% | |
| 2000 | 31,628 | 14% | |
| 2010 | 34,827 | 10.1% | |
| Before 1900
1900–1990 2000 2010 |
|||
According to the 2000 census , Morrow County had 31,628 people in 11,499 households and 8,854 families. The population density was 30 people per square kilometer. The racial the population was composed of 98.37 percent white, 0.27 percent African American, 0.30 percent Native American, 0.15 percent Asian and 0.18 percent from other ethnic groups; 0.74 percent were descended from two or more races. Hispanic or Latino of any race was 0.58 percent of the population.
Of the 11,499 households, 35.6 percent had children and young people under the age of 18 living with them. 64.6 percent were married couples living together, 8.1 percent were single mothers, 23.0 percent were non-families, 19.0 percent were single households and 7.9 percent had people aged 65 years or over. The average household size was 2.72 and the average family size was 3.09.
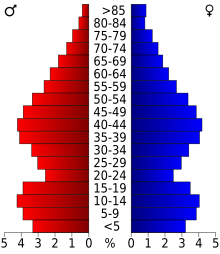
For the entire county, the population was composed of 27.3 percent of residents under the age of 18, 7.6 percent between 18 and 24 years of age, 29.3 percent between 25 and 44 years of age, and 24.3 percent between 45 and 64 years of age 11.5 percent were 65 years of age or over. The median age was 36 years. For every 100 females there were 99.4 males. For every 100 women aged 18 or over there were 98.0 men statistically.
The median income for a household in the 40,882 USD , and the median income for a family was 45,747 USD. Males had a median income of $ 33,129 versus $ 22,454 for females. The per capita income was $ 17,830. 6.6 percent of families and 9.0 percent of the population were below the poverty line. Of these, 12.4 percent were children or adolescents under 18 years of age and 7.1 percent were people over 65 years of age.
places
City
Villages
Townships
Unregulated areas
|
|
|
Individual evidence
- ^ Extract from the National Register of Historic Places . Retrieved March 13, 2011
- ^ Morrow County in the Geographic Names Information System of the United States Geological Survey . Retrieved February 22, 2011
- ↑ Charles Curry Aiken, Joseph Nathan Kane: The American Counties: Origins of County Names, Dates of Creation, Area, and Population Data, 1950-2010 . 6th edition. Scarecrow Press, Lanham 2013, ISBN 978-0-8108-8762-6 , p. 217 .
- ↑ Search mask database in the National Register Information System. National Park Service , accessed May 16, 2018.
- ^ US Census Bureau _ Census of Population and Housing . Retrieved February 17, 2011
- ↑ Extract from Census.gov . Retrieved February 21, 2011
- ↑ Excerpt from factfinder.census.gov.Retrieved February 21, 2011
- ↑ United States Census 2010 ( page no longer available , search in web archives ) Info: The link was automatically marked as defective. Please check the link according to the instructions and then remove this notice. Retrieved September 4, 2016
- ^ Morrow County, Ohio , 2000 census data sheet at factfinder.census.gov .
Web links
Coordinates: 40 ° 32 ' N , 82 ° 48' W


