
United States Demographics

The United States of America is currently the third most populous country in the world with an estimated population of 328,285,992 (as of January 12, 2019). It is a heavily urbanized country, with 82.3% of the population living in cities and suburbs. The country's major population centers span the eastern half of the United States (specifically the Great Lakes region, northeast, east, and southeast) and the western Pacific states. The mountainous regions, mainly the Rocky Mountains and Appalachian Mountains , deserts in the southwest, the dense forest areas in the far north, the central Prairie States and Alaska are less densely populated. The most populous states today are California and Texas as the density center of the US population has shifted further west and south throughout the history of the country. New York City is currently the most populous city in the United States and forms the largest agglomeration .
The CIA World Factbook shows a population growth of 0.8% for the twelve month period ending in July 2018. Which is high compared to the other industrialized countries , but below the global average rate of 1.1%. In the United States, the 2017 pooled fertility rate is estimated at 1.77 children per woman, which is below the replacement fertility rate of around 2.1.
The American population nearly quadrupled in the 20th century from 76 million in 1900 to 281 million in 2000. It exceeded the 200 million mark in 1967 and the 300 million mark in 2006. Population growth is among the minorities (people who are not part of the white population) overall fastest, and according to estimates by the Census Bureau for 2012, 50.4% of newborns belonged to minorities.
The majority of the US population is made up of white Americans . In 2017 this was around 234,370,202 or 73% of the population. Non-Hispanic whites (whites of no descent from Spain or Latin America ) make up 61.5% of the country's population. The U.S. non-Hispanic white population is projected to drop below 50% by 2045. The Hispanic population is responsible for nearly half of the population growth due to immigration and excess birth rates . Immigrants and their US-born descendants are expected to be the source of most of the US population growth in the coming decades.
The US Census Bureau forecasts a US population of 417 million by 2060, an increase of 38% from 2007 (301.3 million), and the United Nations estimates that the US population will be 402 million in 2050, an increase of 32% compared to 2007.
A US census is made every ten years and is required by the constitution. The next census is scheduled for 2020.
Demographic history
| Population development | |||
|---|---|---|---|
| Census | Residents | ± in% | |
| 1790 | 3,929,214 | - | |
| 1800 | 5,308,483 | 35.1% | |
| 1810 | 7,239,881 | 36.4% | |
| 1820 | 9,638,453 | 33.1% | |
| 1830 | 12,866,020 | 33.5% | |
| 1840 | 17,069,453 | 32.7% | |
| 1850 | 23,191,876 | 35.9% | |
| 1860 | 31,443,321 | 35.6% | |
| 1870 | 38,558,371 | 22.6% | |
| 1880 | 50.189.209 | 30.2% | |
| 1890 | 62,979,766 | 25.5% | |
| 1900 | 76.212.168 | 21% | |
| 1910 | 92.228.496 | 21% | |
| 1920 | 106.021.537 | 15% | |
| 1930 | 123.202.624 | 16.2% | |
| 1940 | 132.164.569 | 7.3% | |
| 1950 | 151.325.798 | 14.5% | |
| 1960 | 179.323.175 | 18.5% | |
| 1970 | 203.211.926 | 13.3% | |
| 1980 | 226.545.805 | 11.5% | |
| 1990 | 248,709,873 | 9.8% | |
| 2000 | 281.421.906 | 13.2% | |
| 2010 | 308,745,538 | 9.7% | |
| Before 1900
1900-1990 2000 |
|||
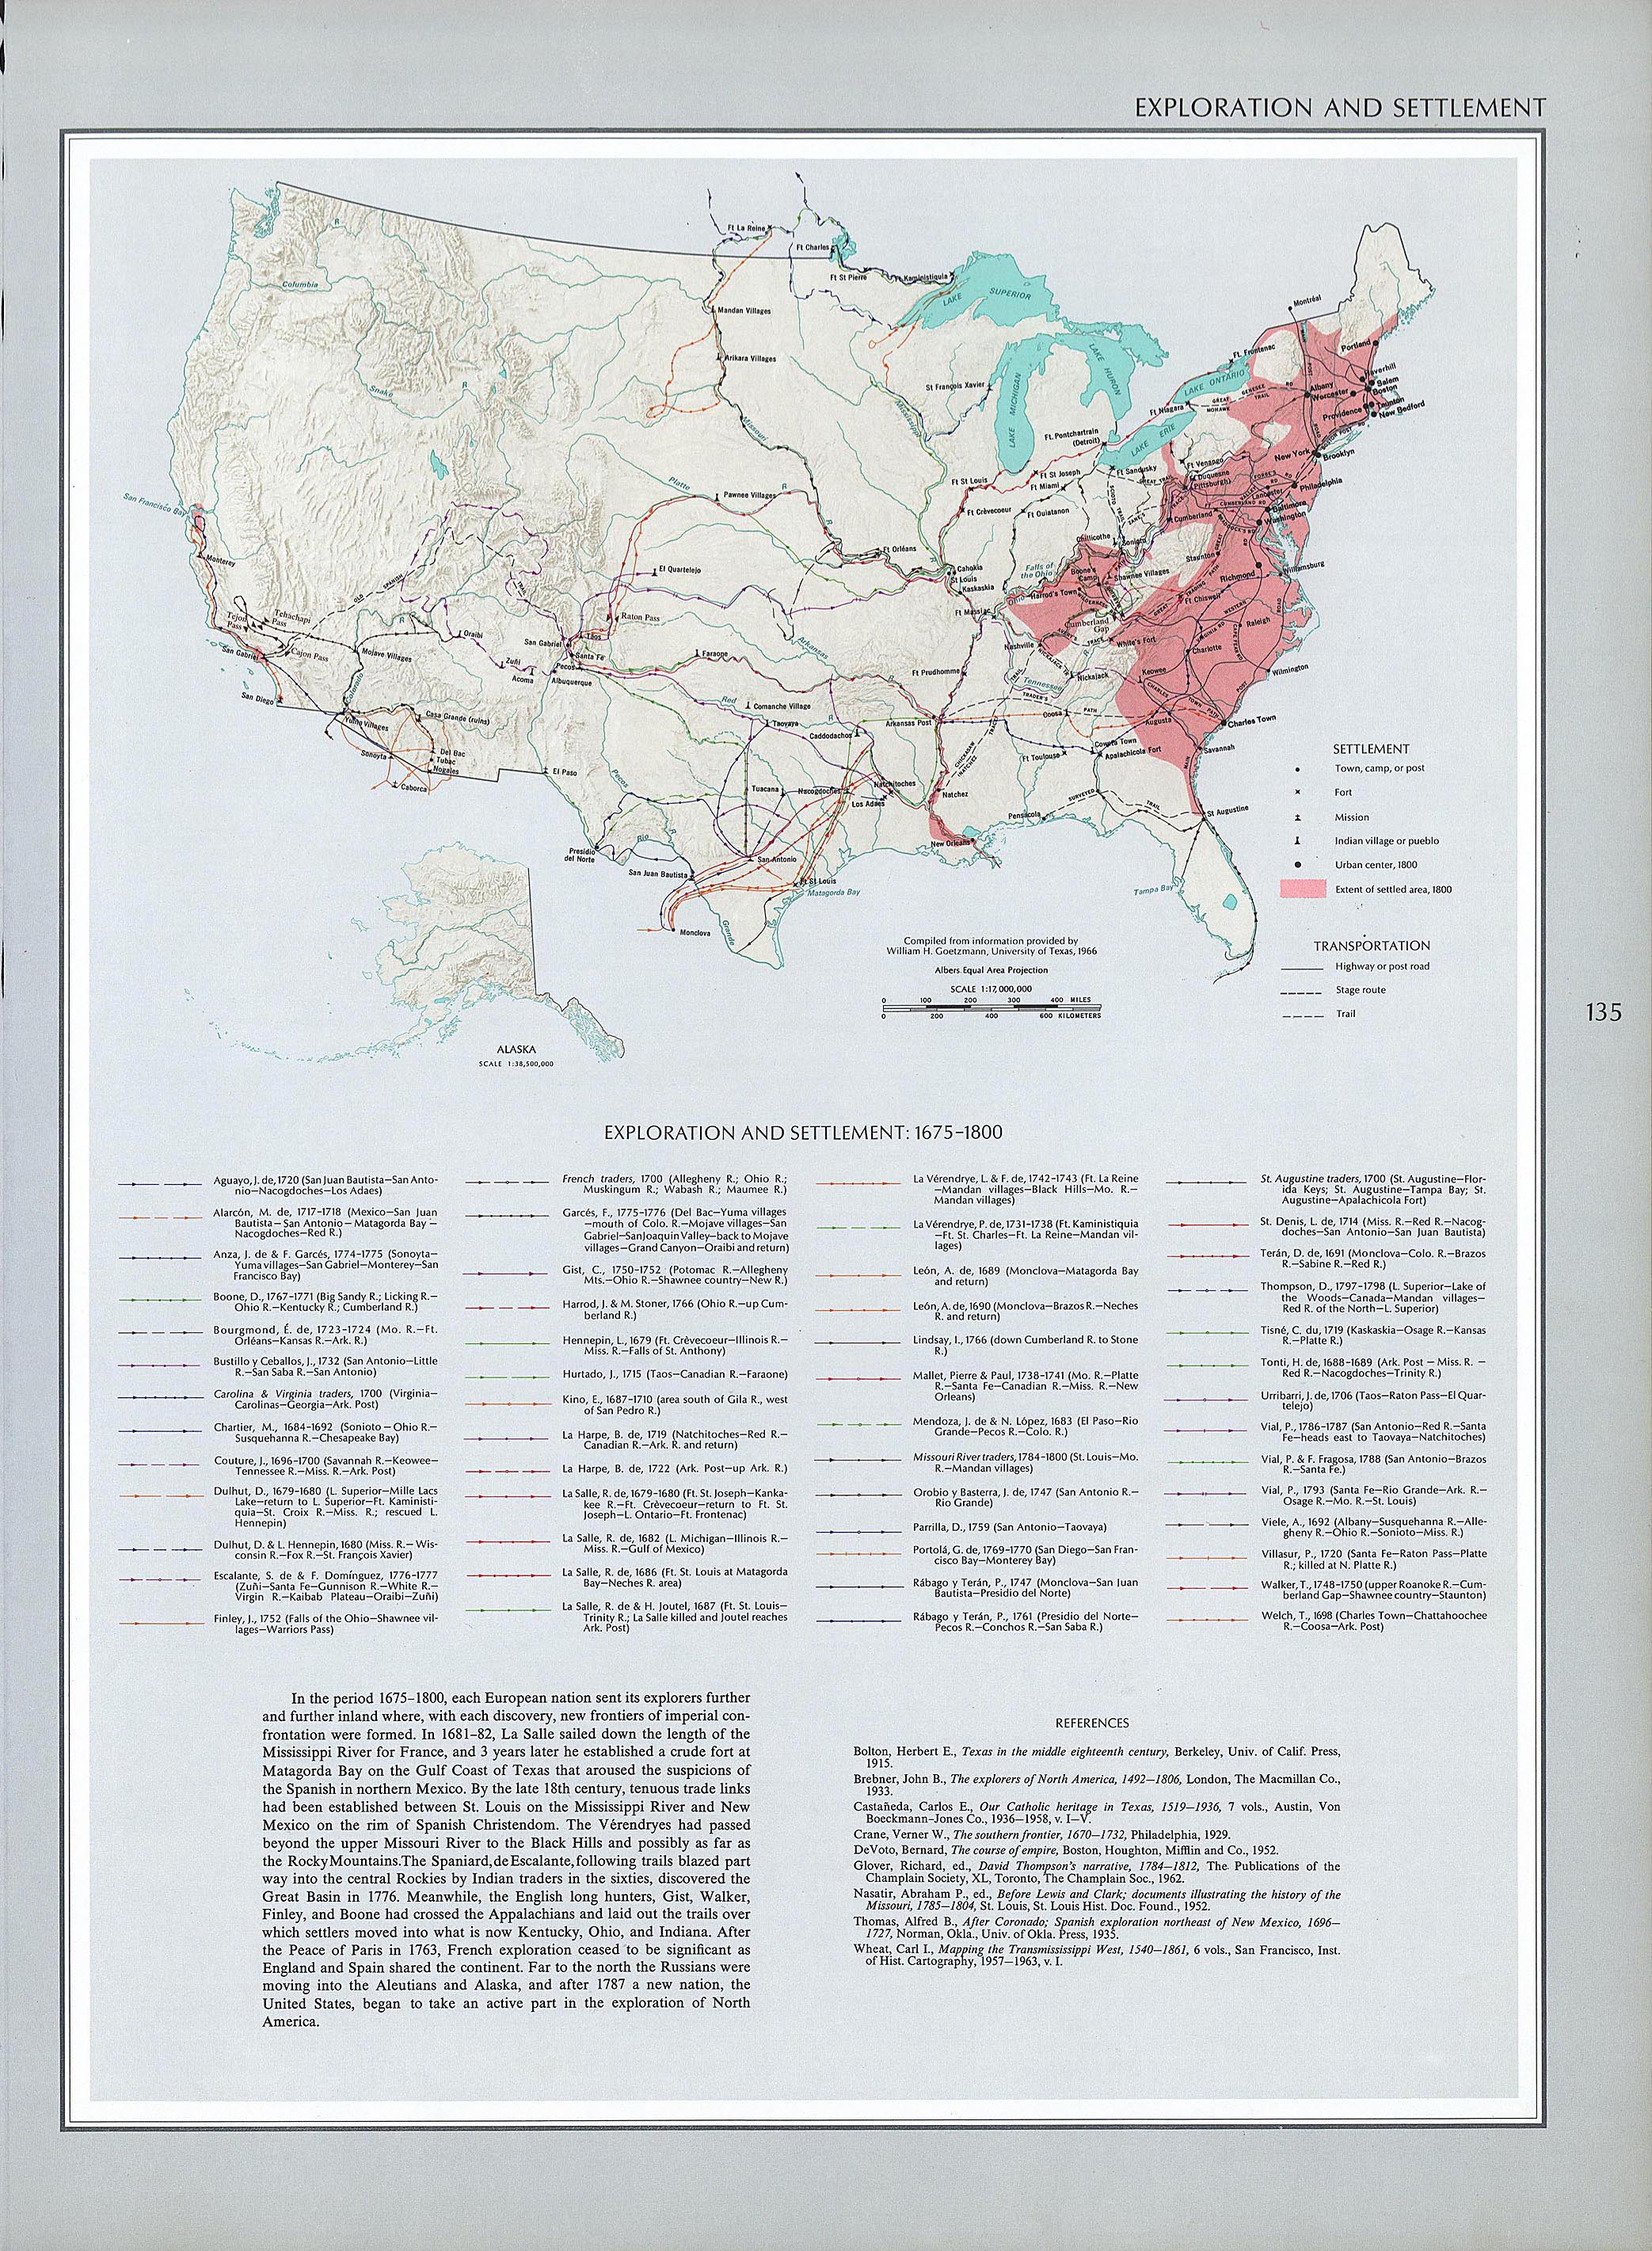
Before the first settler colonies were established, the United States was populated by various Indian tribes that did not form any ethnic, cultural, or linguistic unit. The pre-colonial population of today's American territory can only be estimated as there are no verifiable population figures. European colonization of America began in 1620 with the crossing of the Mayflower . The first settlers were mostly religious refugees ( Puritans ) who came from the British Isles . Over time, the number of settlers from other European nations increased, which was mainly due to the large free and agriculturally usable settlement areas in America, with a simultaneously rapidly growing European population, which made a crossing seem attractive. If the areas of today's New England (northeast) were developed first, the settlement areas then began to expand further to the west and south. This demographic expansion came at the expense of the original indigenous population.
From 1620 to 1700, the number of settlers and slaves in the settler colonies rose from 500 to 250,900. By 1760 it rose further to 1.6 million. In the same year the three largest colonies were Virginia (339,700 Ew.), Massachusetts (202,600) and Pennsylvania (183,700). The settler population had a very high birth rate with a low mortality rate for the time . From the second half of the 17th century, slaves were abducted en masse from the west coast of Africa to work on the plantations of the newly formed southern states . The black population in 1760 had 2.8% of the population in the northeast, 6.8% in the central states and 39.7% in the southern states.
In the first American census of 1790, which showed a population of 3.9 million people (excluding Native American Indians), 2.1 million people gave English, 757,000 African (most of whom lived in slavery), 300,000 Scottish-Irish, 270,000 German, 150,000 Scottish and 100,000 Dutch ancestry. As early as 1790, the question of ancestry became irrelevant for many, as mixed marriages of different ethnic groups became more common and people formed a common American identity. The total white population in 1790 was 80% British and would approximately double every 25 years through natural growth. From about 1675 onwards, the proportion of the population born in the United States would never fall below 80% of the total population.
The population continued to grow rapidly in the 19th century. The source states of migration, however, increasingly became the European countries outside the British Isles. A large number of Germans migrated after the failed revolution of 1848 and many Irish during the famine from 1845 to 1852 . Other areas with increasing immigration to the USA were Italy , Eastern Europe and Scandinavia . For the first time there was also significant migration from non-European areas, especially from Latin America and China . The resulting change in population structure, however, aroused the discontent of the Anglo-American population and anti-immigrant forces began to gain influence in the second half of the 19th century. With the Chinese Exclusion Act of 1882, immigration from China was blocked and immigration from other areas outside of Europe was severely restricted.
Texas and California joined the United States in 1845 and 1850, respectively, greatly expanding state territory. During this time the west of the country was opened up and settled (time of the Wild West ).
The American Civil War from 1861 to 1865 brought the largest demographic catastrophe to date, with at least 600,000 deaths. At the same time, the end of the war brought the liberation of the black population group, which, however, remained separate from the white population. Because of the severe discrimination in the southern states, millions of African Americans migrated to the industrial cities of the north in the first half of the 20th century.
In 1900, when the US population was 76 million, there were 66.8 million whites in the United States, representing 88% of the total population, 8.8 million black Americans, about 90% of whom still lived in the southern states , and just over 500,000 Latinos. With the advancing industrialization of the country, the USA changed from a predominantly rural, agricultural society to today's urban and suburban civilization. The increasing proportion of Catholics, non-whites and Jews caused a xenophobic mood in parts of the population. Immigration was quoted and restricted by the Emergency Quota Act of 1921. The primary purpose of this quota was to curb immigration from southern and eastern Europe and at the same time to favor immigrants from northern and western Europe. Immigration law was only liberalized under John F. Kennedy through the Immigration and Naturalization Services Act of 1965 . The sharp rise in migration from Latin America and other parts of the world since then has shifted the demographic profile of the country significantly towards a higher proportion of migrants and ethnic minorities in the total population.
The 2010 census showed an increase in the population to 308.7 million people. In addition to the increasing ethnic diversity, an aging of the population can also be observed, as the birth rate has fallen since the end of the baby boom in the post-war period.
Demographic indicators
Births and Deaths since 1935
Annual statistics of births and deaths:
| Population mid-year | Births | Deaths | Natural change |
Birth rate (per 1,000 inhabitants) |
Death rate (per 1,000 inh.) |
Nat. Change (per 1,000 inhabitants) | Fertility per woman | |
|---|---|---|---|---|---|---|---|---|
| 1935 | 127,362,000 | 2,377,000 | 1,392,752 | 984.248 | 18.7 | 10.9 | 7.7 | 2.19 |
| 1936 | 128,181,000 | 2,355,000 | 1,479,228 | 875.772 | 18.4 | 11.5 | 6.8 | 2.15 |
| 1937 | 128,961,000 | 2,413,000 | 1,450,427 | 962.573 | 18.7 | 11.2 | 7.5 | 2.17 |
| 1938 | 129,969,000 | 2,496,000 | 1,381,391 | 1,114,609 | 19.2 | 10.6 | 8.6 | 2.22 |
| 1939 | 131,028,000 | 2,466,000 | 1,387,897 | 1,078,103 | 18.8 | 10.6 | 8.2 | 2.17 |
| 1940 | 132,165,000 | 2,559,000 | 1,417,269 | 1,142,000 | 19.4 | 10.8 | 8.6 | 2.301 |
| 1941 | 133,002,000 | 2,703,000 | 1,397,642 | 1,305,358 | 20.3 | 10.5 | 9.8 | 2,399 |
| 1942 | 134,464,000 | 2,989,000 | 1,385,187 | 1,603,813 | 22.2 | 10.3 | 11.9 | 2.628 |
| 1943 | 136,003,000 | 3,104,000 | 1,459,544 | 1,644,306 | 22.8 | 10.7 | 12.1 | 2.718 |
| 1944 | 138,083,000 | 2,939,000 | 1,411,338 | 1,644,456 | 21.2 | 10.2 | 11.0 | 2.568 |
| 1945 | 139,994,000 | 2,858,000 | 1,401,719 | 1,456,281 | 20.4 | 10.0 | 10.4 | 2.491 |
| 1946 | 140,008,000 | 3,411,000 | 1,395,617 | 2,015,383 | 24.1 | 10.0 | 14.1 | 2.943 |
| 1947 | 145,023,000 | 3,817,000 | 1,445,370 | 2,371,630 | 26.6 | 10.0 | 16.6 | 3.274 |
| 1948 | 148,013,000 | 3,637,000 | 1,444,337 | 2,192,663 | 24.9 | 9.8 | 15.1 | 3.109 |
| 1949 | 149,336,000 | 3,649,000 | 1,443,607 | 2,205,393 | 24.5 | 9.7 | 14.8 | 3.110 |
| 1950 | 151,861,000 | 3,632,000 | 1,452,454 | 2,180,000 | 24.1 | 9.6 | 14.5 | 3.091 |
| 1951 | 154,056,000 | 3,823,000 | 1,482,099 | 2,340,901 | 24.8 | 9.6 | 15.2 | 3.269 |
| 1952 | 156,431,000 | 3,913,000 | 1,496,838 | 2,416,162 | 25.0 | 9.6 | 15.4 | 3.358 |
| 1953 | 159,047,000 | 3,965,000 | 1,447,459 | 2,517,541 | 25.2 | 9.1 | 16.1 | 3.424 |
| 1954 | 161,948,000 | 4,078,000 | 1,481,091 | 2,596,909 | 24.8 | 9.3 | 15.5 | 3.543 |
| 1955 | 163,476,000 | 4,097,000 | 1,528,717 | 2,568,283 | 25.0 | 9.3 | 14.3 | 3,580 |
| 1956 | 166,578,000 | 4,218,000 | 1,564,476 | 2,653,524 | 25.1 | 9.3 | 15.8 | 3,689 |
| 1957 | 169,637,000 | 4,308,000 | 1,633,128 | 2,666,872 | 25.3 | 9.5 | 15.8 | 3.767 |
| 1958 | 172,668,000 | 4,255,000 | 1,647,886 | 2,607,114 | 24.4 | 9.5 | 14.9 | 3.701 |
| 1959 | 175,642,000 | 4,244,796 | 1,656,814 | 2,587,982 | 24.0 | 9.4 | 14.7 | 3,670 |
| 1960 | 179,979,000 | 4,257,850 | 1,711,982 | 2,545,868 | 23.7 | 9.5 | 14.1 | 3,654 |
| 1961 | 182,992,000 | 4,268,326 | 1,701,522 | 2,566,804 | 23.3 | 9.3 | 14.0 | 3,629 |
| 1962 | 185,771,000 | 4,167,362 | 1,756,720 | 2,410,642 | 22.4 | 9.5 | 12.9 | 3.474 |
| 1963 | 188,483,000 | 4,098,020 | 1,813,549 | 2,284,471 | 21.7 | 9.6 | 12.1 | 3.333 |
| 1964 | 191,141,000 | 4,027,490 | 1,798,051 | 2,229,439 | 21.1 | 9.4 | 11.7 | 3.208 |
| 1965 | 193,526,000 | 3,760,358 | 1,828,136 | 1,932,222 | 19.4 | 9.5 | 9.9 | 2.928 |
| 1966 | 195,576,000 | 3,606,274 | 1,863,149 | 1,743,125 | 18.4 | 9.5 | 8.9 | 2.736 |
| 1967 | 197,457,000 | 3,520,959 | 1,851,323 | 1,669,636 | 17.8 | 9.4 | 8.4 | 2.578 |
| 1968 | 199,399,000 | 3,501,564 | 1,930,082 | 1,571,482 | 17.6 | 9.7 | 7.9 | 2,477 |
| 1969 | 201,385,000 | 3,600,206 | 1,921,990 | 1,678,216 | 17.9 | 9.5 | 8.4 | 2,465 |
| 1970 | 203,984,000 | 3,731,386 | 1,921,031 | 1,810,355 | 18.4 | 9.4 | 9.0 | 2,480 |
| 1971 | 206,827,000 | 3,555,970 | 1,927,542 | 1,628,428 | 17.2 | 9.3 | 7.9 | 2.266 |
| 1972 | 209,284,000 | 3,258,411 | 1,963,944 | 1,294,467 | 15.6 | 9.4 | 6.2 | 2.010 |
| 1973 | 211,357,000 | 3,136,965 | 1,973,003 | 1,163,962 | 14.8 | 9.5 | 5.3 | 1,879 |
| 1974 | 213,342,000 | 3,159,958 | 1,934,388 | 1,225,570 | 14.8 | 9.1 | 5.7 | 1,835 |
| 1975 | 215,465,000 | 3,144,198 | 1,892,879 | 1,251,319 | 14.6 | 8.8 | 5.8 | 1,774 |
| 1976 | 217,563,000 | 3,167,788 | 1,909,440 | 1,258,348 | 14.6 | 8.8 | 5.8 | 1.738 |
| 1977 | 219,760,000 | 3,326,632 | 1,899,597 | 1,427,035 | 15.1 | 8.6 | 6.5 | 1,789 |
| 1978 | 222,095,000 | 3,333,279 | 1,927,788 | 1,405,491 | 15.0 | 8.7 | 6.3 | 1.760 |
| 1979 | 224,567,000 | 3,494,398 | 1,913,841 | 1,580,557 | 15.6 | 8.5 | 7.1 | 1.808 |
| 1980 | 227,225,000 | 3,612,258 | 1,989,841 | 1,622,417 | 15.9 | 8.8 | 7.1 | 1,839 |
| 1981 | 229,466,000 | 3,629,238 | 1,977,981 | 1,651,257 | 15.8 | 8.6 | 7.2 | 1,812 |
| 1982 | 231,664,000 | 3,680,537 | 1,974,797 | 1,705,740 | 15.9 | 8.5 | 7.4 | 1,827 |
| 1983 | 233,792,000 | 3,638,933 | 2,019,201 | 1,619,732 | 15.6 | 8.6 | 6.9 | 1,799 |
| 1984 | 235,825,000 | 3,669,141 | 2,039,369 | 1,629,772 | 15.6 | 8.6 | 6.9 | 1.806 |
| 1985 | 237,924,000 | 3,760,561 | 2,086,440 | 1,674,121 | 15.8 | 8.8 | 7.0 | 1,844 |
| 1986 | 240,133,000 | 3,756,547 | 2,105,361 | 1,651,186 | 15.6 | 8.8 | 6.9 | 1,837 |
| 1987 | 242,289,000 | 3,809,394 | 2,123,323 | 1,686,071 | 15.7 | 8.8 | 7.0 | 1,872 |
| 1988 | 244,499,000 | 3,909,510 | 2,167,999 | 1,741,511 | 16.0 | 8.9 | 7.1 | 1.934 |
| 1989 | 246,819,000 | 4,040,958 | 2,150,466 | 1,890,492 | 16.4 | 8.7 | 7.7 | 2.014 |
| 1990 | 249,623,000 | 4,158,212 | 2,148,463 | 2,009,749 | 16.7 | 8.6 | 8.1 | 2.081 |
| 1991 | 252,981,000 | 4,110,907 | 2,169,518 | 1,941,389 | 16.2 | 8.6 | 7.7 | 2.062 |
| 1992 | 256,514,000 | 4,065,014 | 2,175,613 | 1,889,401 | 15.8 | 8.5 | 7.4 | 2.046 |
| 1993 | 259,919,000 | 4,000,240 | 2,268,553 | 1,731,687 | 15.4 | 8.7 | 6.7 | 2.019 |
| 1994 | 263,126,000 | 3,952,767 | 2,278,994 | 1,673,773 | 15.0 | 8.7 | 6.4 | 2.001 |
| 1995 | 266,278,000 | 3,899,589 | 2,312,132 | 1,587,457 | 14.6 | 8.7 | 6.0 | 1,978 |
| 1996 | 269,394,000 | 3,891,494 | 2,314,690 | 1,576,804 | 14.4 | 8.6 | 5.9 | 1,976 |
| 1997 | 272,647,000 | 3,880,894 | 2,314,245 | 1,566,649 | 14.2 | 8.5 | 5.7 | 1,971 |
| 1998 | 275,854,000 | 3,941,553 | 2,337,256 | 1,604,297 | 14.3 | 8.5 | 5.8 | 1.999 |
| 1999 | 279,040,000 | 3,959,417 | 2,391,399 | 1,568,018 | 14.2 | 8.6 | 5.6 | 2.007 |
| 2000 | 282,172,000 | 4,058,814 | 2,403,351 | 1,655,463 | 14.4 | 8.5 | 5.9 | 2.056 |
| 2001 | 285,082,000 | 4,025,933 | 2,416,425 | 1,609,508 | 14.1 | 8.5 | 5.6 | 2.030 |
| 2002 | 287,804,000 | 4,021,726 | 2,443,387 | 1,578,339 | 14.0 | 8.5 | 5.5 | 2.020 |
| 2003 | 290,326,000 | 4,089,950 | 2,448,288 | 1,641,662 | 14.1 | 8.4 | 5.5 | 2.047 |
| 2004 | 293,046,000 | 4,112,052 | 2,397,615 | 1,714,437 | 14.0 | 8.2 | 5.9 | 2.051 |
| 2005 | 295,753,000 | 4,138,349 | 2,448,017 | 1,690,332 | 14.0 | 8.3 | 5.7 | 2.057 |
| 2006 | 298,593,000 | 4,265,555 | 2,426,264 | 1,839,291 | 14.3 | 8.1 | 6.2 | 2.108 |
| 2007 | 301,580,000 | 4,316,234 | 2,423,712 | 1,892,522 | 14.3 | 8.0 | 6.3 | 2.120 |
| 2008 | 304,375,000 | 4,247,694 | 2,471,984 | 1,775,710 | 14.0 | 8.1 | 5.9 | 2.072 |
| 2009 | 307,007,000 | 4,130,665 | 2,437,163 | 1,693,502 | 13.5 | 7.9 | 5.6 | 2.002 |
| 2010 | 309,330,000 | 3,999,386 | 2,468,435 | 1,530,951 | 13.0 | 8.0 | 5.0 | 1.931 |
| 2011 | 311,583,000 | 3,953,590 | 2,515,458 | 1,438,412 | 12.7 | 8.1 | 4.6 | 1,894 |
| 2012 | 313,874,000 | 3,952,841 | 2,543,279 | 1,409,562 | 12.6 | 8.1 | 4.5 | 1,880 |
| 2013 | 316,129,000 | 3,932,181 | 2,596,993 | 1,336,183 | 12.4 | 8.2 | 4.2 | 1.857 |
| 2014 | 319,113,000 | 3,988,076 | 2,626,418 | 1,361,658 | 12.5 | 8.2 | 4.3 | 1,862 |
| 2015 | 321,442,000 | 3,978,497 | 2,712,630 | 1,265,867 | 12.4 | 8.4 | 4.0 | 1,843 |
| 2016 | 323,100,000 | 3,945,875 | 2,744,248 | 1,201,627 | 12.2 | 8.5 | 3.7 | 1,820 |
| 2017 | 325,719,000 | 3,855,500 | 2,813,503 | 1,041,997 | 11.8 | 8.7 | 3.1 | 1.765 |
| 2018 | 327,167,000 | 3,788,235 | 2,840,000 | 953.200 | 11.6 | 8.7 | 2.9 | 1.728 |
Population centers

The United States is a highly urbanized country with three quarters of the population living in metropolitan areas. A high proportion of people living in planned suburbs is typical. The Atlantic and Pacific coasts have a special population concentration, while the center is only very sparsely populated. The states in the north-east of the country, which were opened up the earliest, have the highest population density. New York City has been the largest population center in the country since the late 18th century. The southern ( Florida , Georgia , Arizona , Texas) and the Pacific states (California, Oregon , Washington ) are currently showing the strongest growth , while the population in the Midwest and Northeast is growing only slowly or even decreasing.
The following table provides an overview of the 10 largest metropolitan regions in the country by number of inhabitants in 2017. The definition of metropolitan regions comes from the US Census Bureau. In 2016, a total of 51 metropolitan regions had more than one million inhabitants.
| rank | Metropolitan area | Including | Population 1990 |
Population 2000 |
Population 2010 |
Population 2017 |
|---|---|---|---|---|---|---|
| 1 | New York City | Newark , Jersey City | 17,430,704 | 18,945,888 | 19,566,471 | 20,320,876 |
| 2 | los Angeles | Long Beach , Anaheim | 11,273,720 | 12,365,597 | 12,828,961 | 13,353,907 |
| 3 | Chicago | Naperville , Elgin | 8,181,939 | 9,098,970 | 9,461,550 | 9,533,040 |
| 4th | Dallas | Fort Worth , Arlington | 4,018,778 | 5,204,627 | 6,426,241 | 7,332,544 |
| 5 | Houston | Sugar Land | 3,750,846 | 4,693,520 | 5,920,499 | 6,892,427 |
| 6th | Washington | Arlington , Alexandria | 4,156,672 | 4,837,674 | 5,636,416 | 6,229,866 |
| 7th | Miami | Fort Lauderdale | 4,056,228 | 5,007,956 | 5,566,298 | 6,158,824 |
| 8th | Philadelphia | Camden , Wilmington | 5,435,550 | 5,686,329 | 5,965,662 | 6.096.120 |
| 9 | Atlanta | Sandy Springs , Roswell | 3,081,858 | 4,263,135 | 5,286,725 | 5,884,736 |
| 10 | Boston | Cambridge , Newton | 4,133,895 | 4,392,533 | 4,552,595 | 4,836,531 |
Ethnic groups
The United States Census Bureau collects data on ethnic and racial classification in accordance with Office of Management and Budget (OMB) guidelines , this data is based on self-identification. In contrast to Germany, the word race is still used by official bodies in the USA. The breed classifications and definitions used by the US Census Bureau are:
- White Americans : A person who originated in one of the original peoples of Europe, the Middle East, or North Africa. This includes people who indicate their ethnicity as “white” or who report entries such as Irish, German, Italian, Lebanese, Arabic, Moroccan or Caucasian.
- Black or African American (black or African American ): A person who is originally from one of the states of sub-Saharan Africa comes from. This includes people who indicate their ethnicity as Black or Afro-American or who give details such as Kenyans, Nigerians or Haitians.
- American Indian or Alaska Native ( Native Americans ): A person who in any of the original peoples of North and South America (including Central America) originates and maintains tribal affiliation or community relationship. This category includes people who indicate their ethnic group as "Indians or Alaskan Indians" or who give details such as Navajo , Blackfeet, Inuit , Yup'ik , Central American Indian groups or South American Indian groups.
- Asian Americans ( Asian Americans ): A person who originated in one of the original peoples of East Asia , Southeast Asia or the Indian subcontinent has, including Cambodia , China , India , Japan , Korea , Malaysia , Pakistan , the Philippine Islands , Thailand and Vietnam .
- Native Hawaiian or Other Pacific Islander : A person who originated in one of the indigenous peoples of Hawaii, Guam, Samoa, or other Pacific islands.
- Some other race : Any other answer not included in the White, Black or African American, Native American, Asian, and Indigenous Hawaiian or other Pacific Islander race categories described above.
- Two or more races : Anyone who descends from two or more of the previous groups by either ticking two or more boxes, providing multiple answers, or a combination of boxes and other answers.
According to the current definition of the US Census Bureau, Hispanics and Latino Americans are not regarded as a separate racial group, but merely as a cultural identity and can belong to any racial group.
| ethnicities | proportion of |
|---|---|
| White Americans | 60.4% |
| Hispanics and Latinos | 18.3% |
| African American | 13.4% |
| Asian Americans | 5.9% |
| Multiethnic Americans | 2.7% |
| Indians of North America and Native Americans | 1.3% |
| Native Hawaiians and Americans from Oceania | 0.2% |
| Ethnicity | 1940 | 1950 | 1960 | 1970 | 1980 | 1990 | 2000 * | 2010 * |
|---|---|---|---|---|---|---|---|---|
| White Americans (including Hispancis) | 89.8 | 89.5 | 88.6 | 87.5 | 83.0 | 80.3 | 75.1 | 72.4 |
| Black or African American | 9.8 | 10.0 | 10.5 | 11.1 | 11.7 | 12.1 | 12.3 | 12.6 |
| native Americans | 0.8 | 0.8 | 0.9 | 0.9 | ||||
| Asian Americans and Pacific
Islanders |
1.5 | 2.9 | 3.8 | 5.0 | ||||
| other ethnicity | 3.0 | 3.9 | 5.5 | 6.2 | ||||
| two or more ethnicities | 2.4 | 2.9 | ||||||
| Total (%) | 99.6 | 99.5 | 99.1 | 98.6 | 100 | 100 | 100 | 100 |
| Ethnicity | Share 2015 | Share in 2060 |
|---|---|---|
| White Americans (not Hispanic) | 61.7% | 43.7% |
| Hispanics or Latinos (any ethnic group) | 17.7% | 28.6% |
| Black or African American | 12.4% | 13.0% |
| Asian Americans | 5.3% | 9.1% |
| native Americans | 0.7% | 0.6% |
| Indigenous Hawaiians or other Pacific islanders |
0.2% | 0.2% |
distribution
The regional ethnic distribution of the population is primarily due to historical and migration policy reasons. The white population is present in all parts of the country and has the highest proportion of the population in the central northern states and some states in the northeast. The African American population reaches the highest percentage in the southern states ( Mississippi , Louisiana , Georgia ), where about half of all African Americans live. African Americans make up a plurality of the population in the capital Washington, DC.Other population centers are the Midwest and Northeast, while the Pacific coast has a less strong presence. The Native Americans only make up more than 10% of the population in Alaska. Asian Americans live mostly on the west coast (especially California ) and Hawaii , where they make up the highest proportion of the population. The proportion of Latinos is highest in the Southwest (California, Arizona , Texas , New Mexico ) and Florida .
| State | Population (2015) |
White Americans | Black or African American | native Americans | Asian Americans | Indigenous Hawaiians or other Pacific islanders |
other ethn. group | two or more ethn. groups |
|---|---|---|---|---|---|---|---|---|
|
|
4,830,620 | 68.8% | 26.4% | 0.5% | 1.2% | 0.1% | 1.3% | 1.7% |
|
|
733.375 | 66.0% | 3.4% | 13.8% | 5.9% | 1.2% | 1.3% | 8.4% |
|
|
6,641,928 | 78.4% | 4.2% | 4.4% | 3.0% | 0.2% | 6.5% | 3.2% |
|
|
2,958,208 | 78.0% | 15.5% | 0.6% | 1.4% | 0.2% | 2.1% | 2.1% |
|
|
5,278,906 | 84.2% | 4.0% | 0.9% | 2.9% | 0.1% | 4.3% | 3.5% |
|
|
3,593,222 | 77.3% | 10.3% | 0.2% | 4.2% | 0.0% | 5.1% | 2.8% |
|
|
926.454 | 69.4% | 21.6% | 0.3% | 3.6% | 0.0% | 2.3% | 2.7% |
|
|
647.484 | 40.2% | 48.9% | 0.3% | 3.7% | 0.0% | 4.2% | 2.7% |
|
|
19,645,772 | 76.0% | 16.1% | 0.3% | 2.6% | 0.1% | 2.5% | 2.4% |
|
|
10,006,693 | 60.2% | 30.9% | 0.3% | 3.6% | 0.0% | 2.8% | 2.1% |
|
|
1,406,299 | 25.4% | 2.0% | 0.2% | 37.7% | 9.9% | 1.1% | 23.7% |
|
|
1,616,547 | 91.7% | 0.6% | 1.3% | 1.3% | 0.1% | 2.4% | 2.6% |
|
|
12,873,761 | 72.3% | 14.3% | 0.2% | 5.0% | 0.0% | 5.8% | 2.2% |
|
|
6,568,645 | 84.2% | 9.2% | 0.2% | 1.9% | 0.0% | 2.3% | 2.2% |
|
|
3,093,526 | 91.2% | 3.2% | 0.3% | 2.0% | 0.1% | 1.3% | 2.0% |
|
|
38,421,464 | 61.8% | 5.9% | 0.7% | 13.7% | 0.4% | 12.9% | 4.5% |
|
|
2,892,987 | 85.2% | 5.8% | 0.8% | 2.6% | 0.1% | 2.2% | 3.3% |
|
|
4,397,353 | 87.6% | 7.9% | 0.2% | 1.3% | 0.0% | 0.9% | 2.1% |
|
|
4,625,253 | 62.8% | 32.1% | 0.6% | 1.7% | 0.0% | 1.0% | 1.8% |
|
|
1,329,100 | 95.0% | 1.1% | 0.6% | 1.1% | 0.0% | 0.2% | 2.0% |
|
|
5,930,538 | 57.6% | 29.5% | 0.3% | 6.0% | 0.0% | 3.6% | 3.0% |
|
|
6,705,586 | 79.6% | 7.1% | 0.2% | 6.0% | 0.0% | 4.2% | 2.9% |
|
|
9,900,571 | 79.0% | 14.0% | 0.5% | 2.7% | 0.0% | 1.1% | 2.6% |
|
|
5,419,171 | 84.8% | 5.5% | 1.0% | 4.4% | 0.0% | 1.5% | 2.7% |
| Mississippi | 2,988,081 | 59.2% | 37.4% | 0.4% | 1.0% | 0.0% | 0.9% | 1.2% |
|
|
6,045,448 | 82.6% | 11.5% | 0.4% | 1.8% | 0.1% | 1.1% | 2.4% |
|
|
1,014,699 | 89.2% | 0.5% | 6.5% | 0.7% | 0.1% | 0.5% | 2.5% |
|
|
1,869,365 | 88.1% | 4.7% | 0.9% | 2.0% | 0.1% | 1.9% | 2.2% |
|
|
2,798,636 | 69.0% | 8.4% | 1.1% | 7.7% | 0.6% | 8.8% | 4.4% |
|
|
1.324.201 | 93.7% | 1.3% | 0.2% | 2.4% | 0.0% | 0.5% | 1.8% |
|
|
8,904,413 | 68.3% | 13.5% | 0.2% | 9.0% | 0.0% | 6.4% | 2.5% |
|
|
2,084,117 | 73.2% | 2.1% | 9.1% | 1.4% | 0.1% | 10.9% | 3.3% |
|
|
19,673,174 | 64.6% | 15.6% | 0.4% | 8.0% | 0.0% | 8.6% | 2.9% |
|
|
9,845,333 | 69.5% | 21.5% | 1.2% | 2.5% | 0.1% | 3.0% | 2.4% |
|
|
721.640 | 88.7% | 1.6% | 5.3% | 1.2% | 0.0% | 0.8% | 2.2% |
|
|
11,575,977 | 82.4% | 12.2% | 0.2% | 1.9% | 0.0% | 0.8% | 2.5% |
|
|
3,849,733 | 73.1% | 7.2% | 7.3% | 1.9% | 0.1% | 2.6% | 7.8% |
|
|
3,939,233 | 85.1% | 1.8% | 1.2% | 4.0% | 0.4% | 3.4% | 4.1% |
|
|
12,779,559 | 81.6% | 11.0% | 0.2% | 3.1% | 0.0% | 2.0% | 2.1% |
|
|
1,053,661 | 81.1% | 6.5% | 0.5% | 3.2% | 0.0% | 5.8% | 2.8% |
|
|
4,777,576 | 67.2% | 27.5% | 0.3% | 1.4% | 0.1% | 1.5% | 2.0% |
|
|
843.190 | 85.0% | 1.6% | 8.6% | 1.2% | 0.0% | 0.9% | 2.6% |
|
|
6,499,615 | 77.8% | 16.8% | 0.3% | 1.6% | 0.1% | 1.5% | 2.0% |
|
|
26,538,614 | 74.9% | 11.9% | 0.5% | 4.2% | 0.1% | 6.0% | 2.5% |
|
|
2,903,379 | 87.6% | 1.1% | 1.1% | 2.2% | 0.9% | 4.5% | 2.6% |
|
|
626604 | 94.9% | 1.1% | 0.3% | 1.4% | 0.0% | 0.3% | 1.9% |
|
|
8,256,630 | 69.0% | 19.2% | 0.3% | 6.0% | 0.1% | 2.2% | 3.2% |
|
|
6,985,464 | 77.8% | 3.6% | 1.3% | 7.7% | 0.6% | 3.8% | 5.2% |
|
|
1,851,420 | 93.6% | 3.3% | 0.2% | 0.7% | 0.0% | 0.2% | 2.0% |
|
|
5,742,117 | 86.5% | 6.3% | 0.9% | 2.5% | 0.0% | 1.7% | 2.1% |
|
|
579,679 | 91.0% | 1.1% | 2.2% | 0.9% | 0.1% | 2.1% | 2.7% |
|
|
3,583,073 | 69.7% | 8.4% | 0.3% | 0.3% | 0.0% | 12.0% | 9.3% |
migration

13% of the population were foreign-born in 2009 - a 350% increase since 1970 when foreign-borns made up 3.7% of the population, including 11.2 million illegal immigrants , 80% of whom are from Latin America. Latin America is the largest region of the birth region, accounting for over half (53%) of the foreign-born population in the United States, making it the largest source of legal and illegal immigration to the United States. In 2011 there are 18.1 million naturalized Americans in the United States, who make up 45% of the foreign-born population (40.4 million) and 6% of the total US population at that time, and become approximately 680,000 legal immigrants naturalized annually . By 2017, the proportion of migrants rose to 15.3%, most of whom are from Latin America and Asia . The proportion of migrants in the population is thus above many European countries, but below that of Canada and Australia .
The 10 most common origins of Americans in 2015 were German (14.7%, 46 million), African (12.3%, 39 million), Mexican (10.9%, 35 million), Irish (10.6% , 34 million), English (7.8%, 25 million), American (descent from the early settlers) (7.2%, 23 million), Italian (5.5%, 17 million), Polish (3.0%, 9 million), French (2.6%, 8 million) and Scottish (1.6%, 5 million).
There were almost 3 million Americans living abroad in 2015. Most of them live in Mexico (900,000), Canada (310,000), the United Kingdom (190,000), Germany (140,000) and Australia (120,000).
languages

Although the United States does not have a set official language, English is in fact its national language . It is used by 82% of the population as their mother tongue and by almost all residents as the lingua franca. English is used officially by 32 states and unofficially by the others as the official language and is the primary language in all states.
Spanish is taught as the first foreign language, especially in areas with high Latin American populations, such as states bordering Mexico , as well as Florida and the cities of Chicago and New York. Younger generations who do not come from any family with a Spanish-speaking background are learning the language in increasing numbers due to the growing number of the world's Spanish-speaking population. About 16.3% (over 50 million) understand this language.
The Chinese , especially the Cantonese , is the third largest language community of the United States and is particularly represented in California. While Spanish and French are particularly concentrated in certain regions, Chinese is relatively evenly distributed, with slightly more speakers on the west coast than elsewhere.
French follows in fourth place, with many speakers in Maine and Louisiana .
German , which is the second most widely spoken language in North Dakota and South Dakota , ranks fifth.
In addition, there is the German dialect Pennsylvania Deitsch , based on the 19th century Palatinate , which is still spoken mainly in Pennsylvania by Hutterites , Amish and other conservative emigrant groups, a total of several 100,000 speakers.
Furthermore, immigrants of Italian , Polish and Greek origin have formed other notable language communities since the early 20th century .
Since the 1970s, many people immigrated from the Soviet Union and often brought Russian with them.
Tagalog , Vietnamese and Korean also have a significant number of speakers over the million mark.
religion
.svg)
Religion in the United States is characterized by a variety of religious beliefs and practices. However, it is not possible to give exact figures on the respective religious affiliation, because the US Census Bureau does not collect any information in the sense of the constitutionally prescribed freedom of religion in the USA . The first American settlers were religious refugees. Compared to other industrialized countries , religiosity plays a significantly larger role in public life.
Historically dominant Protestantism no longer had a majority in the early 2010s. The Christianity is still the largest religion in the United States, the various Protestant churches have the most followers. There are a large number of sects and free churches in the USA . The United States is the country with the largest Christian population in the world.
In 2016, Christians were 73.7% of the total population, of which 48.9% were Protestants, 23.0% Catholics and 1.8% Mormons , followed by people with no religion with 18.2% of the total population. The Judaism is the second largest religion in the United States, which is practiced by 2.1% of the population, followed by Islam with 0.8%.
The regional distribution of denominations is different; while the majority of Catholics live in New England, the southern states are evangelical. The center of the Mormons is in Utah and the surrounding states ( Nevada , Idaho ); Especially in the south of the USA on the border with Mexico and due to Cuban emigration in the greater Miami area , mainly Catholic Latinos live. The centers of the Jewish population are metropolises such as New York and the surrounding area, Boston , Los Angeles , San Francisco and southeast Florida.
Mississippi is the most religious state in the country, with 63% of the population describing themselves as very religious. Religion is very important to these people and they say they attend church services almost every week , while in New Hampshire only 20% of the adult population consider themselves very religious, making it the least religious state. As particularly religious, the countries of the so-called apply Bible Belt (German: Bible Belt ).
According to a 2018 study by the Pew Research Center , Islam will overtake Judaism by 2040 and become the second largest religion in the US due to higher immigration and birth rates.
Fertility rate
The US fertility rate is above most other western industrialized countries, but below the global average. The country experienced a characteristic baby boom after World War II . At the end of the 1960s, fertility per woman fell significantly, parallel to the development in other western countries ( pill break ). In 1976, the fertility per woman reached its lowest level in history with 1,738 children. After that, fertility began to rise again, mainly due to the higher birth rate of immigrants and an improved economic situation. Until 2007, fertility rose above the replacement level and has been falling again since the financial crisis of 2008 .
Fertility rate from 1800 to 2010
| year | 1800 | 1810 | 1820 | 1830 | 1840 | 1850 | 1860 | 1870 | 1880 | 1890 | 1900 |
|---|---|---|---|---|---|---|---|---|---|---|---|
| Fertility Rate in the United States | 7.0 | 6.9 | 6.7 | 6.6 | 6.1 | 5.4 | 5.2 | 4.6 | 4.2 | 3.9 | 3.6 |
| year | 1910 | 1920 | 1930 | 1940 | 1950 | 1960 | 1970 | 1980 | 1990 | 2000 | 2010 |
|---|---|---|---|---|---|---|---|---|---|---|---|
| Fertility Rate in the United States | 3.4 | 3.2 | 2.5 | 2.2 | 3.0 | 3.5 | 2.5 | 1.8 | 2.08 | 2.06 | 1.93 |
Births and Fertility by Ethnicity
| race | Number of births in 2016 |
proportion of | Fertility per woman (2016) |
Number of births in 2017 |
proportion of | Fertility per woman (2017) |
|---|---|---|---|---|---|---|
| White (non-Hispanic) | 2,092,252 | 53.09% | 1.72 | 2,014,898 | 52.26% | 1.67 |
| African American (Non-Hispanic) | 583,498 | 14.81% | 1.83 | 565.164 | 14.66% | 1.82 |
| Asian Americans and Pacific Islanders | 284,723 | 7.19% | 1.69 | 258,676 | 6.71% | 1.52 |
| American natives | 34,287 | 1.04% | 1.13 | 29,957 | 0.78% | 0.85 |
| Hispanic and Latinos (of any race) | 915.917 | 23.24% | 2.04 | 898.764 | 23.31% | 2.01 |
| Total | 3,941,109 | 100% | 1.82 | 3,855,500 | 100% | 1.76 |
Life expectancy

Due to better health care, life expectancy rose steadily in the 19th and first half of the 20th century. In 1950 the United States had one of the highest life expectancies in the world. In the second half of the century the pace of growth began to level off and the United States began to fall behind in global terms. From 2010 onwards, stagnation was largely observed and in 2017 average life expectancy fell for the third time in a row. The main reasons for this are increased mortality among middle - aged white men from obesity , drug and alcohol abuse, suicide, and problems in the public health sector.
In 2016, the average life expectancy at birth was 78.69 years. The life expectancy was thus on the level of Lebanon and Cuba and under almost all other western industrialized countries. Life expectancy in the USA depends strongly on social class and ethnic group and correlates with the level of education. Asians have the highest life expectancy, followed by Latinos and Hispanic people, then whites, and blacks have the lowest average life expectancy. Regionally, the southern states and West Virginia have the lowest life expectancy, and Hawaii, California, the central northern states, and the New England states have the highest.
1901-1950
Life expectancy from 1901 to 1950. Source: Our World In Data
| year | 1901 | 1902 | 1903 | 1904 | 1905 | 1906 | 1907 | 1908 | 1909 | 1910 |
|---|---|---|---|---|---|---|---|---|---|---|
| Life expectancy in the United States | 49.3 | 50.5 | 50.6 | 49.6 | 50.3 | 50.2 | 50.1 | 51.9 | 52.8 | 51.8 |
| Years | 1911 | 1912 | 1913 | 1914 | 1915 | 1916 | 1917 | 1918 | 1919 | 1920 |
|---|---|---|---|---|---|---|---|---|---|---|
| Life expectancy in the United States | 53.4 | 54.1 | 53.5 | 54.6 | 55.1 | 54.2 | 54.0 | 47.0 | 55.3 | 55.4 |
| Years | 1921 | 1922 | 1923 | 1924 | 1925 | 1926 | 1927 | 1928 | 1929 | 1930 |
|---|---|---|---|---|---|---|---|---|---|---|
| Life expectancy in the United States | 58.2 | 58.1 | 57.5 | 58.5 | 58.5 | 57.9 | 59.4 | 58.3 | 58.5 | 59.6 |
| Years | 1931 | 1932 | 1933 | 1934 | 1935 | 1936 | 1937 | 1938 | 1939 | 1940 |
|---|---|---|---|---|---|---|---|---|---|---|
| Life expectancy in the United States | 60.3 | 61.0 | 60.9 | 60.2 | 60.9 | 60.4 | 61.1 | 62.4 | 63.1 | 63.2 |
| Years | 1941 | 1942 | 1943 | 1944 | 1945 | 1946 | 1947 | 1948 | 1949 | 1950 |
|---|---|---|---|---|---|---|---|---|---|---|
| Life expectancy in the United States | 63.8 | 64.6 | 64.3 | 65.1 | 65.6 | 66.3 | 66.7 | 67.3 | 67.6 | 68.1 |
1950-2015
| period | Life expectancy in years |
period | Life expectancy in years |
|---|---|---|---|
| 1950-1955 | 68.7 | 1985-1990 | 74.9 |
| 1955-1960 | 69.7 | 1990-1995 | 75.7 |
| 1960-1965 | 70.1 | 1995-2000 | 76.5 |
| 1965-1970 | 70.4 | 2000-2005 | 77.2 |
| 1970-1975 | 71.4 | 2005-2010 | 78.2 |
| 1975-1980 | 73.3 | 2010-2015 | 78.9 |
| 1980-1985 | 74.4 |
Source: UN World Population Prospects
Median age
In 2017, the mean age of the American population was 38.1 years, making the USA younger than most other western industrialized countries (in Germany, the mean age in 2015 was around 46.3 years). An increase to 40.6 years is expected by 2050.
| year | 1820 | 1830 | 1840 | 1850 | 1860 | 1870 | 1880 | 1890 | 1900 |
|---|---|---|---|---|---|---|---|---|---|
| Median age of the total population | 16.7 | 17.2 | 17.8 | 18.9 | 19.4 | 20.2 | 20.9 | 22.0 | 22.9 |
| Median age men | 16.6 | 17.2 | 17.9 | 19.2 | 19.8 | 20.2 | 21.2 | 22.3 | 23.3 |
| Median age women | 16.8 | 17.3 | 17.8 | 18.6 | 19.1 | 20.1 | 20.7 | 21.6 | 22.4 |
| year | 1910 | 1920 | 1930 | 1940 | 1950 | 1960 | 1970 | 1980 | 1990 | 2000 | 2010 | 2017 |
|---|---|---|---|---|---|---|---|---|---|---|---|---|
| Median age of the total population | 24.1 | 25.3 | 26.5 | 29.0 | 30.2 | 29.6 | 28.1 | 30.0 | 32.9 | 35.3 | 37.2 | 38.1 |
| Median age men | 24.6 | 25.8 | 26.7 | 29.1 | 29.9 | 28.7 | 26.8 | 28.8 | 31.7 | 34.0 | 35.8 | 36.8 |
| Median age women | 23.5 | 24.7 | 25.2 | 29.0 | 30.5 | 30.4 | 29.8 | 31.2 | 34.1 | 36.5 | 38.5 | 39.4 |
Individual evidence
- ↑ Population Clock . United States Census Bureau.
- ↑ Annual Estimates of the Resident Population: April 1, 2010 to July 1, 2016 - 2016 Population Estimates . US Census Bureau.
- ^ A b North America :: United States - The World Factbook - Central Intelligence Agency. Retrieved February 22, 2019 .
- ↑ Table 13. State Population - Rank, Percent Change, and Population Density ( Excel ) US Census Bureau. October 24, 2010. Archived from the original on September 23, 2015. Info: The archive link has been inserted automatically and has not yet been checked. Please check the original and archive link according to the instructions and then remove this notice.
- ^ Mean Center of Population for the United States: 1790 to 2000 . US Census Bureau. October 24, 2010. Archived from the original on November 3, 2001. Info: The archive link was automatically inserted and not yet checked. Please check the original and archive link according to the instructions and then remove this notice.
- ↑ a b Annual Estimates of the Resident Population: April 1, 2010 to July 1, 2017 . United States Census Bureau. Retrieved April 7, 2018.
- ^ National Vital Statistics Reports. Births: Final Data for 2017 . December 27, 2018.
- ^ National Vital Statistics Reports. Births: Preliminary Data for 2016 . 3rd October 2017.
- ^ Statistical Abstract of the United States . United States Census Bureau .
- ↑ US population hits 300 million mark , MSNBC . 2006.
- ↑ Morello, Carol and Mellnik, Ted. "Census: Minority Babies Are Now Majority in United States." Washington Post . May 17, 2012.
- ^ Antonio Flores: How the US Hispanic population is changing. In: Pew Research Center. Retrieved February 22, 2019 (American English).
- ↑ Projected Population by Single Year of Age, Sex, Race, and Hispanic Origin for the United States: July 1, 2000 to July 1, 2050 . US Census Bureau. December 8th, 2009. Archived from the original on October 10th, 2012. Info: The archive link was automatically inserted and not yet checked. Please check the original and archive link according to the instructions and then remove this notice.
- ^ A b World Population Prospects - Population Division - United Nations .
- ^ US Census Bureau _ Census of Population and Housing . Retrieved November 21, 2014
- ↑ Extract from Census.gov . Retrieved February 28, 2011
- ↑ Excerpt from factfinder.census.gov , accessed on February 28, 2011.
- ↑ History com Editors: US Immigration Before 1965. Retrieved February 22, 2019 .
- ↑ lib.utexas.edu
- ↑ a b Population Division Working Paper - Historical Census Statistics On Population Totals By Race, 1790 to 1990, and By Hispanic Origin, 1970 to 1990 - US Census Bureau. (No longer available online.) Archived from the original on August 6, 2012 ; accessed on February 23, 2019 . Info: The archive link was inserted automatically and has not yet been checked. Please check the original and archive link according to the instructions and then remove this notice.
- ^ Kory L. Meyerink, Loretto Dennis Szucs: The Source: a Guidebook of American Genealogy . Ancestry, Salt Lake City 1997.
- ^ Chinese Exclusion Act | United States [1882]. Retrieved February 22, 2019 .
- ^ Civil War Casualties. November 16, 2012, accessed February 22, 2019 .
- ↑ " Demographics Trends in the 20th Century ( Memento of the original from January 20, 2012 in the Internet Archive ) Info: The archive link has been inserted automatically and has not yet been checked. Please check the original and archive link according to the instructions and then remove this notice. US Census Bureau .
- ↑ We the Americans: Blacks. Census.gov.
- ↑ The History of Immigration to the United States. Retrieved February 19, 2019 .
- ^ The Legacy of the 1965 Immigration Act. Retrieved February 22, 2019 .
- ↑ a b United States of America: historical demographical data of the whole country . Jan Lahmeyer. January 22, 2000. Retrieved October 16, 2013.
- ↑ cdc.gov
- ↑ 1960 to 2011 United States - Death rate: Death rate, crude (per 1,000 people) . IndexMundi. Retrieved October 24, 2013.
- ↑ cdc.gov
- ↑ cdc.gov
- ↑ Births: Provisional Data for 2018. Retrieved November 22, 2019 .
- ↑ The fastest growing (and shrinking) states: A closer look. Retrieved February 22, 2019 .
- ↑ Population of US metropolitan areas 2017 | Statistic. Retrieved February 23, 2019 .
- ^ US Census Bureau: About Race. Retrieved February 22, 2019 (American English).
- ↑ Population estimate July 1, 2019. US Census Bureau, June 1, 2019, accessed July 8, 2020 .
- ↑ US population: ethnic groups in America 2015 and 2060. Accessed February 23, 2019 .
- ↑ ACS Demographic and Housing Estimates - 2011–2015 . US Census Bureau.
- ↑ Homeward Bound: Recent Immigration Enforcement and the Decline in the Illegal Alien Population . In: Center for Immigration Studies .
- ↑ Illegal immigration to US drops after rising for decade . December 6, 2012.
- ↑ Largest source of legal and illegal immigrants to US ,
- ↑ Frequently Requested Statistics on Immigrants and Immigration in the United States .
- ↑ World Migration. January 15, 2015, accessed February 22, 2019 .
- ↑ ACS DEMOGRAPHIC AND HOUSING ESTIMATES - 2011-2015 American Community Survey 5-Year Estimates . US Census Bureau.
- ↑ SELECTED SOCIAL CHARACTERISTICS IN THE UNITED STATES - 2011-2015 American Community Survey 5-Year Estimates . US Census Bureau.
- ↑ Migration Report 2017. (PDF) UN, accessed on September 30, 2018 (English).
- ↑ Origins and Destinations of the World's Migrants, 1990-2017 . In: Pew Research Center's Global Attitudes Project . February 28, 2018 ( pewglobal.org [accessed September 30, 2018]).
- ↑ Sharon R. Ennis, Merarys Ríos-Vargas and Nora G. Albert: The Hispanic Population: 2010, 2010 Census Briefs. (2011) C2010BR-04 ( PDF download ), p. 3
- ↑ Dirk Laabs: bpb.de - Dossier USA - Society - Position of Religion. Retrieved February 22, 2019 .
- ^ Gallup, Inc .: Five Key Findings on Religion in the US (en-us) . In: Gallup.com .
- ^ Matthew Isbell: Reformation Day - Christianity in America. In: MCIMaps.com , October 31, 2017 (English).
- ^ Mathew Isbell: Hanukkah Article: The Geography of Jews in America. In: MCIMaps.com , December 11, 2017 (English).
- ^ Frank Newport: New Hampshire Now Least Religious State in US . Gallup. February 4, 2016. Retrieved August 3, 2016.
- ↑ Matt Rosenberg Matt Rosenberg is a professional geographer, writer with over 20 years of experience He is the author of both a geography reference book, a guide to winning National Geography Bee contests: Where and What Is the Bible Belt? Retrieved February 20, 2019 .
- ^ AJ Willingham CNN: By 2040, Islam could be the second-largest religion in the US. Retrieved February 22, 2019 .
- ↑ Americans aren't making enough babies to replace ourselves. Retrieved February 22, 2019 .
- ↑ a b c d United States. Bureau of the Census: Volume 1 . 1975 ( online [accessed February 22, 2019]).
- ↑ CDC - NCHS - National Center for Health Statistics. February 19, 2019, accessed February 23, 2019 (American English).
- ^ Meilan Solly: US Life Expectancy Drops for Third Year in a Row, Reflecting Rising Drug Overdoses, Suicides. Retrieved February 22, 2019 .
- ↑ - The Washington Post. Retrieved February 22, 2019 .
- ↑ Life expectancy at birth, total (years) | Data. Retrieved February 22, 2019 .
- ↑ USA CAUSES OF DEATH BY AGE AND GENDER. Retrieved February 22, 2019 .
- ^ Life Expectancy at Birth (in years). In: The Henry J. Kaiser Family Foundation. August 27, 2014. Retrieved February 22, 2019 (American English).
- ↑ a b c d e Life expectancy .
- ↑ 1615 L. St NW, Suite 800 Washington, DC 20036 USA202-419-4300 | Main202-419-4349 | Fax202-419-4372 | Media Inquiries: Median Age on the Rise in the US, Germany and Italy | Pew Research Center. Retrieved February 19, 2019 (American English).