
Wind energy

The wind energy or wind power is the large-scale use of wind as a renewable energy source . Wind energy has been used since ancient times to make energy from the environment available for technical purposes. In the past, the mechanical energy made available with windmills was used directly on site to drive machines and devices. With their help, grain was ground into flour, groundwater was brought to the surface, or sawmills were operated. Today the generation of electrical energy with wind turbines is by far the most important use.
At the end of 2019, wind turbines with a nominal output of over 651 GW were installed worldwide , 29.1 GW of which were offshore . Approx. 290.6 GW are in Asia and more than 148 GW in America, another large part in Europe, while only a few GW are installed in Africa. The wind turbines installed by 2017 were able to cover around 5.6% of the world's electricity demand. In 2016, the systems installed worldwide delivered around 960 TWh of electrical energy, according to BP's figures ; corresponding to around 3.9% of global electricity production. Its share in the global primary energy consumption of (160,056 TWh), of which it tends to be underrepresented due to the calculation method, was 0.6%. In good locations, the electricity production costs of wind turbines are now cheaper than the electricity production costs of new coal and nuclear power plants . Depending on various factors such as B. wind speeds (meaning here: quantitatively and qualitatively suitable wind resources - locally) and system design of wind turbines reach approximately between 1,400 and 5,000 full load hours (the latter on the best offshore sites).
History of wind energy use

When the first windmills were built is a matter of dispute. According to written records from the Codex Hammurapi , they were used more than 4,000 years ago, other researchers only consider their use as documented for the 7th century AD. In Europe, the oldest mentions from England date back to the middle of the 9th century AD, and they are recorded in France in the 11th century. In the 13th century they had spread to Poland. The wind energy was used to perform mechanical work with the help of windmills and water pumps.
In the 19th century, there were some 100,000 wind turbines in Europe, which achieved an output of up to 25–30 kW in good wind conditions. France, England, Germany, the Netherlands, Belgium and Finland had between 50,000 and 60,000 windmills in the first half of the 19th century. Around 1900, around 30,000 windmills with a total output of several 100 MW were in operation in the countries bordering the North Sea alone . Windmills were particularly widespread in the Netherlands, where there were around 9,000 mills in the second half of the 19th century alone. The mills were used for grinding grain, cotton spinning and fulling, and the mills also served as a source of power for pushing leather, sawing wood, producing oil, paper and tobacco, as well as draining swamp areas or areas of land below sea level.
In Germany, the number of windmills rose during the industrial revolution, initially up to the point of high industrialization , and reached its maximum in the 1880s. In the following decades, many of the windmills were successively replaced by fossil fuel sources or electric drives. In 1895 there were around 18,000 windmills in operation in Germany. It is estimated that around 11,400 windmills were in operation in 1914 and 4,000 to 5,000 in 1933. Wind pumps were also important ; the multi-bladed western wind turbines with an output of a few 100 watts were widespread. By around 1930, over six million Westernmills were produced, of which around 150,000 are still available. The Western wind turbines ( Western Mill ) developed in the USA from 1854 onwards were used as water pumps in North and South America, Australia and parts of Africa and were later also used to generate electricity. In the USA there were around 1,000 manufacturers of windmills, but they almost completely disappeared from the market after the boom.
After the discovery of electricity and the invention of the generator , the idea of using wind energy to generate electricity was obvious. The first wind turbines for generating electricity were built in the late 19th century and remained largely unchanged until after the Second World War , when the first larger systems with a few 100 kW came onto the market. Since the oil price crisis in the 1970s, there has been an increasing search worldwide for alternatives to energy generation , which has also promoted the development of modern wind turbines. In 1979, various Danish companies began to manufacture wind turbines in series. Since the early 1990s, the wind industry has been one of the fastest growing industrial sectors in the world.
After the Second World War were in the American-occupied areas in Bavaria several thousand and, in Upper Austria , numerous Western wind turbines ( Western Mills) constructed to pump water. Around 1958 and around 1970 a few were still to be seen, only one in Dietmannsried in the Allgäu has survived to this day in Bavaria . The one in Unterroithen in Upper Austria is the emblem of Edt bei Lambach and in the coat of arms awarded in 1980 it is represented symbolically in gold and with 12 wings.
Electricity generation through wind energy


Wind energy is one of the most promising regenerative energy sources due to its worldwide availability, its low costs and its level of technological development. You become one of the mainstream technologies in electricity production and plays also due to technological advances and economic competitiveness in many markets around the world, a central role in the energy policy and energy strategies in a growing number of countries in the world.
Wind turbines can be used to generate electricity in all climate zones , at sea and in all land locations (coast, inland, mountains) . Often, a distinction is only made between the use of wind energy on land ( onshore ) and the use at sea in offshore wind farms . So far, onshore wind energy has been of particular importance, while offshore wind energy has been a niche market globally with a share of around 3.5% of the installed capacity. The onshore sector is also expected to dominate in the long term, albeit with an increasing share of offshore installations. So z. For example, the IEA assumes that around 80% of the expansion will take place on land by 2035.
Physical basics
In terms of output, a distinction must be made between the nominal electrical output, which results from the technical construction, and the yield that can actually be achieved at the location, which results from a number of other factors. When planning, data from weather observations (wind strength, wind direction) are used to calculate a forecast. These forecasts are mean values and can deviate from the results of the individual years due to weather conditions. Long-term considerations are essential for large-scale use of wind energy, the planning of power grids and storage capacities.
The in electric power actionable performance from the wind supply can be calculated from the kinetic power supply of the mass flow of the air calculated, multiplied by the efficiency by Betz (whose maximum is 16/27, that is almost 60%), from the flow losses (friction component in the Navier Stokes equations ) as well as the mechanical (friction losses in the gearbox and the bearings of the converter) and electrical efficiency of the system :


The symbols mean:
- η : efficiency, see description above
- A : cross-sectional area of the rotor in m²
- ρ : density of the air in kg / m³
- ṁ : mass flow of air in kg / s ( ṁ = ρ · A · v )
- v : mean speed of the air in m / s
- P : Power of the converter in watts
The achievable power increases with the third power of the wind speed. This means that double the wind speed leads to 8 times the wind energy yield and, conversely, halving the wind speed reduces the yield to 1/8. This relationship explains the enormous fluctuations in wind energy feed-in. The wind speed is therefore a key factor for the profitability of wind turbines.
The frequency distribution of the generated wind power can be approximated well with the log-normal distribution . The same type of distribution also describes the frequency distribution of the wind speed (note: the power generated from photovoltaics can also be described with the log-normal distribution).
The strong weather dependency of the electrical energy generated from wind power can be derived from the second diagram. Due to the high degree of variability, it is essential to forecast the expected feed-in from wind power sources as precisely as possible (see also the article on wind power forecast ) in order to be able to plan and distribute the electricity accordingly.
potential
Worldwide
In 2015, scientists from the Max Planck Institute for Biogeochemistry examined the physical boundary conditions for the further expansion of wind energy. The researchers came to the conclusion that large-scale wind farms in windy regions can achieve a maximum output of 1 watt / m². The reason for the low output is seen in the study as the braking effect that acts on the wind when many wind turbines are installed in a region. The current development status of wind power is, however, still well below the limits described here.
According to a paper published in 2013 in the journal Nature Climate Change , near-ground wind energy offers theoretical potential for over 400 terawatts of power worldwide . If the energy of the high-altitude winds were also used, 1,800 terawatts would be possible, around 100 times the current global energy demand. Using the full potential of wind energy would result in pronounced changes in the climate; using only 18 terawatts, which corresponds to the current world primary energy demand, would not have any significant impact on the climate. It is therefore unlikely that the geophysical wind energy potential will limit the expansion of wind power generation.
In 2009, researchers at Harvard University determined the global wind energy potential using conservative assumptions and came to the conclusion that it far exceeded the global energy demand : the demand for electrical energy at that time was 40 times as much, the total energy demand by 5 times. According to a flow model calculation also published by Stanford University in 2009, wind turbines, if they were to cover all of today's global energy requirements, would reduce the energy content of the lower air layer by around 0.007%. However, this is at least one order of magnitude smaller than the influence of settlement and aerosols from exhaust gases. The heating effects of electricity generation with wind turbines are much lower than the waste heat from thermal power plants.
Germany

The potential atlas Germany created by the Renewable Energy Agency in 2010 came to the conclusion that wind turbines on 0.75% of the land area could cover 20% of Germany's electricity demand in 2020.
In 2013 the Federal Environment Agency published a study on the nationwide area and power potential of wind energy on land. The potential was modeled by the Fraunhofer Institute for Wind Energy and Energy System Technology on the basis of detailed geodata and modern wind turbine technology. Accordingly, based on the assumptions made, 13.8 percent of the area of Germany is available for wind energy use. This area potential enables an installed capacity of around 1,190 GW with an annual electricity yield of around 2,900 TWh. However, the realizable potential of onshore wind energy is estimated to be considerably lower because various aspects were not considered in the study (e.g. species protection issues or economic framework conditions).
A study commissioned by the Bundesverband WindEnergie eV in 2011 came to the result that if 2% of the area of Germany were used by onshore wind energy, an installed capacity of 189 GW would be possible. This would require 62,839 wind turbines, each with 3 MW installed capacity, to be in operation. The possible electricity yield was estimated at 390 TWh per year. That would correspond to around 60% of German electricity generation. In 2018, around 30,000 wind turbines with an average installed capacity of 1.94 MW were in use and the electricity yield was 112 TWh.
Deployment security

Wind power forecast
Wind energy is part of an energy mix and is only one pillar of renewable energies . Their main disadvantage - especially with onshore plants - is the irregular power output that fluctuates with the wind, which must be compensated for by sensible power plant management. In strong winds, a wind turbine generates 100% of its nominal output (= full load), in calm conditions 0%. What is decisive, however, is the sum of the energy fed in over larger areas, as the fluctuations in the respective wind speeds due to the combination of wind turbines at different locations are partially mutually balanced. 2012 was z. B. the maximum (measured on January 3, 2012) onshore feed-in in Germany with 24,086 MW about 78% of the total installed power.

Other renewable energies can have a balancing effect and, on average, sometimes have opposing supply behavior. The curve of the feed-in power of wind turbines averaged over several years in Western Europe shows on average higher mean values during the day than at night and higher in winter than in summer; it thus correlates over the course of the day as well as seasonally with the mean electricity demand. In Germany, around twice as much wind power is usually generated in the winter months as in the summer months. At the same time, the amount of wind energy produced fluctuates greatly in an entire control area and can almost correspond to the load or be almost zero.
Meteorological forecasting systems make it possible to estimate the power fed into the power grid by wind farms using wind power forecasts in the range from hours to days in advance. With a forecast period of 48 h to 72 h, the accuracy is 90%, with a 6-hour forecast it is more than 95%. Only a few power plants supplying control energy are required to maintain an uninterrupted supply of electricity .
Control energy demand
Since the amendment to the law for the priority of renewable energies (EEG) on July 1, 2004, the control area operators are obliged to immediately and horizontally balance wind energy feed-in. If the total output of currently (as of October 2019) almost 30,000 wind turbines in the German power grid is considered, the averaging, spatial distribution and different system behavior in individual control areas (with the exception of extreme weather conditions) mean that the fluctuations in wind power feed-in are balanced out with medium- load power plants can be. Expensive control energy (primary and secondary control) is usually not required. This is proven, for example, by studies for the “regular market report” prepared on behalf of several municipal utilities. There is no evidence of a market-relevant relationship between wind power feed-in and the amount and price of control energy. It is assumed that the increased use of wind energy will also increase the demand for balancing energy, especially negative balancing energy, but the balancing energy actually provided has remained the same or has decreased slightly in recent years.
Are fossil fuel power plants for short-term provision of (negative) control power in partial load driving operation shut down instead of completely whose takes efficiency somewhat. For modern hard coal power plants , the efficiency in full load operation is around 45–47%. If these power plants are throttled to 50% output, the efficiency drops to approx. 42–44%. In combined cycle power plants with a full load efficiency of 58-59%, the efficiency is reduced to 52-55% at 50% output in a single-block configuration.
In 2013, a study by the NREL predicted the additional costs for the increased regulation and start-up and shutdown of conventional power plants due to a higher feed-in from wind and solar energy. With a share of 33% of these fluctuating forms of energy in the total feed-in, the operating costs of conventional power plants in the western USA would increase by 2 to 5%, corresponding to $ 0.47-1.28 / MWh. This would add up to US $ 35 million to US $ 157 million in additional costs, while the fuel saved would result in savings of around US $ 7 billion. Compared to the savings from the increased operation of wind and solar systems, the increase in carbon dioxide emissions due to increased regulation of 0.2% is negligible.
The amount of reserve power to be kept depends to a large extent on the predictive accuracy of the wind, the ability of the network to regulate and the power consumption over time. In the event of a strong expansion of wind energy generation, as was investigated in the dena grid study for Germany, the need for control and reserve capacity (medium -load power plants) will increase, but according to the study it can be met without the construction of new power plants (i.e. only with the existing power plant fleet) become. An extension of wind turbines does not automatically lead to a reduction in the less utilized power plant capacities that can be controlled as required.
The discontinuity of the wind can be compensated for in connection with other energy sources or with storage systems such as pumped storage power plants or the conversion into wind gas for a continuous energy supply. This can be done by forecasting the feed-in and exchange in and between the transmission grids (control areas) in interaction with other power plants as with normal consumption fluctuations. According to a study by DENA, Germany is currently assuming a maximum share of 20 to 25% with only moderate expansion of the network infrastructure. Further options for increasing the share of wind power in total power generation above this level in the future are:
- Reinforcement and meshing of the high-voltage network with neighboring control areas or regions further away and strategic distribution of wind turbines in the large area thus formed,
- Demand side management through intelligent power grids ,
- Combination with other base-load renewable energies to smooth the feed-in,
- Design of the wind turbines for a higher capacity factor by increasing the rotor area with the same nominal power,
- Increase in the installed nominal power and temporary shutdown in the event of excess power
- Improved energy storage , for example through lift storage power plants and compressed air storage power plants .
Due to limited network capacities, wind turbines can be shut down or throttled locally or regionally, especially during storm phases (" curtailment "). In 2010, 150 GWh were lost in Germany, in 2011 it was 407 GWh. This corresponded to 0.4 or 0.83% of the wind energy fed into the respective years. In Germany, operators are compensated for such production cuts in accordance with the Renewable Energy Sources Act . In 2012 the regulated work fell to 385 GWh, which corresponds to approx. 0.71% of the total wind power production fed into the grid. Mainly affected were wind turbines with approx. 93.2%. Compensation amounting to EUR 33.1 million was paid for this.
In numerous, mostly diesel-based island grids with wind power feed-in (Australia, Antarctica, Falklands, Bonaire), besides demand side management, batteries and in some cases also flywheel storage systems are used for short and medium-term grid stabilization and optimization, with relatively poor efficiencies for economic reasons (reduction the very expensive share of diesel electricity) can be accepted. Storage of wind power through hydrogen electrolysis and combustion (see hydrogen storage , hydrogen economy ) and flywheel storage was tested in a model project on the Norwegian island of Utsira .
Reactive power control
Older fixed-speed wind turbines with asynchronous generators , which were used in the early phase of wind energy use (i.e. from the 1970s to the early 1990s), in some cases have properties that can cause problems in network operation if they are expanded significantly; this applies above all to the so-called reactive current . This can be remedied by means of reactive current compensation; Modern variable speed systems with electronic power converters can reactive current anyway adjusted as desired and also counteract voltage fluctuations on the requirements of the network, so they can even contribute to grid stabilization. In the course of so-called repowering , numerous old systems have been dismantled.
economics
LCOE and competitiveness


The modern use of wind energy is a technology that, having started in the late 1970s, has been used on a larger scale since the 1990s. The potential for improvement will gradually be tapped through economies of scale as a result of further research and the industrial series production that has now become established at most manufacturers, which is why there is still further potential for cost reductions due to further technical development.
As of 2018, wind turbines can in many cases produce electrical energy more cheaply than conventional power plants. Due to its economic efficiency, wind energy plays an important role in dampening the rise in electricity prices. The largest cost factor in wind power generation is the relatively high initial investment in the systems; the operating costs (including maintenance; possibly site rental) and the dismantling costs are relatively low. Locations inland can also be used economically practically worldwide; In good onshore locations, wind power plants have been competitive with conventional power plants without subsidies since 2008 .
In the long term, it is assumed that wind energy will either be the cheapest form of electricity production in the future or that it will take second place behind large-scale photovoltaic power plants. When making such comparisons, it is important to apply the actual full electricity generation costs of the individual technologies over their entire operating period. The electricity exchange price, which is sometimes quoted in this context , is unsuitable, however, as it results in values for conventional power plants which, due to various structural factors, are far below their electricity production costs. This makes the difference between wind energy and conventional power plants appear greater than it is in reality.
According to Fraunhofer ISE (as of 2018), wind turbines can produce 3.99 ct / kWh to 8.23 ct / kWh at lower electricity generation costs than new hard coal and gas power plants, the electricity generation costs of 6.27 ct / kWh to 9.86 ct / kWh or 7.78 ct / kWh to 9.96 ct / kWh. Lignite-fired power plants also have slightly higher electricity production costs than wind power plants on land, at 4.59 ct / kWh to 7.98 ct / kWh. Offshore plants are significantly more expensive due to the greater construction costs and higher financing and operating costs despite more full load hours ; their electricity production costs in 2018 were 7.49–13.79 ct / kWh.
In good locations, the electricity production costs were already below those of new coal and nuclear power plants in 2013 . So determined z. B. a study published by Deutsche Windguard on very good onshore locations (150% of the reference yield) electricity production costs of 6.25 ct / kWh. With an average cost structure and normal return expectations of the operators, locations are considered to be profitable up to around 80% of the reference yield . At these locations, electricity production costs of approx. 9 ct / kWh were achieved, which roughly corresponds to the feed-in tariff paid for wind turbines at the time . Between 2010 and 2013, the levelized costs of electricity decreased by around 11% per year at weaker locations, adjusted for inflation, and by 5.2% per year at good locations. The study saw further potential for cost savings in the further development of system technology and in the construction of wind turbines with larger rotor diameters and hub heights.
These basic assumptions were shared by Bloomberg in 2012 . Wind turbines in some countries with good wind conditions and comparatively high electricity costs, such as Brazil, Argentina, Canada, Portugal and the United Kingdom, are competitive with conventional electricity producers. By 2016, grid parity should also be achieved in areas with moderate wind conditions . For Australia, for example, Bloomberg predicted in February 2013 that wind turbines in a wind farm could produce significantly more cost-effectively than new coal or gas-fired power plants. The electricity production costs of a new wind farm would be 80 Australian dollars per MWh, for coal-fired power plants 143 A $ and for gas power plants 116 A $. For the latter, the cost of CO 2 emissions was included (at A $ 23 per tonne of CO 2 ). According to Bloomberg, in 2019 the power supply with wind energy was the cheapest technology in the countries Argentina, Brazil, China, Denmark, Germany, Great Britain, Canada, Morocco, Mexico, Peru, USA and Uruguay.
In Brazil, one of the countries in which the use of wind energy is one of the cheapest in a world-wide comparison, the electricity production costs of wind turbines were already below 60 US dollars / MWh in 2012, the equivalent of around 50.6 euros / MWh .
advancement
In order to facilitate the desired investments in wind energy even at locations with less wind prospect , these are funded in many countries regardless of political orientation. Possible funding measures are:
- Promotion of research and development
- Promotion of prototypes and demonstration objects
- partial assumption of investment costs
- Cheaper loans
- Tax breaks (e.g. PTC in the US)
- Payments also for electricity not produced ("ghost electricity")
As the most important criterion for the expansion, Gasch u. a. Planning security, as is achieved above all with minimum price systems based on feed-in tariffs. The first laws on this were passed in Denmark in 1981, in Germany in 1991 and in Spain in 1993 and led to a long-term and stable expansion of wind energy there. Quota systems such as those that existed in England and, until 2002, in France, are not considered to be very effective; their success is rated as “moderate to zero”. In the meantime, many countries are relying on minimum price systems (e.g. Germany, Spain, Austria, France, Portugal, Greece, Great Britain), as more installed capacity is achieved in this way.
Feed-in tariff
In Austria, the feed-in tariff for wind power as of July 2008 is 7.8 ct / kWh for existing systems and 7.54 ct / kWh for new systems.
In Germany in 2017, the initial payment for onshore wind energy under the EEG for at least 5 years was 8.38 ct / kWh; the basic remuneration paid after the initial remuneration had expired was 4.66 ct / kWh. Both decrease by 1.5% annually.
Ghost stream
In important wind energy markets such as Germany, payments by electricity consumers for electricity that are not produced are also made as compensation to the operators of wind turbines if installations had to be curtailed due to a lack of network capacity for the removal of electricity. The payments for this "ghost stream" amounted to EUR 364 million in the first quarter of 2019, after having been only EUR 228 million in the previous year. In the first quarter of 2019, 3.23 TWh (= billion kilowatt hours ) could not be fed into the power grid. This is 2.2% of the total electricity fed into Germany in the first quarter of 2019 (149.6 TWh)
Effects on the price of electricity
As a renewable energy, wind energy contributes to the merit order effect and lowers the electricity price on the exchange by displacing conventional power plants . However, the merit order effect does not take into account the long-term changes in the composition of the power plants, so that sustainable effects in relation to the electricity price cannot be unequivocally clarified by the said effect.
If a lot of electricity generated from wind energy is fed in on windy days, the wholesale price on the electricity exchange drops . If there is little wind energy available, the price on the electricity exchange rises. The electricity price reduction through wind energy arises from the statutory purchase obligation for generated wind power. If a lot of electricity from wind energy is available, the use of expensive conventional power plants, especially gas-fired power plants, is reduced (“ marginal cost theory”), which leads to a drop in prices on the electricity exchange. In 2007 this price-dampening effect amounted to approx. 5 billion euros. In the 2nd quarter of 2008, electricity on the Leipzig electricity exchange cost an average of 8.495 ct / kWh, a. due to the increased feed-in of renewable energies back to approx. 4 ct / kWh by 2012.
Avoidance of external costs
Compared to conventional forms of electricity generation, wind energy has significantly lower external costs . This is not about the current prices with influent damage effects by greenhouse gas emissions, air pollutants , etc., which for themselves. B. in climate change , health and material damage and agricultural yield losses. For coal-fired power plants , the external costs are in the range of 6 to 8 ct / kWh, for combined cycle power plants around 3 ct / kWh. Renewable energies are mostly below 0.5 ct / kWh, photovoltaics in the range of 1 ct / kWh. When these external costs are included, the total costs for wind power are significantly lower than for conventional energy generation and thus economic savings effects. Among other things, wind turbines in Germany avoided greenhouse gas emissions of 71.2 million tons of carbon dioxide equivalent in 2017 .
In 2011, renewable energies saved around 9.1 billion euros in external costs in Germany. However, since the measurement of external costs and benefits cannot be clearly quantified due to different methodologies, older studies with data no newer than 2004 came to different results.
Political and ecological aspects of today's use
sustainability

Wind energy is one of the most environmentally friendly , clean and safest energy resources. In the scientific literature, their use is counted among the most environmentally friendly forms of energy generation - also compared to other regenerative energies . Like other types of energy generation, wind power generation is also associated with interventions in the environment, but with wind energy these are minor, easy to control and occur exclusively locally. Compared to the environmental impact of conventional energy generation, they are negligible.
Like other renewable energies, the energy of the wind is available indefinitely according to human judgment and is therefore permanently available in contrast to fossil fuels and nuclear fuels . The use of wind energy also creates almost no environmental pollution as a result of pollutant emissions , which means that wind energy is seen as an important component of the energy transition and a sustainable and environmentally friendly economy. Since it is available worldwide and in abundance at the same time and its conversion is comparatively inexpensive, it is assumed that it will provide the majority of the energy required in a future regenerative energy system together with photovoltaics .
Due to its very low CO 2 emissions of approx. 9.4 g / kWh, it is also an important tool in the fight against global warming . In addition, there are no risks of large or extremely large environmental damage with wind energy, as with nuclear energy as a result of serious accidents . Over 20 years of operation, a 5 MW system delivers a total of 200 million kWh of green electricity at 2,000 full load hours per year, which can save 120,000 tons of carbon dioxide.
Proponents of wind energy expect more fairness from its use, since in this way, especially against the background of rising prices for fossil fuels, even states without energy resources could achieve a higher degree of self-sufficiency and even self-sufficiency in energy supply.
Modern wind turbines have a short energetic amortization period of just a few months.
The problem of recycling disused wind turbines has not yet been solved, as the existing capacities for the disposal of wind turbines are not sufficient for the quantities that will arise in the next few years and processes for recycling the rotor blades made of composite materials made of bonded glass and carbon fibers still have to be developed. According to a study published by the Federal Environment Agency, when the rotor blades are sawed, respirable substances are released that increase the risk of lung cancer, and the carbon fiber-reinforced composite materials used can only be burned under extreme conditions.
Space requirement

Energy generation from wind energy has a comparatively low space requirement overall . The surface sealing caused by the foundations is very low compared to conventional forms of energy generation. The reason for this is that the actual energy generation takes place at heights. Almost 99% of the area used by a wind farm can still be used for its original purposes. Agricultural areas are mostly chosen as the location . In Germany around 95% of all wind turbines are on agricultural land, 3.3% are in wooded or forest areas and 1.5% are in other locations.
For a modern wind power plant, it is assumed that around 0.4 ha (4,000 m²) will be used. The foundation area of modern systems of the 3 MW class is approx. 350–500 m², the largest currently installed wind turbines of the Enercon E-126 type have an output of 7.6 MW with a foundation area of approx. 600 m². In addition, when using a mobile crane, there is the crane floor space with an area consumption of around 0.3 ha, which is permanently maintained during operation of the system. Crane parking areas are mostly graveled, which means that they remain permeable to water and do not contribute to the soil sealing. If a tower crane is used to erect the system, the space required for the assembly of the crane and the wind turbine is reduced to around 0.12 hectares temporarily an area of 0.2–0.3 ha required for storage and possibly pre-assembly of system parts.
In total, the area used by wind turbines in Germany in 2011 was around 100 km². For comparison: The land consumption of German lignite opencast mines was more than 2300 km² as of 2006, with more than 300 settlements for lignite mining abandoned and around 100,000 people resettled . The share of lignite in German electricity consumption in 2017 was roughly 1.5 times that of wind power generation. Assuming an electricity production of 6–8 million kWh per year and an area consumption of 4,000 m², which are typical values for a modern inland system of the 3 MW class, the result is an electricity yield of 1,500–2,000 kWh per m² total area per Year. The area yield is significantly higher at strong wind locations. For comparison: Using energy maize as a substrate for biogas plants results in usable biomethane yields of approx. 45 MWh per hectare or 4.5 kWh per m² and year. About 35–40% of this can be converted into electricity in a biogas plant.
Workplace numbers

Wind energy technology requires a multiple number of jobs compared to conventional power plants with the same amount of electricity being generated. Compared to coal-fired power plants that are operated with imported hard coal , the number of jobs per generated kWh is higher by a factor of 4, compared to nuclear power plants by a factor of around 10.
Around 1,148,000 people were employed in the wind energy industry worldwide in 2017. In Germany, the number of jobs rose from a little over a hundred thousand in 2011 to around 149,000 in 2014, around 130,500 of them in onshore and around 18,700 in offshore wind energy. In 2015, around 80 percent of these jobs were in production and 20 percent in operation and maintenance. In addition to production sites, cities and municipalities in which service providers and suppliers are located also participate in the added value. According to a study by the 'Society for Economic Structural Research' (GWS), the employment effects extend to all federal states, not just to the centers of expansion, which are predominantly located in northern Germany.
In 2016, a total of 161,000 people were employed in the wind energy industry in Germany. With the collapse of the German wind energy market, this number fell by 26,000 jobs in 2017, according to IG Metall, and by a further 8,000 to 10,000 jobs from 2018 to mid-2019.
social acceptance
A large majority of the population supports the use of wind energy, even in regions without wind turbines, as international surveys have shown (Germany, Switzerland, USA). In the past, nonetheless, citizens' initiatives against planned projects were occasionally founded .
There is greater resistance in Germany from the government side, see below .
Health risks
The rotation of the rotors generates noises in the audible frequency range as well as in the infrasound range .
The audible noise of the wind turbines is described as "uneven, but permanent sound emissions", which are perceived as annoying, especially at night when traffic noise and other noises are weaker. In a study by psychologists from the University of Halle-Wittenberg , around 10% of the residents surveyed reported physical and psychological complaints. These ranged from difficult falling asleep to less deep sleep to negative mood or emotional discomfort. When the survey was repeated after two years, only 6.8% of the respondents suffered from specific symptoms, as many residents put up with the noises of the wind farm. A good quarter of those affected closed their windows at night so as not to be disturbed by the noises.
The WHO recommends that the upper limit for noise emissions from wind turbines should not exceed an average of 45 decibels during the day, as noise "above this value is associated with harmful health effects". The WHO does not issue a recommendation for maximum nighttime exposure, as there are not yet enough conclusive studies for this. The limit value in Germany is currently 50 decibels during the day.
Infrasound is sound with frequencies below 20 Hertz . These low frequencies are considered inaudible, but there are indications that infrasound can still be harmful to health. In a series of tests at Johannes Gutenberg University Mainz, a clear reduction in cardiac muscle strength was observed when exposed to infrasound signals. Scientists at the University Medical Center Hamburg-Eppendorf found that infrasound activates certain regions of the brain, which can potentially lead to stress.
Environmental impact
The ecological consequences of wind power, especially for birds, bats and insects, have been known for a long time, but have hardly been researched scientifically. Studies have only recently shown that the effects are more massive than expected. In the four northern German federal states alone, more than 8500 buzzards die every year from wind power plants, which corresponds to almost 8% of the total population in these states. In Germany, 250,000 bats are killed every year by the rotors, as the negative pressure in the vicinity of the rotating rotors causes barotrauma . An estimate by the German Aerospace Institute assumes that 1200 tons of insects die every year in Germany from wind turbines. This value is put in relation to the estimated 400,000 tons of insects that are eaten by birds every year by the nature conservation association NABU . On the other hand, the board of directors of the German Wildlife Foundation warns that among the 1200 tons there are predominantly females (shortly before laying eggs, they seek high, fast air currents to allow themselves to be carried by the wind to breeding grounds far away), each of which could have laid up to 1000 eggs and wind turbines can "significantly decimate the next generation".
Since a wind power plant generates electricity from the energy of the wind, the wind behind the plant must have less energy content than in front of it. A wind turbine always casts a slipstream on the leeward side (leeward side). Behind the system there is always a wake effect, a turbulent wind tail with a lower speed compared to the wind in front of the system. This creates currents and eddies.
Wind farms mix the lower layers of the air, which leads to local warming, especially at night. A study based on a scenario that the USA covers all current electricity needs from wind power comes to the conclusion that this would heat the air 2 m from the earth's surface in the USA by an average of 0.24 ° C . In addition to the direct mixing effect, the increase in the vertical gradient of the wind speed was named as the cause, which leads to increased turbulence. In contrast to the global warming caused by greenhouse gases, there is no increase in the thermal energy in the atmosphere, but a redistribution of already available energy. In the long term, this warming of the near-surface air layer would be put into perspective at the same time as the cooling due to lower carbon dioxide emissions. Overall, the climatic effects of wind energy are not necessarily negligible, but small compared to burning fossil fuels . At the same time, wind energy "per unit of energy gained in any reasonable unit of long-term environmental impact" does better than fossil fuels.
international Developement

Global statistics
| space | Country | Power in MW |
|---|---|---|
| 1 | China | 188,232 |
| 2 | United States | 89,077 |
| 3 | Germany | 56,132 |
| 4th | India | 32,848 |
| 5 | Spain | 23,170 |
| 6th | Great Britain | 18,872 |
| 7th | France | 13,759 |
| 8th | Brazil | 12,763 |
| 9 | Canada | 12,239 |
| 10 | Italy | 9,479 |
| 11 | Turkey | 6,857 |
| 12 | Sweden | 6,691 |
| 13 | Poland | 6,397 |
| 14th | Denmark | 5,476 |
| 15th | Portugal | 5,316 |
| 16 | Australia | 4,557 |
| 17th | Netherlands | 4,341 |
| 18th | Mexico | 4,005 |
| 19th | Japan | 3,400 |
| 20th | Ireland | 3.127 |
| - | Austria | 2,828 |
| Worldwide | 539,581 | |
| of which Europe | 178.096 | |
| of which EU | 169.319 |
Internationally, the People's Republic of China, USA, Germany, India and Spain are in the top five places in terms of installed capacity. At the end of 2017, Austria was outside the top 20 with 2828 MW, while Switzerland has so far only had low wind energy output. In 2017, wind energy covered more than 10% of the electricity demand in at least 13 countries. In the EU, too, the proportion was above this value at approx. 11.6%, with a total of 8 EU member states being above the average. Denmark had the highest share of wind power with 43.4% . Uruguay showed particularly rapid growth, increasing the share of wind power from 6.2 to 26.3% in just three years.
The capacity installed worldwide at the end of 2017 has an electricity generation potential that corresponds to 5.6% of world electricity consumption. The standard energy capacity of the approximately 142 GW installed in the EU at the end of 2015 is 315 TWh in an average year, corresponding to 11.4% of the EU's electricity requirements.
In Germany, Denmark and Spain there has been a steady development of wind energy based on political will for years. This has led to the development of a new industry in these three states. In 2009 the leading manufacturers with locations in Germany still had a share of more than 36%, two years later the five largest Asian companies alone had a share of 36% in the world market. Overall, the ten top companies in the wind energy industry cover around 80% of global demand. Germany is one of the main exporters of wind turbines .
In 2017, 52,573 MW were newly installed worldwide, around 37% of which with 19,500 MW in the People's Republic of China.

Source: GWEC
Germany
historical development


Crucial for the boom in wind energy in the Federal Republic of Germany was the Electricity Feed Act of 1991, which obliged the electricity network operators to purchase the electricity generated. This promotion of technology entry into renewable energies was continued with restrictions by the Red-Green Federal Government, which existed from autumn 1998 to autumn 2005 , in 2000 in the Renewable Energy Sources Act (EEG). The law has so far guaranteed the operators of wind turbines fixed remuneration for the electricity fed in. The fixed price remuneration under the EEG has led to a strong expansion of the use of wind energy in the Federal Republic of Germany. At the end of 2003 around half of the total European wind energy capacity (28,700 MW) was installed in Germany, ten months later two thirds. In the meantime, other European countries have caught up, so that in 2017 the German share of European wind power output was only a good 31%.
The general allegation of subsidies against wind energy usually relates to EEG funding. The fact that transfers from the EEG are not subsidies within the meaning of the EC Treaty has been confirmed by the European Court of Justice (ECJ) in its decision of March 13, 2001 C-379/98. The EEG also does not meet the concept of subsidies according to Section 12 of the Stability and Growth Act. The economic effects of the EEG and subsidies are comparable or similar.
statistics
Nationwide
By the end of 2007, Germany had the highest installed capacity in the world with 22,247 MW; in 2008 it was exceeded by the USA and in 2010 by China. At the end of 2014, 38,215 MW of onshore wind power was installed in Germany, with an increase of 4,665 MW new installations in 2014 alone. 1044 MW were installed offshore, of which 523 MW were newly connected to the grid. By the end of 2017, the installed capacity had grown to 55,876 MW.
With Enercon , Siemens Windenergie , Senvion and Nordex , several wind turbine manufacturers have their headquarters in Germany, other companies active in the wind industry such as Vestas and General Electric operate plants in Germany. In 2010 the export share of the industry was 66%, the turnover in 2011 was over 10 billion euros.
In 2019, according to preliminary figures from the AG Energiebilanzen, wind energy delivered approx. 126.4 TWh of electrical energy, ahead of lignite (114.0 TWh), natural gas (91.3 TWh), nuclear energy (75.2 TWh) and hard coal ( 56.9 TWh) was the most important power source in Germany. Onshore wind turbines produced 101.8 TWh, offshore wind farms 24.6 TWh TWh. In total, power plants in Germany produced 611.5 TWh, of which 569.0 TWh were consumed domestically, the rest was exported to neighboring European countries. In percentage terms, the share of wind energy in electricity generation was around 21%, while lignite was around 19%. Up-to-date feed-in data (for Germany) for the years from 2011 onwards are freely accessible on the Internet.
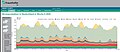
The previous wind power record is held in February 2020. In this exceptionally stormy month, according to preliminary data from the BDEW, wind power plants produced around 20.9 TWh of electrical energy, which is roughly equivalent to the annual electricity production of two nuclear power plants. At the same time, the previous wind power record of 16.5 TWh was exceeded by around 25%. Calendar week 8, in particular, was unusually strong, when wind energy covered more than 55% of German electricity demand (see graphics in the following gallery).
Performance (graphic)

Maximum and minimum benefits

Yield

Yield in numbers


| year | Gross electricity consumption in TWh | Onshore wind turbines | Offshore wind turbines | ||||||||
|---|---|---|---|---|---|---|---|---|---|---|---|
| Installed capacity in MW | Wind power generation in GWh | Share of gross electricity consumption in% | Avoided CO 2 emissions (in 1000 t CO 2 equivalent ) | Number of wind farms | Installed capacity in MW | Wind power generation in GWh | Share of gross electricity consumption in% | Avoided CO 2 emissions (in 1000 t CO 2 equivalent) | Number of wind farms | ||
| 2018 | 594.9 | 52,565 | 90,484 | 15.2 | 62,684 | 29,213 | 6,417 | 19,467 | 3.3 | 13,648 | 1,305 |
| 2017 | 601.3 | 50,292 | 88,018 | 14.6 | 59,130 | 28,675 | 5,427 | 17,947 | 3.0 | 12.111 | 1,169 |
| 2016 | 599.9 | 45.283 | 67,650 | 11.3 | 45.115 | 27,270 | 4.152 | 12,274 | 2.0 | 8,283 | 947 |
| 2015 | 600.0 | 41,297 | 72,340 | 12.1 | 48,243 | 25,980 | 3,283 | 8,284 | 1.4 | 5,591 | 792 |
| 2014 | 594.0 | 37,620 | 57.026 | 9.6 | 38,029 | 24,867 | 994 | 1,471 | 0.2 | 993 | 258 |
| 2013 | 606.6 | 32,969 | 51,819 | 8.5 | 34,688 | 23,645 | 508 | 918 | 0.2 | 622 | 116 |
| 2012 | 609.2 | 30,711 | 50,948 | 8.4 | 34,139 | 23,030 | 268 | 732 | 0.1 | 497 | k. A. |
| 2011 | 609.6 | 28,524 | 49,280 | 8.1 | 38.209 | 22,297 | 188 | 577 | 0.1 | 431 | k. A. |
| 2010 | 618.4 | 26,823 | 38,371 | 6.2 | 27,835 | 21,607 | 80 | 176 | 0.03 | 128 | k. A. |
| 2009 | 584.1 | 25,697 | 39,382 | 6.7 | 28,724 | 21,164 | 35 | 38 | 0.01 | 28 | k. A. |
| 2008 | 621.5 | 22,794 | 41,385 | 6.7 | 29,088 | 20,301 | 0 | 0 | 0 | 0 | k. A. |
| 2007 | 624.9 | 22,116 | 40.507 | 6.5 | 30,460 | 19,460 | 0 | 0 | 0 | 0 | k. A. |
| 2006 | 623.3 | 20,474 | 31,324 | 5.0 | 23,665 | 18,685 | 0 | 0 | 0 | 0 | k. A. |
| 2005 | 618.6 | 18,248 | 27,774 | 4.5 | 22,587 | 17,574 | 0 | 0 | 0 | 0 | k. A. |
| 2004 | 615.4 | 16,419 | 26,019 | 4.2 | 21,525 | 16,543 | 0 | 0 | 0 | 0 | k. A. |
| 2003 | 605.9 | 14,381 | 19,087 | 3.2 | 15,828 | 15,387 | 0 | 0 | 0 | 0 | k. A. |
| 2002 | 592.7 | 11,976 | 16.102 | 2.7 | 12,786 | 13,759 | 0 | 0 | 0 | 0 | k. A. |
| 2001 | 589.0 | 8,738 | 10,719 | 1.8 | 7,708 | 11,438 | 0 | 0 | 0 | 0 | k. A. |
| 2000 | 578.1 | 6.097 | 9,703 | 1.7 | 6,547 | 9,359 | 0 | 0 | 0 | 0 | k. A. |
| 1999 | 557.2 | 4,435 | 5,639 | 1.0 | 3,290 | k. A. | 0 | 0 | 0 | 0 | k. A. |
| 1998 | 555.3 | 2,877 | 4,579 | 0.8 | 2,371 | k. A. | 0 | 0 | 0 | 0 | k. A. |
| 1997 | 547.7 | 2,089 | 3,025 | 0.6 | 1,426 | k. A. | 0 | 0 | 0 | 0 | k. A. |
| 1996 | 550.4 | 1,549 | 2,073 | 0.4 | 1.006 | k. A. | 0 | 0 | 0 | 0 | k. A. |
| 1995 | 541.8 | 1,121 | 1,530 | 0.3 | 759 | k. A. | 0 | 0 | 0 | 0 | k. A. |
| 1994 | 531.1 | 618 | 927 | 0.2 | 460 | k. A. | 0 | 0 | 0 | 0 | k. A. |
| 1993 | 526.6 | 326 | 612 | 0.1 | 304 | k. A. | 0 | 0 | 0 | 0 | k. A. |
| 1992 | 531.6 | 174 | 281 | 0.1 | 139 | k. A. | 0 | 0 | 0 | 0 | k. A. |
| 1991 | 538.6 | 106 | 102 | 0.02 | 51 | k. A. | 0 | 0 | 0 | 0 | k. A. |
| 1990 | 549.9 | 55 | 72 | 0.01 | 36 | k. A. | 0 | 0 | 0 | 0 | k. A. |
Development in the individual federal states
Since the annual wind volume fluctuates, the German Wind Energy Institute DEWI uses a so-called 100% year (i.e. an average wind year according to the wind index ) as the calculation basis for calculating the wind energy shares by federal state .
| state | Number of wind turbines (as of June 30, 2017) |
Output in MW (as of June 30, 2017) |
Share of net electricity consumption in% (2016) |
|---|---|---|---|
| Baden-Württemberg | 613 | 1,161 | 2.0 |
| Bavaria | 1,127 | 2,414 | 4.4 |
| Berlin | 5 | 12 | 0.2 |
| Brandenburg | 3,669 | 6,531 | 64.1 |
| Bremen | 85 | 174 | 5.9 |
| Hamburg | 53 | 88 | 0.9 |
| Hesse | 1,043 | 1,832 | 7.0 |
| Mecklenburg-Western Pomerania | 1,873 | 3,186 | 86.4 |
| Lower Saxony | 6.015 | 9,855 | 32.5 |
| North Rhine-Westphalia | 3,447 | 4,906 | 5.8 |
| Rhineland-Palatinate | 1,659 | 3,300 | 17.4 |
| Saarland | 171 | 363 | 5.8 |
| Saxony | 889 | 1,185 | 9.6 |
| Saxony-Anhalt | 2,821 | 4,987 | 62.7 |
| Schleswig-Holstein | 3,628 | 6,630 | 87.8 |
| Thuringia | 816 | 1,399 | 20.1 |
| Germany onshore as a whole | 27,914 | 48,024 | 18.4 |

The construction of wind turbines in different federal states has various advantages. While z. For example, higher wind speeds tend to prevail in the northern German federal states, which has a positive effect on the profitability of wind energy, but the additional development of inland locations could have positive effects on energy security .
In 2012, the federal state of Schleswig-Holstein planned to cover 300% of its theoretical electricity needs with renewable energies from 2020 , most of it with wind energy. In January 2012, Lower Saxony planned to obtain 90% of its electricity from renewable sources by 2020, the majority of which is to be covered by onshore wind energy.
In North Rhine-Westphalia , the black and yellow state government increased the minimum distance for new wind turbines to the next building from 500 m to 1500 m in 2005. This almost brought the construction of new plants to a standstill. In July 2011 the red-green state government ( Cabinet Kraft I ) loosened provisions with a new wind energy decree that had slowed down the expansion of wind energy until then. The next state government was again black and yellow and increased to 1500 m.
In the southern German states of Baden-Württemberg and Bavaria, as well as Hesse , the expansion of wind energy was e.g. B. administratively hampered by very large exclusion areas and height restrictions for systems, so that the expansion of wind turbines remained low. In Bavaria, Prime Minister Seehofer demanded in 2013 a distance to the next settlement that was 10 times the height of the wind turbine; In 2014 the Bavarian State Parliament passed a law on this; the Bavarian Constitutional Court rejected a lawsuit by the opposition in May 2016.
Since the nuclear disaster in Fukushima at the latest , however, a rethink has begun, so that the expansion of wind energy is now being pushed in southern Germany as well. The now green and red state government of Baden-Württemberg lowered administrative hurdles with the "Wind Energy Decree Baden-Württemberg".
Offshore wind energy

The construction of offshore wind farms has been economically attractive in Germany since 2009 . The alpha ventus offshore wind park, developed as a commercial test object, was the first offshore wind park to go into operation in 2010. The Baltic 1 wind farm followed in 2011 . Only then did larger systems gradually go online. Overall, the expansion of offshore wind energy in Germany is only just beginning.
In 2015, a total of 546 new offshore wind turbines with a total output of 2,282.4 MW fed into the grid. In addition, 41 further wind turbines were built, the grid connection of which is still pending. At the end of 2015, a total of 792 offshore wind turbines with a total output of 3,294.9 MW were in operation. At the end of June 2019, 1,351 offshore wind turbines with grid feed-in and a total output of 6,658 MW were in operation, as well as 56 systems with 410 MW without previous grid feed-in.
| Status of offshore wind energy |
||||||||||||
|---|---|---|---|---|---|---|---|---|---|---|---|---|
| Number of wind farms | Power in MW | |||||||||||
| 2012 | 2013 | 2014 | 2015 | 2016 | 2019 | 2012 | 2013 | 2014 | 2015 | 2016 | 2019 | |
| Systems with grid feed | 68 | 116 | 258 | 792 | 947 | 1351 | 280.3 | 520.3 | 1,049 | 3,294.9 | 4,108.3 | 6,658 |
| Systems without grid feed | 103 | 285 | 41 | 21st | 56 | 394.6 | 1,303 | 246.0 | 122.7 | 410 | ||
| Installed foundations without a wind turbine | 109 | 282 | 220 | 122 | 198 | 94 | ||||||
Denmark

Denmark was u. a. the pioneer in the development of modern wind power technology due to its good wind conditions due to the geographic location of the country as well as the tradition of wind energy use, on which it was possible to build institutionally and technologically in the 1970s (see also the history of wind energy use ). From Denmark, the use of wind energy spread worldwide from the 1970s. The first feed-in law was introduced as early as 1981, guaranteeing wind power producers a fixed price per kWh and thus creating investment security. In 2012, the share of wind energy in Danish electricity consumption exceeded the 30% mark for the first time. According to the expansion plans of the Danish government, the share should be 50% by 2020. In 2019 wind power covered 47% of the Danish electricity demand. In 2015, when around 42% wind power was achieved, around 14.1 TWh of wind power was produced.
Denmark relies on both onshore wind energy and offshore wind energy. In contrast to Germany, where most offshore wind farms are planned to protect the Wadden Sea and out of concern for tourism issues far off the coast, the Danish wind farms are mainly to be found near the coast in shallow water. Major offshore wind farms are Horns Rev , Nysted and Anholt . In March 2013, the system output installed in offshore wind farms exceeded 1000 MW.
Japan
In Japan, like in Germany, there is a fixed tariff for renewable energies. Since July 1, 2012, the remuneration for electricity from wind turbines has been significantly more than in other countries at 23.1 yen per kWh (converted 24 cents in the reporting month of July 2012).
Austria
| state | Number of wind turbines | power |
|---|---|---|
| Burgenland | 446 | 1,090.0 MW |
| Carinthia | 2 | 1.3 MW |
| Lower Austria | 693 | 1,661.4 MW |
| Upper Austria | 30th | 47.3 MW |
| Salzburg | - | - |
| Styria | 100 | 237.4 MW |
| Tyrol | - | - |
| Vorarlberg | - | - |
| Vienna | 9 | 7.4 MW |
| Austria as a whole | 1.313 | 3,045 MW |
At the end of 2018, 1,313 wind turbines with a capacity of 3,045 MW were connected to the grid in Austria. In 2019, the total output is to be increased to 3,241 MW.
2014 was the strongest expansion year in Austria to date with an additional 411 MW of wind power output. Almost half of it (192 MW) was built in Burgenland. The Burgenland is therefore computationally self-sufficient power in March, 2013.
The total annual production of all wind turbines in Austria was around 7 TWh in 2017 . At that time, this corresponded to around 11 percent of Austria's total electricity demand.
In Oberzeiring in Styria , the Tauernwindpark was built in 2002 , which is Austria's highest wind farm to date at 1900 m above sea level. After a renovation in 2019, it comprises ten systems with a total output of 32 MW.
By far the greatest amount of wind energy is produced in Lower Austria . However, the expansion there has recently decreased significantly.
Portugal
At the end of 2017, Portugal had built up a wind power capacity of 5,313 MW (2015: 5,033 MW, 2016: 5,313 MW), which was based on 2,743 turbines in 257 wind farms and which in 2017 delivered energy of 12.3 TWh. Wind power accounted for 24% of the total power consumption.
Switzerland

In 1996, the Mont Crosin wind power plant in the canton of Jura was the first high-performance wind park in Switzerland; it was expanded to a capacity of 29 MW by 2013. The Gütsch wind farm is located on the Gütsch ob Andermatt at around 2300 m above sea level . Since 2012 it has had four turbines with a total output of 3.3 MW. The Gries wind farm is Europe's highest located wind farm and stands at around 2500 m above sea level at the Gries reservoir in the canton of Valais; there are four Enercon turbines with a total output of 9.3 MW.
With the introduction of the cost-covering feed-in tariff (KEV) in 2009, some extensions and new wind farms were created. At the end of 2017, a total of 37 systems with a total output of 75 MW were installed and connected to the grid in Switzerland. Since 2014, more than 100 GWh have been generated annually in Switzerland (2014: 100.9 GWh; 2015: 110 GWh; 2016: 108.6 GWh 2017: 132.6 GWh). In 2020 the BfE expects around 140 GWh.
The Federal Office for Energy (BfE) has published the Wind Atlas 2016 and the Wind Atlas 2019. The latter shows an average of 0.5 meters per second lower wind speeds than the 2016 Wiindatlas.
Spain

The development of modern wind energy use began in Spain in the mid-1990s when state subsidies were introduced. These were motivated by industrial policy, with the creation of new jobs in the foreground. In addition, the geographical conditions for wind power are favorable and resistance from the population due to the low population density is rare. Until 2006, Spain was second behind Germany in terms of installed capacity with 11,630 MW. Since then, more than 11 GW have been added, but this could not prevent China and the USA from overtaking the country in terms of installed capacity. In 2012, Spain ranked fourth worldwide with an installed capacity of 22.8 GW, making it one of the leading wind energy users. In 2011, wind turbines fed 41.8 TWh into the Spanish power grid.
According to preliminary figures from the grid operator Red Eléctrica de España , wind energy was the most important Spanish electricity producer in 2013. With a share of 21.1%, wind energy was just ahead of nuclear energy with 21.0%, coal power (14.6%) and large-scale hydropower (14.4%). The total production in Spain was 246.17 TWh. According to the wind power magazine Windpower Monthly, Spain is the first country in which wind energy ranks first in the generation statistics .
With Siemens Gamesa , one of the largest wind turbine manufacturers in the world is based in Spain. Iberdrola also advanced to become a leading global investor in the industry.
United States
After Denmark, the USA is the country that can look back on the longest history of modern wind power use. First support measures were decided in the late 1970s as a result of the oil crisis. As a result, an early wind energy boom set in in California in the early 1980s, where a state subsidy program was launched in addition to state subsidies. At the end of 2016, wind turbines with a capacity of 82.2 GW were installed in the USA. The expansion in 2017 was around 7 GW. In 2015, around 190 TWh of electricity were generated from wind energy.
Wind power plants - like other forms of renewable energies - are funded in the USA through Production Tax Credit ; the amount of this tax credit was 2.2 US cents / kWh in 2013. This runs (as of November 2016) until 2020. Although there are no offshore wind farms in the USA (as of 2013), wind turbines achieved a comparatively high capacity factor of 33% in 2011 , corresponding to around 3000 full load hours .
People's Republic of China

The People's Republic of China took the first steps towards modern use of wind energy as early as the 1980s, when Germanischer Lloyd was operating a test field in Inner Mongolia . In addition, with the support of subsidy programs, small wind turbines were delivered to China in order to promote the country's electrification there . However, these projects did not go beyond a niche function.
Since the mid-2000s, however, wind energy has been massively expanded in the People's Republic. At the end of 2006 only 2.6 GW were installed, until 2009 the capacity doubled annually (at the end of 2009 25 GW were installed). In 2010, 19 GW were added, which means that China accounted for around half of the world's additional capacity this year. 168.7 GW had been installed by the end of 2016; a good third of the installed capacity worldwide. The expansion in 2017 was 19.5 GW. Electricity production in 2015 was 186.3 TWh, which corresponds to around 3.3% of total Chinese production. This growth significantly exceeded the expectations of the twelfth five-year plan of 2011, in which an expansion to 200 GW by 2020 was planned. In 2016, the target was only raised to 250 GW and a moderate reduction in the feed-in tariffs was decided, as there are regional problems with network expansion.
literature
- Albert Betz : Wind energy and its use by windmills. Ökobuch, Kassel 1982, ISBN 3-922964-11-7 . (Reprint of the edition Vandenhoeck & Ruprecht, Göttingen 1926).
- Horst Crome: Handbook of wind energy technology. Ökobuch Verlag, ISBN 3-922964-78-8 .
- Robert Gasch , Jochen Twele (Hrsg.): Wind power plants. Basics, design, planning and operation. 9th, updated edition. Springer, Wiesbaden 2016, ISBN 978-3-658-12360-4 .
- Erich Hau: Wind turbines - basics, technology, use, economy. 5th edition. Springer, Berlin / Heidelberg 2014, ISBN 978-3-642-28876-0 limited preview in the Google book search.
- Siegfried Heier : Use of wind energy. 7th edition. Fraunhofer IRB Verlag, Stuttgart 2016, ISBN 978-3-8167-9587-2 .
- Siegfried Heier: Wind power plants: system design, grid integration and control. 5th edition. Vieweg / Teubner, Wiesbaden 2009, ISBN 978-3-8351-0142-5 .
- Nicole Hesse: Windwerkerei. Practices of wind energy use in the early German environmental movement . In: Technikgeschichte , ISSN 0040-117X , 83 (2016) H. 2, pp. 125–150.
- Matthias Heymann : The history of wind energy use 1890–1990. Campus-Verlag, Frankfurt am Main 1995, ISBN 3-593-35278-8 .
- Martin Kaltschmitt , Wolfgang Streicher, Andreas Wiese (eds.): Renewable energies. System technology, economy, environmental aspects . Springer Vieweg, Berlin / Heidelberg 2013, ISBN 978-3-642-03248-6 .
- Jens-Peter Molly: Wind energy: theory, application, measurement. 2., completely revised u. exp. Edition. Verlag CF Müller, Karlsruhe 1990, ISBN 3-7880-7269-5 .
- Mario Neukirch: The international pioneering phase of wind energy use , Diss. Göttingen 2010, uni-goettingen.de (PDF)
- Volker Quaschning : Regenerative Energy Systems. Technology - calculation - simulation. Hanser, Munich 2015, ISBN 978-3-446-44267-2 .
- Stefano Reccia, Daniel Pohl, Denise von der Osten: CleanTech study series. Volume 2: Wind Energy. German CleanTech Institute, Bonn 2009, ISBN 978-3-942292-02-3 .
- Alois Schaffarczyk (Ed.): Introduction to wind energy technology. Carl Hanser Verlag, Munich 2012, ISBN 978-3-446-43032-7 .
- Hermann-Josef Wagner , Jyotirmay Mathur: Introduction to wind energy systems. Basics, technology and operation. Springer, Berlin / Heidelberg 2013, ISBN 978-3-642-32975-3 .
- Viktor Wesselak , Thomas Schabbach , Thomas Link, Joachim Fischer: Handbuch Regenerative Energietechnik. 3rd, updated and expanded edition. Berlin / Heidelberg 2017, ISBN 978-3-662-53072-6 .
Web links
| Renewable energy |
|---|
- Slide show of the picture category Wind turbines in Germany
- "Wind energy" portal at the Renewable Energy Agency
- Federal WindEnergie Association (Germany)
- Wind Energy Promotion Agency (Germany)
- Federal Association of Small Wind Turbines (Germany)
- IG Windkraft (Austrian interest group for wind energy operators, manufacturers and promoters)
- EWEA: European Wind Power Association (English)
- Information on wind energy from the Federal Ministry for Economic Affairs and Energy
- Wind energy - information from the Federal Office for Energy (Switzerland)
- World Wind Energy Report 2012 ( Memento from October 20, 2013 in the Internet Archive ) (PDF; 3.1 MB) World Wind Energy Association
- Countries> Germany. In: The Wind Power database . The Wind Power, Michaël Pierrot, July 3, 2017, accessed on July 29, 2017 (wind energy database with installed capacities, wind farms, by region, manufacturer, images and other information).
- Konstantin Wiegandt: Current feed-in capacity of wind energy and solar energy in Germany. In: Feed-in statistics for solar and wind energy. Wind Journal, Konstantin Wiegandt, accessed July 29, 2017 . ;
- Konstantin Wiegandt: Fluctuations in wind energy feed-in in Germany. In: Feed-in statistics for solar and wind energy. Wind Journal, Konstantin Wiegandt, accessed on July 29, 2017 (wind energy feed-in in Germany from January 1, 2012).
- Power plants and wind power in Germany. (PDF; 2.6 MB) Federal Environment Agency, 2017, accessed on July 29, 2017 .
- www.windatlas.dk - Wind atlases of the world
Individual evidence
- ↑ a b GWEC: Over 60 GW of wind energy capacity installed in 2019, the second-biggest year in history . Press release from the Global Wind Energy Council. Retrieved March 25, 2020.
- ↑ a b c d ( page no longer available , search in web archives: Global Status Report 2018 ). REN21 website . Retrieved June 20, 2018.
- ↑ Viktor Wesselak , Thomas Schabbach , Thomas Link, Joachim Fischer: Handbuch Regenerative Energietechnik. Berlin / Heidelberg 2017, p. 6.
- ↑ ( Page no longer available , search in web archives: Statistical Review of World Energy 2017 ). BP website. Retrieved November 28, 2017.
- ^ Complete edition of the energy data - data collection of the BMWi. (XLS; 2.0 MB) Federal Ministry for Economic Affairs and Energy , January 16, 2019, accessed on April 22, 2019 .
- ↑ a b Klaus Heuck, Klaus-Dieter Dettmann, Detlef Schulz: Electrical energy supply: generation, transmission and distribution of electrical energy for study and practice. 9th edition. Vieweg + Teubner, Wiesbaden 2013, p. 43.
- ↑ Martin Kaltschmitt , Wolfgang Streicher, Andreas Wiese (ed.): Renewable energies. System technology, economy, environmental aspects . Berlin / Heidelberg 2013, p. 819.
- ↑ a b Piotr Michalak, Jacek Zimny: Wind energy development in the world, Europe and Poland from 1995 to 2009; current status and future perspectives . Renewable and Sustainable Energy Reviews 15, (2011), 2330-2341, p. 2330, doi: 10.1016 / j.rser.2011.02.008 .
- ↑ a b c Paolo Malanima : European Economic History 10-19. Century. UTB , Vienna / Cologne / Weimar 2010, ISBN 3825233774 , p. 97 f.
- ↑ Jens-Peter Molly: Wind energy in theory and practice. Basics and use. Karlsruhe 1978, p. 14.
- ^ Vaclav Smil : Energy in World History. Westview Press 1994, p. 112.
- ↑ Michael Mende: Early industrial drive technology - wind and water power. In: Ullrich Wengenroth (Hrsg.): Technology and economy. VDI-Verlag, Düsseldorf 1993, pp. 289-304, p. 291.
- ^ Hermann-Josef Wagner , Jyotirmay Mathur: Introduction to Wind Energy Systems Basics. Technology and Operation. Berlin / Heidelberg 2013, p. 1.
- ↑ Erich Hau: Wind turbines - basics, technology, use, economy. 5th edition. Springer, Berlin / Heidelberg 2014, p. 21.
- ↑ Nicola Armaroli , Vincenzo Balzani , Energy for a sustainable world. Weinheim 2011, p. 235.
- ^ Zhen-Yu Zhao et al .: Development route of the wind power industry in China . In: Renewable and Sustainable Energy Reviews , 34, (2014), 1–7, p. 2 doi: 10.1016 / j.rser.2014.01.071 .
- ^ Sanjay Kumar Kar, Atul Sharma: Wind power developments in India . In: Renewable and Sustainable Energy Reviews 48, (2015), 264–275, p. 265, doi: 10.1016 / j.rser.2015.03.095
- ↑ a b c d e f g Global Wind Statistics 2017. (PDF; 715 kB) In: Global Status of Wind Power - Global statistics. Global Wind Energy Council, February 14, 2018, accessed February 17, 2018 .
- ↑ Wind electricity production to hit 2,800TWh by 2035 . In: Windpower Monthly , November 12, 2013. Retrieved November 12, 2013.
- ↑ Two methods for estimating limits to large-scale windpower generation (PDF; 1.3 MB). Max Planck Institute for Biogeochemistry . Retrieved February 15, 2019.
- ↑ Kate Marvel, Ben Kravitz, Ken Caldeira: Geophysical limits to global wind power . In: Nature Climate Change , 3, 2013, pp. 118–121, doi: 10.1038 / nclimate1683
- ↑ X. Lu u. a .: Global potential for wind-generated electricity . In: PNAS . tape 106 , no. 27 , 2009, p. 10933-10938 , PMID 19549865 .
- ^ MRV Maria, Mark Z. Jacobson : Investigating the Effect of Large Wind Farms on Energy in the Atmosphere. In: Energies . 2009, 2, pp. 816–838, doi: 10.3390 / en20400816 “Should wind supply the world's energy needs, this parameterization estimates energy loss in the lowest 1 km of the atmosphere to be ~ 0.007%. This is an order of magnitude smaller than atmospheric energy loss from aerosol pollution and urbanization, and orders of magnitude less than the energy added to the atmosphere from doubling CO 2 . Also, the net heat added to the environment due to wind dissipation is much less than that added by thermal plants that the turbines displace. "
- ↑ ( Page no longer available , search in web archives: Potential atlas Renewable Energies . ) (PDF; 7.5 MB; 34 pages) accessed on June 11, 2013.
- ↑ Potential of wind energy on land. Study to determine the nationwide area and power potential of wind energy use on land (PDF; 5.1 MB). Fraunhofer Institute for Wind Energy and Energy System Technology on behalf of the Federal Environment Agency. Retrieved June 13, 2013.
- ↑ Potential of wind energy use on land. (PDF; 2.2 MB) Bundesverband WindEnergie eV , May 2011, accessed on February 9, 2020 .
- ↑ Numbers and facts - statistical indicators for the wind energy success story. Bundesverband WindEnergie eV , March 2019, accessed on February 9, 2020 .
- ↑ Volker Berkhout, Stefan Faulstich, Philip Görg, Paul Kühn, Katrin Linke, Philipp Lyding, Sebastian Pfaffel, Khalid Rafik, Kurt Rohrig, Renate Rothkegel, Elisabeth Stark: Windenergie Report Deutschland 2012 . Fraunhofer Institute for Wind Energy and Energy System Technology , Kassel 2013, ISBN 978-3-8396-0536-3 , p. 22 ( fraunhofer.de [PDF; accessed on November 1, 2013]). Wind Energy Report Germany 2012 ( Memento from September 28, 2013 in the Internet Archive )
- ↑ a b Kaspar, F., Borsche, M., Pfeifroth, U., Trentmann, J., Drücke, J., Becker, P .: A climatological assessment of balancing effects and shortfall risks of photovoltaics and wind energy in Germany and Europe , Adv. Sci. Res., 16, 119-128, 2019; DOI: 10.5194 / asr-16-119-2019
- ^ Matthias Günther: Energy efficiency through renewable energies. Possibilities, potentials, systems . Wiesbaden 2015, p. 130.
- ↑ See expert opinion on market design, procurement costs and billing of control power and control energy by the German transmission system operators. (PDF) In: BET Aachen. Retrieved April 12, 2014 .
- ↑ Alois Schaffarczyk (Ed.): Introduction to wind energy technology. Munich 2012, p. 399.
- ↑ Fossil-fired large power plants in Germany. (PDF) (No longer available online.) In: VDI Status Report 2013 . Archived from the original on July 30, 2014 ; Retrieved April 13, 2014 .
- ^ NREL Calculates Emissions and Costs of Power Plant Cycling Necessary for Increased Wind and Solar in the West . ( Memento from September 27, 2013 in the Internet Archive ) National Renewable Energy Laboratory . Retrieved September 26, 2013.
- ↑ dena network study ( memento of September 28, 2013 in the Internet Archive ) (PDF; 7.0 MB) dena. Retrieved September 26, 2013.
- ^ Christian M. Grams et al .: Balancing Europe's wind power output through spatial deployment informed by weather regimes. Nature Climate Change 7, 2017, doi: 10.1038 / nclimate3338 . PMC 5540172 (free full text).
- ^ A b Nicola Armaroli , Vincenzo Balzani : Towards an electricity-powered world . In: Energy and Environmental Science 4, 2011, pp. 3193-3222, p. 3217, doi: 10.1039 / c1ee01249e .
- ↑ Mathew Aneke, Meihong Wang: Energy storage technologies and real life applications - A state of the art review. Applied Energy 179, 2016, doi: 10.1016 / j.apenergy.2016.06.097 ( free full text ).
- ↑ Wind Energy Report Germany 2013. (PDF) (No longer available online.) In: Fraunhofer IWES . Archived from the original on April 13, 2014 ; Retrieved April 12, 2014 .
- ↑ Erich Hau: Wind turbines - basics, technology, use, economy. 5th edition. Springer, Berlin / Heidelberg 2014, chap. 8th.
- ↑ Paul Donohoo-Vallett et al .: Revolution Now ... The Future Arrives for Five Clean Energy Technologies - 2016 Update . United States Department of Energy . Retrieved November 6, 2016.
- ↑ a b c Fraunhofer ISE: Study of electricity generation costs for renewable energies March 2018 . Retrieved August 10, 2018.
- ↑ Erich Hau: Wind turbines - basics, technology, use, economy. 5th edition. Springer, Berlin Heidelberg 2014, p. 854.
- ↑ a b Manish Ram et al .: A comparative analysis of electricity generation costs from renewable, fossil fuel and nuclear sources in G20 countries for the period 2015-2030 . In: Journal of Cleaner Production . tape 199 , 2018, p. 687–704 , doi : 10.1016 / j.jclepro.2018.07.159 .
- ↑ Viktor Wesselak , Thomas Schabbach , Thomas Link, Joachim Fischer, Regenerative Energietechnik , Berlin / Heidelberg 2013, p. 25.
- ↑ Robert Gasch , Jochen Twele (Ed.): Wind power plants. Basics, design, planning and operation . Springer, Wiesbaden 2013, p. 569.
- ↑ Jörg Böttcher (Ed.): Handbook Wind Energy. Onshore projects: Realization, financing, law and technology , Munich 2012, p. 29.
- ↑ Erich Hau: Wind turbines - basics, technology, use, economy. 5th edition. Springer, Berlin Heidelberg 2014, p. 929.
- ↑ The cost situation of onshore wind energy in Germany ( Memento of November 13, 2013 in the Internet Archive ) (PDF; 3.8 MB). Study by the Deutsche Windguard. Retrieved November 13, 2013.
- ↑ Wind Innovations Drive Down Costs . Bloomberg LP.Retrieved May 2, 2013.
- ^ Australian Wind Energy Now Cheaper Than Coal, Gas, BNEF Says . Bloomberg. Retrieved February 7, 2013.
- ↑ Lynn Doan, Brian Eckhouse, Christopher Cannon, Hannah Recht: What's Behind the World's Biggest Climate Victory? Capitalism. In: bloomberg.com. Bloomberg, September 15, 2019, accessed June 1, 2020 .
- ^ Neilton Fidelis da Silva et al .: Wind energy in Brazil: From the power sector's expansion crisis model to the favorable environment. In: Renewable and Sustainable Energy Reviews , 22, (2013), pp. 686-697, 694, doi: 10.1016 / j.rser.2012.12.054 .
- ↑ Robert Gasch, Jochen Twele (Ed.): Wind power plants. Basics, design, planning and operation . Springer, Wiesbaden 2013, p. 11.
- ↑ a b Robert Gasch, Jochen Twele (Ed.): Wind power plants. Basics, design, planning and operation . Springer, Wiesbaden 2013, p. 11 f.
- ↑ wirtschaftsblatt.at: Electricity price explosion blows wind power into economic plus ( memento from September 23, 2008 in the Internet Archive )
- ↑ EEG remuneration overview for the start-up year 2017 ( page no longer available , search in web archives ) Info: The link was automatically marked as defective. Please check the link according to the instructions and then remove this notice. (PDF) VBEW. Retrieved May 1, 2017.
- ↑ Daniel Wetzel: Never produced, but paid for: The “Geisterstrom” reveals the insanity of the energy transition . August 8, 2019 ( welt.de [accessed September 5, 2019]).
- ↑ agrarheute.com: 3.2 billion kilowatt hours of ghost electricity from wind power
- ↑ Stat. Federal office destatis, 2019, power generation in the 2nd quarter of 2019. https://www.destatis.de/DE/Presse/Pressemitteilungen/2019/06/PD19_235_43312.html
- ^ Lorenz Jarass, Gustav M. Obermair, Wilfried Voigt: Wind energy. Reliable integration into the energy supply. Berlin / Heidelberg 2009, p. 104.
- ^ Lorenz Jarass, Gustav M. Obermair, Wilfried Voigt: Wind energy. Reliable integration into the energy supply. Berlin / Heidelberg 2009, p. 158 f.
- ↑ a b c Time series on the development of renewable energies in Germany . BMWI website. Retrieved June 19, 2018.
- ↑ ( page no longer available , search in web archives: BEE annual figures for renewable energies ) (PDF; 56 kB). Federal Association for Renewable Energies. Retrieved May 12, 2012.
- ↑ Wolfram Krewitt, Barbara Schlomann: External costs of electricity generation from renewable energies compared to electricity generation from fossil fuels ( Memento of October 13, 2006 in the Internet Archive ) (PDF; 441 kB). DLR and Fraunhofer Society, 2006.
- ↑ GM Joselin Herbert, S. Iniyan, D. Amutha: A review of technical issues on the development of wind farms . In: Renewable and Sustainable Energy Reviews , 32, (2014), pp. 619–641, 619 doi: 10.1016 / j.rser.2014.01.055 .
- ↑ a b Mehmet Biligili et al .: offshore wind power development in Europe and its comparison with onshore counterpart . In: Renewable and Sustainable Energy Reviews . tape 15 , no. 2 , 2011, p. 905-915 , doi : 10.1016 / j.rser.2010.11.006 .
- ^ Fulvio Ardente, Marco Beccali, Maurizio Cellura, Valerio Lo Brano: Energy performances and life cycle assessment of an Italian wind farm . In: Renewable and Sustainable Energy Reviews , 12 (2008), pp. 200-217, 214. doi: 10.1016 / j.rser.2006.05.013
- ^ Sarah Becker, Bethany A. Frew, Gorm B. Andresen, Timo Zeyer, Stefan Schramm, Martin Greiner, Mark Z. Jacobson: Features of a fully renewable US electricity system: Optimized mixes of wind and solar PV and transmission grid extensions . In: Energy 72, (2014), pp. 443–458, 443 doi: 10.1016 / j.energy.2014.05.067
- ↑ Francesco Asdrubali, Giorgio Baldinelli, Francesco D'Alessandro, Flavio Scrucca: Life cycle assessment of electricity production from renewable energies: Review and results harmonization. In: Renewable and Sustainable Energy Reviews 42, (2015), pp. 1113–1122, 1118, doi: 10.1016 / j.rser.2014.10.082 .
- ↑ Erich Hau: Wind turbines. Basics - technology - use - economy . Berlin / Heidelberg 2016, p. 693
- ↑ Cf. Alois Schaffarczyk (ed.): Introduction to wind energy technology. Munich 2012, p. 64.
- ↑ Volker Quaschning : Renewable energies and climate protection . 3. Edition. Hanser Verlag, Munich 2013, p. 239.
- ↑ Robert Gasch, Jochen Twele (Ed.): Wind power plants. Basics, design, planning and operation . Springer, Wiesbaden 2013, p. 8.
- ↑ Begoña Guezuraga, Rudolf Zauner, Werner Pölz: Life cycle assessment of two different 2 MW class wind turbines . In: Renewable Energy , 37, 2012, pp. 37-44, doi: 10.1016 / j.renene.2011.05.008
- ↑ Karl R. Haapala Preedanood Prempreeda: Comparative life cycle assessment of 2.0 MW wind turbines . In: International Journal of Sustainable Manufacturing , Vol. 3, No. 2, 2014, pp. 170-185, doi: 10.1504 / IJSM.2014.062496
- ↑ Wind turbine scrap: The 70,000-tonne problem of the energy transition Report by the daily DIE WELT of November 2, 2019, accessed on November 2, 2019
- ↑ Impending recycling bottleneck: The problem with disused wind turbines Report on Spiegel-Online from November 1, 2019, accessed on November 2, 2019
- ↑ Martin Kaltschmitt , Wolfgang Streicher, Andreas Wiese (ed.): Renewable energies. System technology, economy, environmental aspects . 5th edition. Berlin / Heidelberg 2013, p. 539 f.
- ↑ Matthias Popp: Storage requirements for a power supply with renewable energies. Dissertation. Berlin / Heidelberg 2010, p. 1.
- ^ Ziyad Salameh: Renewable Energy System Design . Academic Press, 2014, p. 164.
- ↑ Wind Energy Report Germany 2014 ( Memento from February 26, 2016 in the Internet Archive ) (PDF) Fraunhofer IWES . Retrieved May 4, 2015.
- ↑ a b Effects of renewable energies on the soil (PDF; 11.8 MB). Bavarian State Office for the Environment . Retrieved May 22, 2013.
- ↑ New assembly concept for wind turbines (PDF; 287 kB). Kranmagazin 84, 2012. Retrieved May 22, 2013.
- ↑ Energy policy 20 years after Chernobyl. Documentation of the conference "Chernobyl 1986-2006: Experiences for the future", p. 218 . Website of the Federal Environment Ministry. Retrieved August 10, 2018.
- ↑ Gross electricity generation in Germany from 1990 to 2017 by energy source. ((PDF)) Arbeitsgemeinschaft Energiebilanzen e. V., accessed on August 10, 2018 .
- ↑ Enercon goes z. For example, the E-126 assumes an annual electricity yield of 20 million kWh in good locations; the foundation area of this system is approx. 600 m². See Windblatt 01/2008 (PDF; 964 kB) Enercon. Retrieved May 22, 2013.
- ↑ Martin Kaltschmitt , Wolfgang Streicher (Ed.): Regenerative Energies in Österreich. Basics, system technology, environmental aspects, cost analyzes, potentials, use . Wiesbaden 2009, p. 487.
- ↑ Electricity Report: Gross employment in wind energy in Germany. Accessed on March 3, 2015.
- ^ Siegfried Heier , Use of Wind Energy. 7th updated edition, Bonn 2016, p. 21.
- ↑ a b Volker Quaschning : Regenerative Energy Systems. Technology - calculation - simulation . 8th updated edition. Munich 2013, p. 255.
- ↑ Number of employees in the offshore and onshore wind energy sector in Germany from 2010 to 2014 . Statista . Retrieved February 11, 2016.
- ↑ FAZ.net March 29, 2017: Jobs for Bavaria - straight from the sea
- ↑ Renewable employment in the federal states: Selected case studies and pilot modeling for onshore wind energy ( Memento from February 1, 2014 in the Internet Archive ) (PDF) Federal Ministry for the Environment; Retrieved January 18, 2014.
- ↑ IG Metall: Up to 10,000 jobs in the wind industry are gone . In: Wirtschaftswoche , September 4, 2019. Accessed September 4, 2019.
- ^ FA Wind: Survey on the acceptance of wind energy on land. Autumn 2019, Berlin.
- ↑ Suisse Eole: Acceptance - Satisfied residents in Switzerland.
- ↑ Joseph Rand, Ben Hoen: Thirty years of North American wind energy acceptance research: What have we learned? Energy Research & SocialScience 29, 2017, doi: 10.1016 / j.erss.2017.05.019 ( free full text ).
- ↑ Martin Kaltschmitt, Wolfgang Streicher, Andreas Wiese (ed.): Renewable energies . Springer-Verlag, Berlin / Heidelberg 2006, ISBN 978-3-540-28204-4 , power generation from wind energy, p. 536 , doi : 10.1007 / 3-540-28205-x ( springer.com [accessed on February 21, 2020 ]).
- ↑ Michael Gassmann: Loud wind turbines are bad for health . October 11, 2018 ( welt.de [accessed July 23, 2019]).
- ↑ The humming of the rotors: Noise pollution from wind turbines | Knowledge | SWR2. September 9, 2013, accessed July 23, 2019 .
- ↑ Wind turbines: How to reduce stress for residents. University of Halle-Wittenberg, January 24, 2018, accessed on July 23, 2019 .
- ↑ WHO report: Noise from wind turbines can make you sick . In: Spiegel Online . October 10, 2018 ( spiegel.de [accessed July 23, 2019]).
- ↑ Gernot Knödler: Windmill noise in the north: Sound and dispute . In: The daily newspaper: taz . May 23, 2019, ISSN 0931-9085 ( taz.de [accessed July 23, 2019]).
- ↑ Wind power in criticism: Infrasound: Unheard of noise. In: zdf.de. November 4, 2018, accessed July 23, 2019 .
- ↑ Wind energy and birds: "The number of victims is much higher than expected". In: Geo.de. July 18, 2019, accessed July 23, 2019 .
- ^ Deutsche Welle (www.dw.com): The hot line to the bat | DW | 07/14/2015. Retrieved on July 23, 2019 (German).
- ↑ Risky height? Tagesschau de, May 20, 2019
- ↑ Daniel Wetzel: Death on the wind turbine: Why this insect death leaves the minister strangely cold . April 25, 2019 ( welt.de [accessed July 23, 2019]).
- ↑ http://xn--drmstrre-64ad.dk/wp-content/wind/miller/windpower%20web/de/tour/wres/wake.htm Association of the Danish Wind Power Industry, accessed on January 23, 2020
- ↑ Lee M. Miller, David W. Keith: Climatic Impacts of Wind Power . In: Joule . tape 2 , 2019, p. 2618–2632 , doi : 10.1016 / j.joule.2018.09.009 .
- ↑ Wind in power. 2015 European statistics (PDF) EWEA. Retrieved February 11, 2016.
- ↑ China became top wind power market in 2009: consultant. on: reuters.com , March 29, 2010.
- ↑ ECJ decision of March 13, 2001 ( Memento of November 21, 2003 in the Internet Archive )
- ↑ Wind Energy Report Germany 2014. ( Memento from February 26, 2016 in the Internet Archive ) (PDF) Fraunhofer IWES.
- ↑ ( page no longer available , search in web archives: German wind industry - markets are recovering ). DEWI. Retrieved October 10, 2011.
- ↑ Gross electricity generation in Germany by energy source . AG energy balances. Retrieved January 4, 2020.
- ↑ The electricity production from coal fell sharply this year . In: Wirtschaftswoche , December 26, 2019. Retrieved January 4, 2020.
- ↑ Energy Charts . Fraunhofer ISE website . Retrieved July 5, 2015 .; EEX Transparency ( Memento from February 27, 2014 in the Internet Archive ). Up-to-the-minute information on the feed-in of wind and PV electricity in Germany.
- ↑ Wind power in February: "As much electricity as two nuclear power plants a year" . In: Euwid Neue Energie , February 28, 2020. Accessed February 29, 2020.
- ↑ Number of onshore wind turbines in Germany up to 2018. Accessed on October 11, 2019 .
- ↑ Number of offshore wind turbines in Germany up to 2018. Accessed on October 11, 2019 .
- ↑ a b Status of the onshore wind energy expansion in Germany ( page no longer available , search in web archives ) Info: The link was automatically marked as defective. Please check the link according to the instructions and then remove this notice. (PDF) German Windguard. Retrieved July 29, 2017.
- ↑ Use of wind energy in Germany. As of December 31, 2016 . Dewi-Magazin 50.Retrieved August 5, 2017.
- ^ Siegfried Heier , Use of Wind Energy. 7th updated edition, Bonn 2016, p. 18.
- ↑ coalition agreement 2012 . ( Memento from June 12, 2012 in the Internet Archive ) (PDF) Bündnis 90 / Die Grünen, p. 36; Retrieved June 4, 2012.
- ↑ Lower Saxony wants 90 percent green electricity . In: Göttinger Tageblatt , January 31, 2012.
- ↑ Decree of October 21, 2005 ( Memento of January 4, 2007 in the Internet Archive ) (PDF)
- ↑ February 6, 2011: Red-Green allows higher wind turbines
- ↑ Minister Remmel: NRW gives the green light for the expansion of wind energy. on: nrw.de , July 11, 2011.
- ↑ Ordinance amending the ordinance on the state development plan of July 12, 2019. Law and Ordinance Gazette (GV. NRW.) Edition 2019 No. 15, July 23, 2019, pp. 341–376.
- ^ Wieland Bögel: Headwind from the State Chancellery. on: sueddeutsche.de , June 21, 2013: "Seehofer: The distance should be at least ten times the height of the relevant wind turbine"
- ↑ Tailwind for the state government , Bayerischer Rundfunk. May 9, 2016. Archived from the original on October 12, 2017. Retrieved October 12, 2017.
- ↑ Press release May 9, 2016: Sog. 10 H-regulation for wind turbines essentially compatible with the Bavarian constitution ( page no longer available , search in web archives ) Info: The link was automatically marked as defective. Please check the link according to the instructions and then remove this notice. (Vf. 14-VII-14, Vf. 3-VIII-15, Vf. 4-VIII-15)
- ↑ The south discovers wind power. Zeit Online , August 20, 2012, accessed September 23, 2012 .
- ↑ Wind Energy Decree Baden-Württemberg ( Memento from June 20, 2012 in the Internet Archive ) (PDF). Ministry for the Environment, Climate Protection and the Energy Sector Baden-Württemberg . Retrieved September 23, 2012.
- ↑ Volker Quaschning : Regenerative Energy Systems. Technology - calculation - simulation . 8th updated edition. Munich 2013, p. 256.
- ↑ a b c Silke Luers, Knud Rehfeldt: Status of Offshore Wind Energy Expansion in Germany 2015. (PDF file; 451 kB) (No longer available online.) Deutsche Windgard, December 31, 2015, archived from the original on January 18, 2016 ; accessed on January 18, 2016 .
- ↑ a b c Status of the offshore wind energy expansion. (PDF; 1100 kB) In: Status of Offshore Wind Energy Expansion in Germany - First Half of 2019. Deutsche WindGuard GmbH, July 17, 2019, accessed on January 7, 2020 .
- ↑ a b Anna-Kathrin Wallasch: Status of wind energy expansion in Germany 2012. (PDF file; 694 kB) (No longer available online.) Deutsche Windgard, December 31, 2012, archived from the original on January 24, 2016 ; accessed on January 24, 2016 .
- ↑ a b Silke Luers: Status of offshore wind energy expansion in Germany 2013. (PDF file; 2.46 MB) (No longer available online.) Deutsche Windgard, December 31, 2013, archived from the original on January 24, 2016 ; accessed on January 24, 2016 .
- ↑ a b Silke Luers: Status of the offshore wind energy expansion in Germany 2014. (PDF file; 562 kB) (No longer available online.) Deutsche Windgard, December 31, 2014, archived from the original on January 24, 2016 ; accessed on January 24, 2016 .
- ↑ a b Status of offshore wind energy expansion in Germany 2016 ( Memento from February 11, 2017 in the Internet Archive ). Website of the Deutsche Windguard. Retrieved February 10, 2017.
- ↑ Wind energy passes 30% ( Memento from February 4, 2013 in the Internet Archive ). Danish Wind Energy Association. Retrieved February 1, 2013.
- ↑ Denmark sources record 47% of power from wind in 2019 . In: Reuters , January 2, 2020. Retrieved January 4, 2020.
- ↑ Data: Record year for Danish wind power . In: Windpower Monthly , January 27, 2016. Retrieved January 27, 2016.
- ↑ Alois Schaffarczyk (Ed.): Introduction to wind energy technology. Munich 2012, p. 434.
- ↑ Denmark clears 1GW offshore mark . In: Windpower Monthly , March 18, 2013. Retrieved March 21, 2013.
- ^ Report in the magazine Photon , August 2012, p. 22.
- ↑ a b c Wind energy in Austria. In: windffekten.at. IG Windkraft Österreich, accessed on March 14, 2019 .
- ↑ IG Windkraft: Burgenland on the way to self-sufficiency. IG Windkraft Österreich, accessed on August 10, 2018 .
- ↑ Oberzeiring wind farm is officially opened high on the mountain. IG Windkraft Österreich, accessed on September 16, 2019 .
- ↑ Information on the wind farm and the existing photovoltaic system. (PDF) IG Windkraft Österreich, accessed on September 16, 2019 .
- ↑ Lower Austria is the front runner in wind power. ORF NÖ , January 17, 2018, accessed on January 17, 2018 .
- ↑ 2018 brought a further decline in the expansion of wind power in Lower Austria. IG Windkraft Österreich, accessed on September 16, 2019 .
- ↑ a b c Wind Energy in Portugal. In: Member Activities. IEA Wind TCP, accessed April 23, 2019 .
- ↑ 35 Portugal Table 1. Key National Statistics 2015: Portugal ( Memento from July 30, 2017 in the Internet Archive ) (PDF; 467 kB)
- ↑ Location: Mt. Crosin. on: Wind energy data for Switzerland
- ↑ Swiss overall energy statistics 2014, Federal Office of Energy ( Memento from December 28, 2014 in the Internet Archive ) Table 31, published on July 14, 2015.
- ↑ Statistics (CH / International). In: wind energy. Suisse Eole - Association for the Promotion of Wind Energy in Switzerland, accessed on February 17, 2018 .
- ↑ Switzerland. In: Wind facts. Suisse Eole, 2018, accessed February 17, 2018 .
- ↑ Switzerland. In: Wind facts. Suisse Eole, 2019, accessed April 23, 2019 .
- ↑ Wind Atlas Switzerland
- ↑ Wind Atlas Switzerland
- ↑ nzz.ch: New numbers show less wind than expected - but the proponents of wind power defend their plans
- ↑ a b Alois Schaffarczyk (Hrsg.): Introduction to wind energy technology. Munich 2012, p. 80.
- ↑ Where the wind turbines are welcome . In: Badische Zeitung , December 17, 2009. Retrieved October 20, 2013.
- ↑ World Wind Energy Report 2012 ( Memento from October 20, 2013 in the Internet Archive ) (PDF; 3.1 MB). WWIndea. Retrieved October 19, 2013.
- ↑ Installed wind energy capacity in Spain reached 21,673 MW in 2011 . EVWind. Retrieved October 19, 2013.
- ↑ Wind is Spain's biggest power generator in 2013 . In: Windpower Monthly , December 24, 2013. Retrieved December 28, 2013.
- ↑ Cf. Matthias Heymann : The history of the use of wind energy 1890–1990 . Frankfurt am Main 1995, pp. 393-405.
- ↑ New wind power record in the USA . In: IWR , April 12, 2016. Retrieved April 12, 2016.
- ↑ handelsblatt.com November 23, 2016: Trump rages against German wind power
- ↑ American Wind Energy Association (AWEA): Is Class 2 the new Class 5? Recent Evolution in Wind Power Technology and Implications for New England ( page no longer available , search in web archives ) Info: The link was automatically marked as defective. Please check the link according to the instructions and then remove this notice. (PDF). Retrieved February 15, 2013.
- ↑ Similar PDF ( Memento from August 9, 2014 in the Internet Archive ) (2012)
- ↑ Alois Schaffarczyk (Ed.): Introduction to wind energy technology. Munich 2012, p. 79.
- ↑ World Wind Energy Report 2010. ( Memento from July 2, 2014 in the Internet Archive ) (PDF; 3.1 MB) of the World Wind Energy Association, accessed in March 2012.
- ↑ China's new wind power capacity rises 60%, hits record high . In: China Daily , March 2, 2016. Retrieved April 12, 2016.
- ↑ China stabilizes the global wind market . In: IWR.de. February 4, 2011. Retrieved September 17, 2011.
- ↑ Wolfgang Pomrehn: Wind energy: On course for growth . Telepolis, May 7, 2016.
- ^ Liming Qiao: Another Strong Year for China's Wind Industry . Renewable Energy World, October 11, 2016.