Riverside County
 Riverside County Courthouse |
|
| administration | |
|---|---|
| US state : | California |
| Administrative headquarters : | Riverside |
| Foundation : | 1893 |
| Made up from: |
San Bernardino County San Diego County |
| Demographics | |
| Residents : | 2,189,641 (2010) |
| Population density : | 117.3 inhabitants / km 2 |
| geography | |
| Total area : | 18,915 km² |
| Water surface : | 248 km² |
| map | |
| Website : www.countyofriverside.us | |
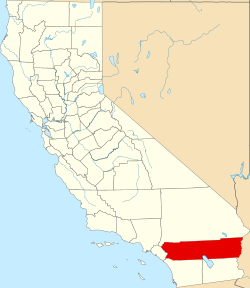
The Riverside County is a county in the southeastern part of California . The county seat is Riverside . Together with San Bernardino County , it forms the Inland Empire metropolitan area east of Los Angeles .
geography
Geographically, the county consists almost entirely of desert, only in the west there is a Mediterranean climate . On the other hand, most of Joshua Tree National Park is also in the county. The county is popular with commuters working in Los Angeles and San Diego , primarily because of the low cost of land . Together with San Bernardino County , Riverside County forms the Inland Empire , also known regionally as IE
Riverside County is bordered to the southeast by Imperial County , to the southwest by San Diego County , to the west by Orange County , to the north by San Bernardino County and to the east by La Paz County in Arizona . The distance from the easternmost to the westernmost point of the county is approximately 290 kilometers. The entire state of New Jersey is roughly the same area as Riverside County. The travel time from the administrative center of Riverside to the easternmost town of Blythe was stated by the administration to be three hours in official documents. The eastern county boundary is the Colorado River .
With 2,189,641 inhabitants (as of the 2010 census ) and an area of 18,915 km², of which 18,667 km² are land, the population density is 117.3 inhabitants per square kilometer. Riverside County has the fourth highest population of the 58 counties in California and is one of the fastest growing areas in the state in the observation period 1960 to 2010. There are extensive housing developments around the capital, Riverside, and on Interstates 10 , 15 and 215 .
The county is often divided into individual regions by the population, so the Inland Empire often only includes the area west of the San Gorgonio Pass , while the western part of the county is included in the Mojave or Colorado desert . However, the county can be broken down in many ways due to its size and geographic diversity.
The centrally located Coachella Valley is best known for vacation and recreation spots like Palm Springs , Palm Desert , Indian Wells , La Quinta , Rancho Mirage and Desert Hot Springs . Most recently, however, it has been especially the locations in western county that have seen rapid growth as many commuters in the Los Angeles area have settled here in search of affordable housing. The Southwest has also seen a significant influx of people from the metropolitan area of San Diego – Tijuana . The cities of Murrieta and Temecula there were responsible for 20% of the population growth between 2000 and 2007.
places
Cities
| name of the city | Population (2010) | surface | height | median household income (2008–2012) | Preservation of the town charter (incorporation) |
|---|---|---|---|---|---|
| Banning | 29,603 | 59.826 km² | 716 m | $ 38,919 | 1913 |
| Beaumont | 36,877 | 80.098 km² | 796 m | $ 67,758 | 1912 |
| Blythe | 20,817 | 69.855 km² | 83 m | $ 48,327 | 1916 |
| Calimesa | 7,879 | 38.454 km² | 729 m | $ 44,817 | 1990 |
| Canyon Lake | 10,561 | 12.099 km² | 422 m | $ 74,133 | 1990 |
| Cathedral City | 51,200 | 56.349 km² | 100 m | $ 44,763 | 1981 |
| Coachella | 40,704 | 74.981 km² | −21 m | $ 41,611 | 1946 |
| corona | 152.374 | 100.829 km² | 206 m | $ 78,982 | 1896 |
| Desert Hot Springs | 25,938 | 61.233 km² | 328 m | $ 32,883 | 1963 |
| Eastvale | 53,668 | 29.644 km² | 191 m | $ 109,841 | 2010 |
| Hemet | 78,657 | 72.124 km² | 486 m | $ 33,460 | 1910 |
| Indian Wells | 4,958 | 37.790 km² | 27 m | $ 100,742 | 1967 |
| Indio | 76.036 | 75,600 km² | −4 m | $ 50,528 | 1930 |
| Jurupa Valley | 97,496 | 112.7 km² | 230 m | $ 55,516 | 2011 |
| Lake Elsinore | 51,821 | 107.970 km² | 395 m | $ 62,436 | 1888 |
| La Quinta | 37,467 | 92.078 km² | 41 m | $ 72,099 | 1982 |
| Menifee | 77,519 | 120.711 km² | 440 m | $ 53,415 | 2008 |
| Moreno Valley | 193,365 | 133.319 km² | 497 m | $ 55,872 | 1984 |
| Murrieta | 103,466 | 87.058 km² | 334 m | $ 75,485 | 1991 |
| Norco | 27,063 | 36.980 km² | 195 m | $ 82,074 | 1964 |
| Palm Desert | 48,445 | 69.966 km² | 67 m | $ 53,456 | 1973 |
| Palm Springs | 44,552 | 245.984 km² | 146 m | $ 45,404 | 1938 |
| Perris | 68,386 | 81.594 km² | 443 m | $ 46,435 | 1911 |
| Rancho Mirage | 17,218 | 64.326 km² | 83 m | $ 77,304 | 1973 |
| Riverside (County Seat) | 303,871 | 210.941 km² | 262 m | $ 56,403 | 1883 |
| San Jacinto | 44,199 | 67.679 km² | 477 m | $ 47,453 | 1888 |
| Temecula | 100.097 | 78.133 km² | 358 m | $ 78,668 | 1989 |
| Wildomar | 32,176 | 61.351 km² | 387 m | $ 60,219 | 2008 |
- ↑ 2012 estimate, as the city was not formed until after the 2010 census .
Census-designated places
- Aguanga
- Number
- Bermuda Dunes
- Cabazon
- Cherry Valley
- Coronita
- Crestmore Heights
- Desert Center
- Desert Edge
- Desert Palms
- East Hemet
- El Cerrito
- El Sobrante
- French Valley
- Garnet
- Good hope
- Green acres
- Highgrove
- Home Gardens
- Homeland
- Idyllwild-Pine Cove
- Indio Hills
- Lake Mathews
- Lake Riverside
- Lakeland Village
- Lakeview
- March Air Reserve Base
- Mead Valley
- Meadowbrook
- Mecca
- Mesa Verde
- Mountain Center
- North Shore
- Nuevo
- Oasis
- Ripley
- Romoland
- Sky Valley
- Temescal Valley
- Thermal
- Thousand palms
- Valle Vista
- Vista Santa Rosa
- Warm Springs
- Whitewater
- Winchester
- Woodcrest
Indian reservations
There are twelve federally recognized Indian reservations in Riverside County . In terms of number, it ranks second with Sandoval County in New Mexico behind San Diego County with 18 reservations.
- Agua Caliente Indian Reservation
- Augustine Indian Reservation
- Cabazon Indian Reservation
- Cahuilla Indian Reservation
- Colorado River Indian Reservation (partly in San Bernardino County and La Paz County ( Arizona ) located)
- Morongo Indian Reservation
- Pechanga Indian Reservation
- Ramona Band of Cahuilla
- Santa Rosa Indian Reservation
- Soboba Band of Mission Indians
- Torres-Martinez Indian Reservation (partially located in Imperial County )
- Twenty-Nine Palms Indian Reservation (partially located in San Bernardino County)
Nature reserves
- Cleveland National Forest (partially located in San Diego Counties and Orange Counties)
- Coachella Valley National Wildlife Refuge
- Joshua Tree National Park (partially located in San Bernardino County)
- San Bernardino National Forest (partially located in San Bernardino County)
- Santa Rosa and San Jacinto Mountains National Monument
history
Riverside County was created on May 9, 1893 from parts of San Bernardino County and San Diego County . Before that, on May 2nd of the same year, 70% of voters decided to found it and chose the town of the same name, Riverside, as the administrative center.
On December 25, 1899 and April 21, 1918 , a major earthquake occurred in San Jacinto .
Dr. June McCarroll of Indio suggested the use of road boundaries in 1915, which is why Riverside County is considered the birthplace of the lane . The county later became an important rally site in the time of the Civil rights movements ; especially Riverside's Afro - American districts and the places in the Coachella Valley with a high proportion of Hispanics , which César Chávez visited, played an important role.
In the early 1980s, the county government cracked down on Native American casinos by attempting to close down small gaming parlors owned by the Morongo Band of Mission Indians and Cabazon Band of Mission Indians . The natives took action against the administration and were granted the right to operate casinos by the Supreme Court on February 25, 1987. In 1988, Congress passed the Indian Gaming Regulatory Act, a law on links between state administrations and Indians. Today both tribes operate large casino complexes.
There are two National Historic Landmarks in Riverside County , the Mission Inn and the Harada House . A total of 58 buildings and sites in the county are listed on the National Register of Historic Places .
Riverside County and the 2008-2010 Financial Crisis
Riverside County is one of the most populous counties in Southern California. The hills next to the highways are covered with satellite towns , single-family houses in endless rows, mainly in the colors beige, brown and ocher. Almost nowhere in the country were more houses built than here between 2000 and 2010 and almost nowhere in the country were more houses foreclosed in 2009 and 2010 .
Demographic data
| growth of population | |||
|---|---|---|---|
| Census | Residents | ± in% | |
| 1900 | 17,897 | - | |
| 1910 | 34,696 | 93.9% | |
| 1920 | 50,297 | 45% | |
| 1930 | 81.024 | 61.1% | |
| 1940 | 105,524 | 30.2% | |
| 1950 | 170.046 | 61.1% | |
| 1960 | 306.191 | 80.1% | |
| 1970 | 459.074 | 49.9% | |
| 1980 | 663.166 | 44.5% | |
| 1990 | 1,170,413 | 76.5% | |
| 2000 | 1,545,387 | 32% | |
| 2010 | 2,189,641 | 41.7% | |
| 1900–1990 2000 + 2010 | |||

After the census in 2000 1545387 people lived in Riverside County. There were 506,218 households and 372,576 families. The population density was 83 inhabitants per square kilometer. The racial the population was composed of 65.58% White, 6.24% African American, 1.18% Native American, 3.69% Asian, 0.25% Pacific Islander, and 18.69% other races Groups; 4.37% were from two or more races. Hispanic or Latino of any race was 36.21% of the population.
Of the 506,218 households, 38.90% had children and adolescents under the age of 18 living with them. 56.50% were married couples living together, 12.00% were single mothers. 26.40% were not families. 20.70% are single households and 9.30% have someone who is 65 years of age or older. The average household size was 2.98 and the average family size was 3.47 people.
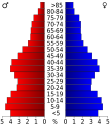
For the entire county, the population was 30.30% below the age of 18, 9.20% between 18 and 24, 28.90% between 25 and 44, 18.90% between 45 and 64 12.70% were 65 years of age or over. The median age was 33 years. For every 100 females there were 99.10 males, and for every 100 females aged 18 and over there were 96.80 males.
The median income for a household in the city was $ 42,887 , and the median income for a family was $ 48,409. Males had a median income of $ 38,639 versus $ 28,032 for females. The per capita income was $ 18,689. 14.20% percent of the population and 10.70% of families are below the poverty line. 18.50% of these were under 18 years of age and 7.60% were 65 years of age or older.
Individual evidence
- ↑ GNIS-ID: 277297. Retrieved on February 22, 2011 (English).
- ↑ Data from the "American FactFinder". United States Census Bureau .
- ↑ Listing of National Historic Landmarks by State: California . National Park Service , accessed August 27, 2017.
- ↑ Search mask database in the National Register Information System. National Park Service , accessed August 27, 2017.
- ↑ Der Spiegel: 15/2010, p. 87
- ↑ Extract from Census.gov . Retrieved February 28, 2011
- ↑ Extract from census.gov (2000 + 2010). Accessed April 2, 2012
Web links
- Official site of the county (English)
Coordinates: 33 ° 44 ′ N , 115 ° 59 ′ W


