
Consequences of global warming


With the consequences of global warming , numerous changes affecting mankind and the earth are described by a worldwide rise in temperature. The Global warming is the observed and predicted trend towards compared to pre-industrial higher values global average temperature with consequences such as rising sea levels , melting glaciers , shifting of climate zones, vegetation zones and habitats, stronger or more frequent forest fires , altered incidence of rainfall , stronger or more frequent weather extremes such as floods , storms and droughts , the spread of parasites and tropical diseases, and more environmental refugees . The predicted and observed negative effects of climate change are sometimes referred to as " climate catastrophe ".
While there is broad consensus on the causes of global warming (mainly human greenhouse gas emissions ), its consequences are widely discussed. Some consequences are already noticeable, others are only expected in the future.
According to a study by the Stockholm Resilience Center in 2009, the limit value determined for the carbon dioxide content of the atmosphere has already been exceeded by 11%, so that anthropogenic climate change is the second biggest global ecological problem after species extinction ; it is also an essential characteristic of the Anthropocene and one of the consequences of increasing hemerobia .
In addition to the "linear" expected consequences of global warming described here, there is broad consensus in climate research that there are so-called " tipping elements in the earth system ", which set a kind of domino effect in motion that irrevocably turns into one that is hostile to human life Hot time would result. However, different climate models come to different results as to the temperature at which this threshold lies. A meta - analysis by Steffen et al. In 2018 came to the conclusion that the 2-degree target set in the Paris Agreement might not be sufficient to prevent such feedback.
The acidification of the oceans , which is also very problematic from an ecological point of view , is not dealt with here , which is directly caused by the increasing atmospheric carbon dioxide content.
Expected level of global warming


The extent to which the average temperature rises in the course of the 21st century depends in particular on the amount of greenhouse gases that are emitted. In the Fifth Assessment Report, the Intergovernmental Panel on Climate Change (IPCC) assumed that the global average temperature would increase by 1.5 to 4.5 ° C by 2100, depending on the further increase in emissions.
Rising average temperatures shift the temperature spectrum . While extreme cold events are less common, exceptional heat events are more likely. Because of the possible effects on human security , health, the economy and the environment, global warming has great risks, but can also have positive effects locally and regionally. Some changes in the environment that affect people and ecosystems together can already be perceived. These include rising sea levels , melting glaciers or statistically significant deviations from normal weather patterns (see section #Environmental impacts ). Whether these and other consequences will occur and how severe they will be is assessed very differently. The effects of climate change are regionally and locally shaped and have individual consequences. The climate models currently describe the consequences quite well at the global level, but can only estimate them with great uncertainty at the regional level. The warming trend is foreseeable not only placing enormous strains on ecosystems, but also on billions of people. B. in terms of water supply.
How strong the changes will be depends on how quickly climate change advances. If it happens in a very short time, both the economic adjustment costs and the effects on nature will likely be drastically felt. The calculations made by the Intergovernmental Panel on Climate Change based on the expected further development of greenhouse gas emissions for the sea level rise in the global average, which in 2007 was 59 centimeters, were estimated at 82 centimeters in 2014 and, according to the special report on the oceans and ice areas of the earth from 2019, are 110 centimeters . In this context, it is foreseeable that storm surges will increase in the near future and will burn higher on the coasts. What was previously a flood of the century, this report conveys, will in future occur annually.
In the Emissions Gap Report 2019, the United Nations stipulates specific reduction measures for climate-damaging greenhouse gases, since if emissions remain unchanged, the mean temperature of the earth threatens to rise by 3.4 to 3.9 degrees Celsius by the end of the 21st century. In order to meet the 1.5 degree target, greenhouse gas emissions would have to fall by 7.6 percent annually between 2020 and 2030. Limiting warming to 2 degrees Celsius would require an annual reduction of 2.7 percent.
Environmental impact
According to the IPCC , of 29,436 series of observational data from 75 studies showing significant changes in physical or biological systems, 89% show changes consistent with expectations of a warmer world. With over 28,000 data sets on biological changes, Europe is clearly overrepresented here, but the fact that 90% of these show a change that is consistent with warming also makes the result very robust. In other regions and worldwide for the physical systems there are significantly fewer data sets, but their congruence with the warming signal is also very high at 88% to 100%.
biodiversity
Strongly increased CO 2 concentrations and rapid climate change have been major causes of mass extinctions in the history of the earth . It is now very likely that global warming will accelerate species extinction.
If no measures are taken to combat climate change, 16% of all species worldwide are threatened with extinction, according to a review published in Science in 2015 . South America with 23% and Australia with 14% are the continents with the largest proportion of threatened species, for Europe the proportion was 6%, for North America 5%. If the two-degree target is met , the rate could be reduced to 5.2% worldwide. According to the Arctic Climate Impact Assessment commissioned by the Arctic Council, biodiversity will increase in many polar regions because new species will migrate to the Arctic as warming increases and the total number of species and their productivity will increase.
The Bramble Cay mosaic tail rat was declared extinct as the first mammalian species to fall victim to climate change .
Effects on the oceans
The world's oceans contain around 50 times more carbon than the atmosphere. The ocean acts as a large carbon dioxide sink and absorbs around a third of the amount of carbon dioxide released by human activities. In the upper layers of the oceans, it is partially bound by photosynthesis. If the oceans were not to dissolve carbon dioxide, the atmospheric concentration of carbon dioxide would be 55 ppm higher according to a study from 2004, at that time at least 435 ppm instead of 380 ppm. Calculated over a period of centuries, the oceans are able to absorb up to 90% of the anthropogenic CO 2 emissions. However, various effects ensure that with rising temperatures and a growing proportion of atmospheric CO 2, the ocean's ability to absorb carbon decreases. How far the absorption capacity drops is difficult to quantify. In a scenario with emissions rising sharply over the 21st century (business as usual) , the share absorbed via this effect is only 22%. The absorbed share only increases in an emissions scenario with strict climate protection.
Sea level rise

As a result of global warming, the sea level is rising . Between 1901 and 2010 it increased by about 1.7 cm per decade, with the increase since 1993 increasing to about 3.2 cm per decade. According to a WMO report , sea level rise has accelerated further to 5mm annually in 2014-2019. According to various IPCC scenarios, increases of between 0.40 m with strict climate protection and 0.67 m with further increases in emissions (business as usual) are expected by 2100 compared to the level of the 1990s. The increase is not uniform, but varies from region to region due to ocean currents and other factors. The possible collapse of parts of the Antarctic ice sheet is not yet included in these calculations and would lead to massive additional increases.
There are essentially two factors responsible for the rise in sea level: On the one hand, seawater expands more rapidly at higher temperatures; on the other hand, glaciers melt more rapidly at higher temperatures (see below). For thermal expansion up to 2100 alone, values of 13–18 cm (when the air temperature rises by 1.1–1.5 ° C) and 19–30 cm (at 2.2–3.5 ° C) are given. The additional contributions from meltwater are likely to double these. If the warming stabilizes at 3 ° C compared to the pre-industrial value, a sea level rise of 2.5–5.1 m is forecast by the year 2300. Of this, 0.4–0.9 m is due to thermal expansion, 0.2–0.4 m to the melting of mountain glaciers, 0.9–1.8 m to the melting of the Greenland glaciers and 1–2 m to the Melting glaciers in West Antarctica.
In particular, some small countries in the Pacific Ocean , whose land area is only slightly above sea level, must fear that they will sink into the sea in the next few decades. In addition to island states , coastal regions and cities are particularly threatened. The risks include increased coastal erosion , higher storm surges , changes in the water table , damage to buildings and ports, or the deterioration in conditions for agriculture and aquaculture . Without countermeasures, a rise in sea level of 1 m would permanently flood 150,000 km² of land area worldwide, 62,000 km² of which are coastal wetlands. 180 million people would be affected and $ 1.1 trillion in property destroyed would be expected (given today's population and property). Comprehensive coastal protection would cost more than 180 of the 192 affected countries worldwide less than 0.1% of their GDP by 2085.
The rise in sea levels, which is already foreseeable today, will cause major financial damage, which will be greater the hotter it gets. For example, a study published in 2018 came to the conclusion that if the 1.5-degree target is adhered to, the rise in sea levels in 2100 will cause follow-up costs of 10.2 trillion US dollars per year worldwide . On the other hand, if only the less ambitious two-degree target were met, the costs would be $ 1.5 trillion higher per year. If, on the other hand, no climate protection is pursued ( representative concentration path RCP8.5), depending on the height of the sea level that occurs, 14 or even 27 billion dollars in follow-up costs per year would arise. With adaptation measures to the rising sea level, these costs could be reduced significantly. However, even with strong adjustments and adherence to the 1.5 degree target in 2100, 1.1 trillion dollars in follow-up costs would arise per year. Without climate protection with only adaptation measures, it would be $ 1.7 trillion per year for a sea level rise of 86 cm and $ 3.2 trillion for a sea level rise of 1.80 m.
warming
The oceans warm up with a time lag with the rising temperatures of the earth's atmosphere. On the one hand, this leads to a thermal expansion of the water masses, which makes a contribution to rising sea levels (see above).
More serious for the ocean ecosystem , however, are the numerous other effects associated with increased water temperature. On a global average, the entire water body of all oceans has only warmed by 0.04 ° C since 1955. This slight warming is due to the fact that so far only a few hundred meters of the uppermost water layers have become warmer. In relation to the surface temperature of the water, the warming of 0.6 ° C is already much more pronounced. It is still less than the increase in surface temperatures on land, since land areas generally warm up faster. Between 1993 and 2005, the total rate of warming of the water layers up to 750 m depth is calculated to be 0.33 ± 0.23 W / m².
The warming of the oceans has consequences for their inhabitants such as fish and marine mammals : similar to land animals, they migrate towards the poles. The cod populations in the North Sea are shrinking more than can be explained by overfishing alone ; they are already migrating northwards as a result of the rising temperatures. Northern regions could benefit from this development: For the Arctic Ocean it can be assumed that fishing will improve overall and the composition of the catch will change as long as warming is limited to 1–2 ° C. The uncertainties about further development are still great; overall, a decreasing biomass of marine fauna is expected, especially at higher levels of the food webs , i.e. fish and marine mammals. According to an analysis of the dynamics of 235 fish populations in the period 1930–2010, significantly more species reacted negatively than positively to the warming. The maximum catch that can be taken with sustainable fishing has therefore decreased by 4.1% during this period due to the rising sea temperatures.
Decrease in oxygen content
Warmer water can store less oxygen , so the warming of the oceans leads to the expansion of oxygen-poor areas. These are given naturally from a water depth of around 200 m; According to press releases from spring 2018, however, after a measurement campaign in the Gulf of Oman , an area more than the size of Scotland was unexpectedly low in oxygen. Observations and numerical models indicate that the oxygen content of the oceans has decreased by 1–2% globally since the middle of the 20th century. The decrease is particularly noticeable in the northern hemisphere.
Algal bloom
Toxic algal blooms - the explosive multiplication of macroalgae and other phytoplankton, cyanobacteria , dinoflagellates , diatoms that form toxins - have been observed more frequently and in more extensive regions on the sea coasts since the 1980s. In addition to factors such as nutrient input by rivers, climate changes are the cause, both the rising temperature trend in the oceans and extreme events ( marine heat waves ) and a lack of oxygen.
When these organisms multiply on a mass scale, there is a toxic threat to humans and the environment that should not be underestimated. It exacerbates the anoxic state of water. So much venom can be produced that it kills fish and other marine life. Karenia brevis produces brevetoxins and can lead to mass deaths of fish, birds and mammals in the “red tides” they generate .
Poisonous dinoflagellates (e.g. Alexandrium catenella , Karlodinium veneficum ) produce more cytotoxin when the water becomes more acidic, as is the case with increasing CO 2 concentrations.
A problem for humans that should not be underestimated is the contamination of food sources by poisonous algae species. Toxic algal blooms are already very likely to have a negative effect on food safety , human health, but also tourism and the economy of the regions affected. For example, an algal bloom near Baja California in 2016 led to losses of US $ 42 million in the tuna industry alone. People are particularly at risk where there are no monitoring and warning systems.
Coral bleaching
The warming of seawater can at coral reefs called coral bleaching cause that results in prolonged exposure to the death of the coral. Different taxa of corals have very different tolerances towards coral bleaching. For example, Porites is far less prone to bleaching than Acropora . In 2003, scientists therefore assumed that coral reefs would not disappear as a reaction to ocean warming, but that their species composition would change. The scientific advisory board of the federal government for global environmental changes held z. B. in a special report (2006) a model for realistic, in which the different threshold values for coral death change over time due to acclimatization and evolution, thus enabling limited adaptation to climate change.
As of 2017, the future disappearance of coral reefs is a fact to be taken seriously. Due to global warming, severe coral bleaching has occurred several times. B. the Great Barrier Reef was badly damaged. Even old reefs can recover over a period of decades after bleaching. During this period, however, there must be no further coral bleaching or other further disturbance of the recovery phase, which is judged to be an unrealistic assumption given the ongoing warming. In order to preserve the coral reefs that still exist, climate protection measures that are effective very quickly are necessary to quickly combat global warming and thus ocean warming. However, these were not taken as of 2018.
Change in ocean currents

Global warming can also have less obvious effects: The North Atlantic Current as part of the global conveyor belt is driven, among other things, by the fact that water in the Arctic Ocean cools down with the Gulf Stream . As a result, the density of the surface water increases, which then sinks into deeper layers of the ocean. This sinking leads, firstly, to a suction that repeatedly allows new surface water to flow in, and secondly, it sets in motion a permanent circulation of the seawater, because a current flowing in the opposite direction can develop in the deep sea . This interaction is also called thermohaline circulation .
The North Atlantic Current has been interrupted several times over the past 120,000 years. The reason for this was the influx of large quantities of fresh water, which weakened the compression process and prevented the surface water from sinking. During one of these events, a huge meltwater lake in Canada , the Agassizsee , which had formed during the warming phase at the end of an ice age, emptied . The enormous amounts of additional fresh water prevented the seawater from sinking and the North Atlantic Current stopped. For Europe this meant the continuation of the glacial period that was actually just coming to an end.
Theoretically, global warming could lead to another interruption as a result of the increased input of freshwater from Greenlandic glaciers. Drying up of the Gulf Stream would, if not an ice age, result in a severe cold snap in all of Western and Northern Europe . If the climate continues to warm, similar changes in the other oceanic currents could occur over time, with far-reaching consequences. An interruption of the North Atlantic Current has so far been considered very unlikely by the participating scientists, at least in the medium term. According to simulations with climate models, a slight weakening of the North Atlantic Current is expected by the end of the 21st century. According to current studies from 2018, effects are already showing that can be expected with a weakening North Atlantic current.
Effects on tropical cyclones
| Atlantic (since 1850) | East Pacific (since 1971) | ||||
|---|---|---|---|---|---|
| rank | season | ACE | rank | season | ACE |
| 1 | 2005 | 248 | 1 | 1992 | 290 |
| 2 | 1950 | 243 | 2 | 1990 | 249 |
| 3 | 1893 | 231 | 3 | 1978 | 207 |
| 4th | 1995 | 227 | 4th | 1983 | 206 |
| 5 | 2004 | 224 | 5 | 1993 | 201 |
| 6th | 1926 | 222 | 6th | 1984 | 193 |
| 7th | 1933 | 213 | 7th | 1985 | 192 |
| 8th | 1961 | 205 | 8th | 1994 | 185 |
| 9 | 1955 | 199 | 9 | 1991 | 178 |
| 10 | 1887 | 182 | 10 | 1997 | 167 |
In 2006, the International Workshop on Tropical Cyclones of the World Meteorological Organization (WMO) stated that there are indications for and against the presence of a recognizable anthropogenic signal in the previous recordings of tropical cyclones , but so far no firm conclusions can be drawn. The WMO also points out that no single tropical cyclone can be directly linked to climate change.
The intensity of tropical cyclones follows empirical knowledge of the surface temperature of the sea. It should be noted that these temperatures vary over a period of several decades for reasons that are not yet known. In the North Atlantic, the Atlantic Multi-Decade Oscillation alternates between 'warm' and 'cold' at a rhythm of around 50 to 70 years, while in the Northeast Pacific the Pacific Decade Oscillation makes a similar change every 20 to 30 years. In the North Atlantic in particular, a trend can be seen that with 'warm' AMO there are significantly more intense hurricane seasons than with 'colder'. Seven of the ten most intense hurricane seasons (since measurements began in 1850) occurred in the penultimate two AMO warm phases from ~ 1850 to ~ 1900 and ~ 1925 to ~ 1965. In the subsequent cold phase, which lasted until the early 1990s, however, there were only comparatively mild hurricane seasons. The AMO has been in a warm phase again since around 1995, which is why the hurricane intensity has increased significantly again. The warm phase of the AMO is projected to peak by around 2020, which means that hurricane intensity in the North Atlantic is likely to remain high until then.
Over the period 1979-2017, the probability of storms reaching particularly high intensity categories 3-5 increased globally. An increase in the intensity of the strongest storms was found for all areas of distribution, especially in the North Atlantic and northwestern Pacific. Some researchers see the effect of global warming in the increase in intensity . According to the statistics of NOAA, the intensity and also the number of observed hurricanes increased in the trend in each warm phase of the AMO. According to NOAA, the increasing number is due to improved observation instruments and analysis methods. The WMO stated in 2006 that the dramatic improvements in wind speed measurement techniques over the past few decades have made it difficult to pinpoint an exact trend. While in the 19th and early 20th centuries one relied on the selective air pressure and wind speed measurements of individual stations and research vessels, satellites have enabled much more precise observation of hurricanes since the 1970s. Some researchers point out that in the 19th and early 20th centuries, many tropical cyclones went unregistered if they did not reach a coast or existed for only a few days.
For even longer-term trends in the intensity of tropical cyclones, one has to rely on the reconstructions of paleotempestology . The number of such reconstructions has so far been limited due to the young age of this research area. Various studies show that there have been phases of high storm frequency in the past. However, depending on the location, different times and causes for such "hyperactive" phases are named. A study published in 1998 found that during such a phase the region around the Gulf of Mexico in particular was frequently affected by “catastrophic hurricanes” of category 4 and 5.
Inland waters
The water temperatures measured on the surface of lakes around the world are increasing by 0.34 ° C per decade, and so are the evaporation rates. The circulation in the waters changes, typically the water in the lakes is less mixed up. Researchers at the Berlin Leibniz Institute for Freshwater Ecology and Inland Fisheries (IGB) published in early November 2017 in the journal Scientific Reports after evaluating satellite images between 2002 and 2016 of around 190 of the world's largest lakes such as Lake Baikal ( Siberia ), Lake Titicaca ( Peru / Bolivia ) or Lake Victoria ( East Africa ) that they would become bluer or greener in future due to global warming in connection with their phytoplankton content: The respective tendencies (plankton content high = green or low = blue) would intensify.
Lakes and rivers are less and less frozen. From 1984 to 2018, according to an analysis of satellite data, the ice-covered area of rivers decreased by 2.5% globally. Without effective climate protection, rivers could be frozen over about 15 days shorter on average by the end of the century. This figure also includes rivers that never have an ice cover - for rivers that are regularly ice-covered, the decline could be closer to a month. According to one estimate, the number of lakes that are only sporadically frozen will more than double in the northern hemisphere if the temperature increases by 2 ° C, with consequences for almost 400 million people; a temperature increase of 8 ° C could increase the number by more than fifteen times.
Greening the Sahara
Simulations show that the Atlantic thermohaline circulation may weaken in the future, which led to an Atlantic El Niño state with strong warming of the Gulf of Guinea. This would collapse the West African monsoon and then move north into the Sahara. Greening this region is therefore one of the possible effects of global warming. However, climate simulations carried out under the auspices of NOAA using the most modern climate models indicate a decline in precipitation in the Sahel zone for the 21st century. Other climate models see the degradation of soil and vegetation as the main cause of aridization , while warming, viewed individually, should have a predominantly positive effect on precipitation.
Polar caps / ice sheets
- Trends in sea ice in the Arctic and Antarctic
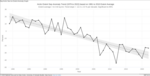
Trend of the minimal extent of the Arctic sea ice until September 2017 ...
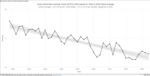
... and the trend for the maximum until March 2017
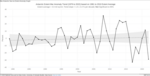
Trend for the minimum extent of the Antarctic sea ice until March 2017 ...
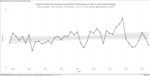
... and the trend of maximum expansion until September 2017


Melting sea ice has only minor consequences for the sea level (and leads to the opening of the Northwest and Northeast Passages to shipping). Since sea ice consists of fresh water and has a lower density in frozen and liquid state than the sea water below, the melting of all sea ice and the floating ice shelves would raise the global sea level by approx. 4 cm. In contrast, the picture for the ice sheets of Greenland and Antarctica is different. A complete meltdown as a worst-case scenario would, in the case of the Greenland ice sheet, result in a rising water level of 7 m, in the case of West Antarctica it would be 6 m. The East Antarctic is still considered stable, its melting would cause the sea level to rise by more than 50 m. However, more research is needed to assess the likelihood of this occurrence. The available models do not allow a clear answer in this regard. In any case, such a melt would have to take at least a few hundred years before the mentioned land areas would be free of ice. The age of the Greenland ice sheet is estimated to be at least 130,000 years, so that it must have withstood the warmest phase of the Holocene , the Atlantic (6th – 3rd millennium BC).
Between 2011 and 2014, a total of 503 ± 103 km³ of ice was lost in the Arctic and Antarctic; In Greenland, ice loss has increased two-and-a-half-fold compared to the same period 2003–2009 and has tripled in West Antarctica.
Even with the current warming trend, severe damage is to be expected, particularly for wild animal populations in the northern polar region. In recent years, the effects that have already occurred in polar bears have been the subject of controversy. Since they are dependent on sea ice - they hunt seals living on the ice and use ice corridors to move from one area to another - they are considered unlikely to survive as a species if there is a complete loss of summer sea ice . On the other hand, thousands of seals are killed every year in Canada, for example, which greatly reduces the polar bears' main source of food. The way of life of the Eskimos , who depend on intact ice surfaces for accessibility and hunting, will also be affected .
Antarctic
In the Antarctic so far a different picture. Here the mean temperature has increased by an estimated 0.2 ° C since the 19th century. While the Antarctic continent last warmed up slightly between 1958 and 1970, the Antarctic temperature records for the last 32 years show neither warming nor cooling. There is uncertainty about the exact development of the Antarctic, since accumulation in the core areas and melting processes in the peripheral areas make a closed mass balance very difficult. The first complete gravity analysis over the entire Antarctic ice sheet showed that in the observation period between April 2002 and August 2005 the average annual loss of ice mass was 152 (± 80) km³. This complex problem - the usually very sluggish ice dynamics - is also influenced locally and globally by complementary factors, for example of a plate-tectonic or isostatic nature (local sinking, narrowing of the oceans). These tend to be designed for long periods of time. In the winter of 2007, the area of the Antarctic sea ice reached 16.17 million square kilometers, the largest area since measurements began in 1979. The increasing area of the Antarctic sea ice can be explained by the increasing snowfall due to the warming air.
According to Scientific Reports, even previously stable permafrost soils are melting faster than previously expected on the coasts of Antarctica, mainly due to more intense solar radiation.
Arctic
Due to the polar amplification , the temperatures in the Arctic rise significantly faster than the global average. The entire Arctic is on the move. Even in the immediate vicinity of the pole, there are increasingly open water surfaces in summer. Between 1979 and 2005, the observed ice surface decreased by 1.5–2.0% per decade. On August 8, 2007, one month before the minimum usually reached in September, the smallest extension ever recorded was measured at 5.8 million km². As of August 14, the expansion had fallen further to 5.4 million km². The loss of land had already accelerated considerably in the winters of 2005 and 2006. In each of the two years, the maximum extent of sea ice fell by 6% - an increase by a factor of 30 to 40 compared to the melt rate determined in the previous decades. Between 1979 and 2006 there was a significant loss of sea ice for each month compared to the previous year. This is strongest for September, traditionally the month with the smallest expansion, where it is 8.6 ± 2.9% per decade.
There are greater uncertainties in determining the thickness of the ice sheet. Here the data fluctuate between 40% and 8–15% decrease. According to model calculations, between the middle and the end of the 21st century (as of 2006), with advancing warming, an ice-free north polar region can be expected in the summer months. According to various measurements, the mass loss in Greenland in 2006 was between 239 ± 23 km³ and 224 ± 41 km³ per year.
Regional heat records

As global warming continues, the probability of regional warming records will increase. A statistical analysis showed that in the decade 2000–2010 the probability of regional temperature records for monthly average temperatures increased fivefold. The heat wave in Europe in 2003 as well as the heat wave which, for example, favored the development of forest and peat fires in Russia in 2010 , would not have occurred with a high degree of certainty without man-made global warming. In a statistical analysis of the globally available temperature data, Hansen et al. the probability of the occurrence of extreme heat events, i.e. temperatures whose value deviated from the mean value by more than three standard deviations (sigma, σ). In the underlying reference period, by definition, this could only be observed in an area corresponding to 0.1% to 0.2% of the earth's surface. The period from 2006 to 2011 was chosen as the comparison period, which was around 0.6 K ( Kelvin ) warmer globally . Even this slight warming at first glance meant that the area on which heat waves with temperatures greater than three standard deviations occurred during this time affected an area between 4% and 11% of the earth's surface. If the temperature increases by 1 K, heat anomalies that were previously considered to be 3-sigma events, i.e. with a probability of 0.13%, will occur, the new normal average temperatures and 5-sigma heat anomalies become as likely as it was previously 3-sigma -Heat anomalies (5 sigma equals a probability of one event per million years).
A global warming of 4 ° C would lead to annual observable average temperatures in some regions of the tropics , which without such warming of the planet would otherwise only occur once every one million years.
Retreat of the glaciers

Closely linked to the rise in sea level, but with numerous other consequences for the drinking water supply and local ecosystems, is the decline in mountain glaciers , which began in the 19th century and has accelerated considerably since then.
Glaciers are very sluggish structures, which means that they are less influenced by individual weather conditions than by long-term climate changes. Therefore, taken as a whole, they are a good indicator of long-term temperature trends to which they are much more sensitive. 83% of all glaciers shrank between 1970 and 2004, the average rate of retreat of all glaciers was 0.31 m per year. The mass balance of the global glaciers has been clearly negative as a result of this decline since 1960, as the diagram shows.
Glaciers absorb water in the form of ice in winter. In summer they release it as meltwater to rivers. Due to the continuous melting of the glaciers since the end of the Little Ice Age , the amount of water carried by the rivers increased, especially in summer. The additional amount of water released from the Himalayan glaciers has led to an increase in agricultural productivity in northern India. In the opposite case, the expansion of the Karakoram Glacier due to the regionally falling summer temperatures since 1961 led to a 20% decrease in the amount of water in the rivers Hunza and Shyok in summer .
According to the forecasts of the IPCC, the volume of the northern hemisphere glaciers will decrease by an average of 60% by 2050. In the second half of the 21st century, more and more efficient water management will therefore be necessary to compensate for the declining summer water volumes in the rivers. Otherwise, the decline in the amount of water available will significantly reduce agricultural production in some areas.
Changed seasons

One of the already visible consequences of global warming is the temporal change in the occurrence of the seasons in climatic terms (not astronomical). Spring begins almost two weeks earlier in different regions, as shown, for example, by the migration behavior of migratory birds . A study of the behavior of 130 animal species showed an average advance of species-typical seasonal behavior by 3.2 days per decade. Animals living north of the 45th parallel (about the height of Turin in northern Italy) even showed a deviation of 4.4 days per decade.
Also phenological observations of plants indicate warming. On average, leaf development and flowering begin 2.4–3.1 days per decade in Europe, and 1.2–2.0 days per decade earlier in North America. The annual cycle of the carbon dioxide content of the atmosphere, which in the northern hemisphere reaches its maximum in winter, also confirms the premature spring. The decline to the summer minimum already occurred at the end of the 1990s 7 days earlier than in 1960. One consequence for the fauna is the shift in familiar rhythms. For certain bird species studied, such as the great tit , it was found that their young were increasingly struggling with feeding problems. Since the life cycle of a caterpillar species serving as the main food source had shifted forward in time and the birds were only able to partially follow with their breeding behavior, the young birds lose an important food source.
Due to the extended vegetation period , evaporation through plant growth increases, which in turn can promote summer droughts.
A delay in the autumn phases is also observed, visible at the beginning of the leaves changing color. However, these changes vary more widely and are not as pronounced as those of the spring phases. In Europe, the time at which the leaves change color has been delayed by 0.3–1.6 days per decade over the past 30 years. Overall, the growing season has lengthened by up to 3.6 days per decade over the past three to five decades.
Another consequence is the later freezing of lakes and rivers in winter combined with an earlier break-up in spring. Between 1846 and 1995, lakes and rivers in the northern hemisphere froze over an average of 5.8 days per century later. The ice broke open an average of 6.5 days per century earlier in spring.
Changed rainfall levels: droughts and floods
Global warming leads to a changed distribution and amount of rain: Precipitation falls at different intervals than previously usual or is redistributed over the seasons. Extreme weather conditions caused by precipitation, such as floods or droughts, can also increase or decrease on a warmed earth. It should be noted that a single event can never be directly attributed to global warming. However, under the conditions of climate change, the probability of such events occurring changes.
The mapping of large-area trends in the amount of precipitation since 1900 shows clear regional differences. Canada, Northern Europe, the West Indies and Eastern Australia in particular received more rainfall. Declines of up to 50% were particularly measured in West and East Africa and in West Latin America. Compared to 1980, according to a model study, East Africa will experience a further decline by 2050, as will Central America and a large region that stretches from New Zealand via Australia and New Guinea to Japan. A significant increase is expected for the east of Greenland, for parts of Latin America and West Africa and especially over the Pacific Ocean.

In a study from 2002 several thousand time series of different climatic indicators are evaluated, which lead to the conclusion that the number of days with particularly heavy precipitation has increased significantly. Heavy rainfall in Great Britain nearly doubled during the winter. While 7–8% of winter precipitation fell into the heavy rain category in the 1960s , it was already around 15% in the 1995s. The land area affected by extreme weather has also grown significantly since 1950, even if insufficient data were available for parts of Africa and South America when the study was being carried out. People in Africa are particularly exposed to extreme events as there is only a poorly developed meteorological monitoring system, which often leads to delayed and inaccurate information. A study from 2015 found, based on data from the Krymsk flood disaster : "Over the entire eastern Mediterranean and Black Sea, the atmosphere has become significantly more unstable due to the warming of the sea" .
According to a 2012 study, the earth's water cycle increased by 4% between 1950 and 2000. According to the study, with every degree Celsius of warming, the water cycle is accelerated by around 8%, which changes precipitation patterns and exacerbates imbalances in the global water supply. This leads to more drought in already dry regions and an increase in flooding in areas that are already water-rich.
A 2005 study of 195 rivers worldwide shows an increase in flooding for 27 of them, a decrease for 31, but no clear trend for the remaining 137. Another study from 2002 claims to have established a global trend towards an increase in particularly severe floods over the course of the 20th century. This trend is consistent with the expected effects of global warming and is predicted to worsen in the 21st century. It must be taken into account that human interventions in natural river courses can also have a significant influence on the frequency and severity of floods and that increasing settlements in the vicinity of the river could further increase the damage caused by a flood.
The flood trends are very different regionally. For the Elbe and Oder , a study from 2003 found no increase, but rather a decrease in winter floods and no trend with regard to summer floods over the last 80 to 150 years. The trend in winter floods is at least partly due to the no longer freezing rivers, which in the case of ice cover can act as natural barriers and increase the extent of a flood.
The increase in gravitational mass movements is also mentioned in connection with increased amounts of precipitation, especially in combination with changes in land use .
Shift in climatic zones
For every degree Celsius of global warming, a shift in climate zones of 100–200 km to the north can be expected. According to a study published in 2015, global warming shifted the climatic zones to warmer, drier climates for 5.7% of the world's land area in the period 1950–2010.

The 13 climate zones shown resulted from the simplification of the effective climate classification according to Köppen-Geiger.
| Ice climate - polar arid (also in high mountains) |
| Tundra climate - subpolar arid (also in high mountains) |
| Snow forest climate - cold temperate humid (also in mountains) |
| Mixed forest climate - cool moderate humid (also in low mountain ranges) |
| Deciduous forest climate - cool temperate or subtropical humid (also in low mountain ranges) |
| Steppe climate - cool temperate or subtropical semi-arid |
| Desert climate - cool temperate or subtropical arid |
| Laurel forest climate - subtropical humid (also in mountains) |
| Mediterranean climate - subtropical semi-arid (also in mountains) |
| Dry forest climate - subtropical or tropical semi-humid |
| Bushland climate - subtropical or tropical semi-arid |
| Savannah climate - tropical semi-humid |
| Rainforest climate - tropical humid |
The risks to ecosystems on a warmed earth change significantly with the extent and rate of further temperature rise. Below a warming of 1 ° C, the risks are comparatively low, but they cannot be neglected for vulnerable ecosystems. Between 1 ° C and 2 ° C warming there are significant and at the regional level sometimes substantial risks. A warming above 2 ° C harbors enormous risks for the extinction of numerous animal and plant species whose habitats no longer meet their requirements. These species are displaced or can become extinct if they cannot follow the geographically rapidly shifting climatic zones. This is particularly true of the flora, so that the shift in the vegetation zones will follow significantly more slowly. Other species can spread more widely under the changed conditions. In addition, if the temperature rises above 2 ° C, there is even a threat of collapsing ecosystems, significantly increased hunger and water crises and further socio-economic damage, especially in developing countries .
The larger the transition areas (zonecotones) between the delimitable large habitats ( zonobiome ), the lower the effects of climatic changes will be. The following changes are forecast for the individual climate zones:
- Polar region → threat to biodiversity from shrinking tundras. Thawing the permafrost.
- Cold temperate climate → Increased forest fires, insect infestation and diseases. Spread of infectious diseases
- Cool temperate climate → Increased forest fires, insect infestation and diseases. In the continental middle latitudes (wheat-growing areas) droughts in summer, destabilization of ecosystems with drastic consequences for human use. In contrast, viticulture is possible in Great Britain and date palms and agaves can be used in southern Europe.
- Subtropics → The densely populated regions of the semi-arid subtropics (including the Mediterranean area, the southwestern United States, northern Mexico, southern Australia and Africa and parts of South America) will probably become even drier
- Tropics → On the one hand, the semi-arid tropics (e.g. the savannas of the Sahel) are likely to benefit from increasing rainfall, so that arable farming brings more yields. In contrast, the humid zones of the tropics, which have already largely been deforested, will continue to lose their biodiversity due to increasing drought and forest fires. Intact rainforest, on the other hand, has a balancing effect on the water balance andcopesrelatively well with rising temperatures. In this context, changes in the distribution of vegetation in mountain ranges in the tropical belt are also to be expected.
A model study published in the Proceedings of the National Academy of Sciences (PNAS) in 2007 indicates drastic consequences for living things in all climatic zones of the world under the conditions of global warming. From a biological point of view, tropical areas will probably be most affected because historically they have so far been exposed to the least fluctuations. Their adaptability is therefore rated as extremely low. By 2100, up to 39% of global land areas are threatened with the emergence of completely new types of climate, especially in the tropics and subtropics, followed by the polar regions and mountains. The previous climates could disappear on up to 48% of the land area and be replaced by others.
Animals migrate increasingly towards the poles with rising temperatures. A study of 1,700 species shows that they come closer to the poles by an average of 6.1 km per decade or retreat to higher mountain areas at 6.1 m per decade. For 279 of these species, a so-called “diagnostic fingerprint” could be determined, which almost excludes other influencing variables than climate change. For Western Europe, another study found an average upward migration of 29 m per decade for 171 plant species for the period from 1905 to 2005. Species that live in polar regions or on mountains and have no or only limited options are therefore particularly affected. A study that looked at 1,103 plant and animal species covering 20% of the earth's surface found that if there was a slight warming of 0.8 to 1.7 ° C by 2050, about 18% of the species studied would become extinct. The Potsdam climate researcher Hans Joachim Schellnhuber expects increasing devastation in certain areas of Europe. With an average warming of 1.8 to 2.0 ° C in the same period, around 24% of all species would become extinct and with a high warming of over 2 ° C it would even be around 35%.
The strategies for nature reserves, which are often aimed at preserving a state, must be reconsidered and adapted to the changed conditions. The climatic change can destroy the previous protection goals of many areas.
Forest fires

Non-man-made forest fires are natural processes that occur irregularly and take on important functions in the forest ecosystem . Due to the type of forest use and the suppression of wild fires during the 19th and 20th centuries, in many forests, especially in the USA, the amount of wood biomass in the forest has increased in some cases many times over the naturally occurring value. If a fire breaks out, this then leads to heavier and uncontrollable fires, often with fatalities and high material damage. In addition to this change from land use , global warming is also likely to be contributing to increased forest fires. A study of the western United States concludes that there was a surge in the number, severity and duration of forest fires in the mid-1980s. This increase occurred in areas relatively untouched by forest use, and it is closely related to observable rising spring and summer temperatures and an ever earlier onset of snowmelt. Although it is also possible that an as yet unknown natural cycle is the cause of these effects, the pattern of changes fits exactly into the behavior predicted by climate models.
For the future, a further shift in temperatures towards this apparently forest fire-promoting climate is expected. Since this even endangers untouched forest areas, forests artificially “filled” with wood are exposed to particularly high risks. In areas with an expected increase in precipitation days, on the other hand, less severe forest fires are likely to occur if the conditions remain unchanged. A regional study on the state of Baden-Württemberg, for example, mentions a likely increase in the risk of forest fires in the lee of the Black Forest by 2050 and a slight decrease in the north and west. Overall, the study carried out at the Potsdam Institute for Climate Impact Research expects a productivity gain in southwest German forests by half of this century, which would be primarily due to the longer vegetation period and faster growth at higher altitudes, combined with the fertilization effect of CO 2 (see also the Sections #Biomass and #Agriculture ).
The background to the increasing risk of fire, especially in forests, is the increasing saturation deficit in the air as it warms, which stimulates the evaporation of water. This leads to an increased drying of potential fuel such as wood, which in turn exponentially increases the risk of large area fires. A study published in 2019 came to the conclusion that the burned area of forest fire in California increased eightfold between 1972 and 2018 and that almost the entire increase in burned area is due to the increased saturation deficit of the air as a result of the increase in temperature. Man-made global warming has already greatly increased wildfire activity in California and will very likely increase it even further in the future.
Feedback
Some effects of global warming in turn create new influences on the extent of global warming, they act as feedback in the global climate system. Some feedback is negative; That is, the warming has cooling effects. Others are positive, so the warming increases on its own.
“The water vapor effect in the upper troposphere is the strongest known feedback process.” Over the past 35 years, the humidity at the top of the weather layer has increased by an average of around ten percent.
Careful estimates of the further release of carbon dioxide naturally forced by warming, a classic positive feedback, add up to an additional effect of 15–78 percent over the course of a century, which will further intensify climate change. This means that the warming triggered by two symbolic particles of carbon dioxide released by humans leads to the release of another particle by nature.
Biomass

Due to higher temperatures and the fertilizing effect of CO 2, some climate models calculate with increased plant growth (measured in terms of biomass ). This is also supported by observations of paleoclimatology , which assumes a relationship between biomass and temperature. These improved growth opportunities for plants lead to a negative feedback effect: the new formation of biomass represents a CO 2 sink in the climate models . The terrestrial biosphere alone absorbs approx. 20–30% of the anthropogenic CO 2 emissions and causes it to settle accumulates more slowly in the atmosphere.
For tropical forests , on the other hand, a long-term study using two areas in Panama and Malaysia has shown that an increased temperature leads to a reduction in the growth of biomass, both overall and in the majority of individual species .
An increase in plant growth in the northern hemisphere could be determined in the period from 1982 to 1991 through satellite observation. This effect occurs very differently from region to region, since the availability of water is also a prerequisite for plant growth and the distribution of rain can change as a result of climate change. In this regard, recent studies indicate that there is no net increase in biomass, since hotter summers and water shortages seem to inhibit plant growth due to the climate.
Experiments with grasses in an environment artificially enriched with CO 2 did not result in a significantly increased uptake of nitrogen by the plants. Experiments on forests artificially “fertilized” with CO 2 showed increased growth, but also showed that a possible increased uptake of organic material by the trees could be canceled out by an also increased soil respiration , so that forests are not considered to be despite additional CO 2 fertilization would act as a reinforced carbon sink.
Methane hydrates in the sea floor

Large amounts of methane are stored in the sea floor in the form of methane hydrates , which could be released in the event of strong warming. Methane hydrates are solids that enclose methane molecules in their crystal lattice made up of water molecules. They look like dirty ice and are flammable. The global methane hydrate deposits are estimated at 500–3000 GtC. For comparison: the proven coal reserves are approx. 900 Gt C. Methane hydrates, which have been formed over the course of several million years, are only stable under certain pressure and temperature conditions. The higher the ambient temperature, the higher the pressure has to be so that the methane hydrates do not dissolve. Such conditions prevail at sea depths from 500 m, in the Arctic a little closer to the sea surface.
Global warming and the associated warming of the oceans could destabilize the methane hydrates in the sea floor, which would lead to the release of large amounts of methane . However, the oceans warm more slowly than the land surface and, due to the slow mixing of the ocean, this warming only penetrates slowly to the sea floor. Therefore, the likelihood of a large and rapid release of methane within this century is very small. More significant is the risk of a slow, uncontrollable and centuries-old release of methane due to the gradual penetration of warming into the deeper ocean layers.
Permafrost soils

The polar amplification effect, particularly in the areas of the Arctic Circle, a positive feedback by the extreme rise in temperature in these latitudes, which is a multiple increase faster than the global average. The warming trend in the region between 70 ° N and 90 ° N in the years 1970–2008 was about three times the global warming trend. This leads to more forest fires and accelerates thawing processes. When thawing, thermokarsts also form , microbes become active and can produce large amounts of carbon dioxide , methane and nitrogen .
Between 13,000 and 15,000 gigatons of carbon are stored in permafrost regions in the Arctic , Antarctic and high mountains . That is about twice as much as in the entire earth's atmosphere . When the permafrost soils thaw, accelerated by climate change, it is released as the greenhouse gas CO 2 .
Methane hydrate deposits are mostly found from a depth of 300 m due to the low temperature and pressure there on the continental slopes or below continuous permafrost. Factors such as ocean currents, ocean temperatures, sediment erosion , seismics , volcanism or pingo and talik formation in perforated permafrost can form channels through which methane hydrate escapes.
As a rule , seawater absorbs methane, but uncontrolled gas fountains can also occur, which then also reach the atmosphere, as clathrates compress methane hydrate gas under high pressure. Observations show that depending on the season, methane escapes from the seabed to varying degrees and that the condition of the offshore permafrost soils in some regions also deteriorates. The global warming potential of 1 kg of methane over a period of 100 years is 25 times higher than that of 1 kg of carbon dioxide ; According to a more recent study, this factor is even 33 if interactions with atmospheric aerosols are taken into account.
Estimates of the extent of the thawing process in Siberia, Canada and similar regions far north vary, as do opinions about how much methane will ultimately be released. According to recent studies, up to 75% of the carbon stored there could be released into the atmosphere between the years 2300 and 2400. In Siberian permafrost there is a total amount of carbon that could triple the atmospheric CO 2 concentration if it were to enter the atmosphere in the form of CO 2 .
The thawing of permafrost in high mountainous regions leads to destabilization of mountain slopes and thus to landslides and rockslides .
In a 2019 article by Farquharson et al. describes the changes in the permafrost soil at three measuring stations in the Canadian High Arctic between 2003 and 2017. According to the authors, the soil in some regions of Canada often thawed as much during the study period as it would actually only for the year 2090 with a global warming of around 1.8 ° C ( according to the IPCC RCP 4.5 scenario ) ( ± 0.7 ° C) was expected.
In 2020, as a result of the heat wave in Siberia in 2020 , permafrost soil thawed, one of the reasons for the diesel oil disaster near Norilsk .
Sea ice decline
As a result of global warming, the sea ice , which covers up to 15 percent of the world's oceans, is decreasing. The oceans have a lower reflectivity ( albedo ) of sunlight than the ice surfaces, because light can penetrate deep into the uppermost water layers and is absorbed there. The oceans absorb a large part of the incoming sunlight, while the sea ice reflects up to 90% of the solar energy radiated into space . If the area of the sea ice decreases, more solar energy is absorbed and the earth warms up more. The arctic sea ice surface, which forms in winter and partly disappears again in summer, assumed the smallest extent ever measured in September 2012 at around 3.5 million km². At the beginning of the measurements in 1979 this area was still around 7.5 million km² in September. Since then, it has decreased by more than 8% every decade. Due to the decrease in sea ice and snow, among other things, the mean annual temperature in the Arctic has increased almost twice as fast as that of the rest of the world. According to various forecasts, the Arctic will warm by a further 4–7 ° C over the next 100 years.
Political, economic and social implications
health
Human health is influenced by the climate directly (through cold or heat, precipitation, floods and fire) and indirectly through ecological (e.g. temperature- related changes in the spreading areas of disease vectors , crop failures) or social consequences (e.g. drought-related migration). The temperature variability, i.e. That is, how temperatures fluctuate has an impact on human health. Adaptation to climatic conditions is more difficult in a markedly variable climate. The prognoses for the effects of future warming are fraught with great uncertainty, since the indirect consequences in particular are primarily influenced by the economic status of a region. According to the IPCC, the negative health effects of warming are very likely to outweigh the positive ones. Developing countries will be particularly hard hit.
Direct consequences
Depending on the average daily temperature, morbidity and mortality in one location have a typical U-shaped course: outside of a typical regional mean temperature range, mortality increases sharply towards increasing extremes. The deaths are not only due to heat stroke or hypothermia , but mainly to cardiovascular and respiratory causes.
The change in mortality due to global warming depends on the extent of warming, the region affected and other factors such as adaptability and demographic development. At present, winter cold in extra-tropical regions represents the greater risk of death than summer heat. In principle, an increase in heat-related and a decrease in cold-related mortality is to be expected. An estimate for 400 cities in 23 countries worldwide, which does not assume any adjustment or demographic changes, came to the result that mortality is generally increasing in North and South America, in Central and southern Europe and in Southeast Asia. For a scenario without serious climate protection with unchecked warming there is a very strong increase in mortality. In East Asia, Northern Europe and Australia, with limited warming, a slight decrease in mortality is to be expected; with a “business as usual” scenario without climate protection, the death rate will increase again in these regions in the second half of this century.
In the Persian Gulf , in regions of northern China and in densely populated regions of South Asia, such as the Ganges and Indus valleys , model calculations indicate that without effective climate protection, there is a risk of heat waves at the end of the century with cooling limit temperatures that lead to death from 35 ° C if they are exposed to humans exposed for several hours. High cooling limit temperatures occur especially in the combination of high air temperatures with high air humidity. For the time being, cooling limit temperatures have rarely risen above 31 degrees Celsius, even in the hottest regions of the world; however, in 2015 in the region around the Persian Gulf they approached the final critical value of 35 degrees Celsius. However, cooling limit temperatures of 28 ° C are difficult to bear because the body can only give off little heat. In the Mississippi Valley, a 2017 study shows that cold limit temperatures of over 28 ° C are no longer uncommon. In the future, human living space could therefore not only decrease as a result of rising sea levels, but also as a result of damp heat waves.
In Europe, significantly more people die each year from the cold than from the heat, although it should be noted that despite the vastly different average temperatures , deaths from both heat and cold occur in both Helsinki and Athens . Comparative projections of changes in cold- and heat-related mortality yield different results. Keatinge et al. (2000) e.g. B. assume that in Europe with a regional warming of less than 2 ° C, the expected increase in heat deaths due to global warming will by far be offset by the decrease in cold deaths. A simple estimate for Great Britain with such limited regional warming results in around 2,000 additional heat deaths and 20,000 fewer cold deaths. Woodward (2014), on the other hand, comes to the conclusion that by 2050 the increase in heat-related mortality will outweigh the United Kingdom.
For Germany, a study commissioned by the WWF and carried out by the Kiel Institute for the World Economy predicts that with an average emission path by the year 2100, the number of heat deaths will increase by an additional 5,000 (without taking demographic development into account) or by 12,000 (including the changed Age structures). At the same time, there would be a decrease in cold deaths by 3,000 and 5,000 respectively.
While CO 2 has an indirect impact on human health through climate change, other air pollutants that also (but to a lesser extent) influence the climate - including particulate matter or ground-level ozone - also cause considerable direct damage to health and premature death. Climate protection measures that reduce the concentration of these air pollutants are therefore associated with considerable additional benefits. At the same time, climate changes have an effect on the concentrations of these pollutants: Precipitation is the most important particulate matter sink, so dry periods increase particulate matter concentrations, high temperatures and intense solar radiation favor the formation of ground-level ozone. Climate change has probably already led to considerable damage to health, particularly through increased ozone formation, and without effective environmental and climate protection measures it will continue to increase. An analysis by the Federal Environment Agency, assuming the climate policy remains unchanged, shows 30% more days for Germany on which a threshold value of 120 micrograms of ozone per cubic meter of air is exceeded.
Indirect consequences
The indirect consequences of global warming include regional changes in health risks due to changes in the distribution area, population and infection potential of disease carriers such as mosquitoes (e.g. Anopheles , the carrier of malaria ), fleas and ticks . According to previous knowledge, the warming will most likely make some areas uninhabitable for transmitters, while others that have hitherto been uninhabitable could be opened up as new habitats by them. Whether the global spreading areas increase, decrease or stay the same depends not only on climatic factors, but also on the respective carrier and corresponding countermeasures. So the temperature plays z. B. only a subordinate role in the actual spread of malaria, since this disease was widespread in 36 US states until the 1950s and only later could it be eradicated through targeted control of the mosquitoes with DDT. In Europe, too, a renewed spread of malaria is highly unlikely, as there is a high medical standard and biological measures to combat mosquitoes are regularly carried out in some cases. Poorer countries, especially those in West and Central Africa, will be much more severely affected by a possible spread of malaria because they cannot afford countermeasures.
In addition to the pure increase in temperature, there is a high probability that the increase in wetlands caused by heavy rainfall and the thawing of permafrost regions will have an impact especially on mosquito populations. In northern Germany under the name was marching fever known malaria while effectively restricted as a side effect of draining the marshes, but the actual reduction in the risk still exists in the targeted prophylaxis especially in travelers to tropical countries. This means that the number of infected main hosts can most likely be kept low enough in the future to prevent an epidemic spread, even though the habitats of the vector are still present.
Even if Germany is not one of the declared risk areas for malaria, a warming due to warmer winters and wetter summers can, among other things, lead to a spread of tick populations, which in turn entail an increased risk of Lyme disease and early summer meningoencephalitis (TBE) . The spread of the disease itself can be restricted by both preventive measures and a vaccination against TBE. There is currently no approved vaccine against Lyme disease.
It is expected that global warming will greatly increase both the number of people affected and the severity of hay fever symptoms. According to a study published in Environmental Health Perspectives in 2016, the number of people affected who are allergic to ragweed pollen has risen from 33 million at present to around 77 million, with the greatest increases occurring in countries such as Germany, Poland and France become. The pollen season also extends in large parts of Europe to September and October.
Climate change and the increasing CO 2 concentrations themselves influence agriculture and food production, access to food and its nutrient content, with consequences for human health, depending on the region and the emission scenario . In some high latitudes, positive effects have so far been observed, overall, the negative consequences also predominated in 2014 (→ #Agriculture ).
According to a study by the World Health Organization (WHO), at least 150,000 people died annually in 2002 as a result of the indirect consequences of global warming, including food shortages, cardiovascular diseases, diarrhea, malaria and other infections. Most of the victims are in developing countries.
Agriculture
.jpg)
| Impact of global warming on potential agricultural output (2080) | |||
| country | without carbon dioxide fertilization | with carbon dioxide fertilization | |
|---|---|---|---|
| Australia | −27% | −16% | |
| Brazil | −17% | −4% | |
| China | −7% | 7% | |
| Germany | −3% | 12% | |
| France | −7% | 7% | |
| India | −38% | −29% | |
| Indonesia | −18% | −6% | |
| Italy | −7% | 7% | |
| Japan | −6% | 8th % | |
| Canada | −2% | 13% | |
| Pakistan | −30% | −20% | |
| Philippines | −23% | −12% | |
| Mexico | - 35% | −26% | |
| Russia | −8% | 6% | |
| Spain | −9% | 5% | |
| South Korea | −9% | 4% | |
| Thailand | −26% | −15% | |
| Turkey | −16% | −4% | |
| United Kingdom | −4% | 11% | |
| United States | −6% | 8th % | |
| world | −16% | −3% | |
One problem of shifting vegetation zones that directly affects humans is changes in yields from agriculture . Agricultural productivity will be affected by both a rise in temperature and a change in rainfall. In addition, it is of decisive importance whether there is a fertilization effect due to increasing carbon dioxide concentrations. Ultimately, with regard to the effects, the decisive factor is to what extent and at what cost agriculture adapts, and can and will adapt in the future, for example by using other (existing or yet to be grown) plant varieties or other cultivation practices and with what accompanying phenomena and feedbacks these Adjustment services are in turn connected. Globally, roughly speaking, one can expect an improvement in agricultural opportunities in the temperate and cooler climates and a deterioration in the tropical and subtropical areas. The fact that, under today's conditions, it is already difficult in many particularly affected regions to create a functional agricultural sector is likely to exacerbate the associated problems.
For the period 1981–2002, rising temperatures had a negative impact on global crop yields of wheat (−18.9% per year), maize (−12.5%) and barley (−8%). Lower negative and positive effects were estimated for rice (−1.6%), soybeans (+1.8%) and sorghum (−0.8%). The negative effects were more than offset by increasing carbon dioxide concentrations and technological adaptations, but in themselves they represent a loss of yield of around 40 megatons per year. Without the temperature increases since 1981, the wheat, maize and barley yields in 2002 would have been 2– 3% higher.
Laboratory experiments carried out in the 1980s on the fertilization effects of increasing carbon dioxide concentrations in the air served as parameters in estimates of the effects of global warming on earnings until a few years ago. Forecasts based on this had shown that negative earnings effects from rising temperatures would be more than offset by positive earnings effects from rising carbon dioxide concentrations. More recent field trials with the FACE technology, however, indicate that the fertilization effects derived from the laboratory experiments were overestimated by around 50%. The field trials suggest that future global warming trends will tend to have negative effects on yields despite carbon dioxide fertilization. However, this offers the opportunity to better utilize a higher carbon dioxide concentration with the help of plant breeding (including green genetic engineering ) and plant cultivation science.
As part of the fourth framework program for research and development in the field of environment and climate, the European Union has examined the effects on the EU member states and has come to the conclusion that productivity differences between different types of crops will increase. In parts of southern Europe, if an upper temperature limit is exceeded, individual plant species could fail harvests, while in Europe it may be possible to grow a wider range of species thanks to a warmer and longer vegetation period. The effects on the currently cultivated species are likely to be negative in southern Europe and positive in northern Europe.
The average expected impact of the changes in temperature and precipitation forecast by six climate models up to the 2080s on agriculture suggests a decline in potential production. The global production potential would decrease by about 16%, in developing countries by 21%, in industrialized countries by 6%. This scenario is based on the assumption that carbon dioxide fertilization will not take place due to an increased proportion of carbon dioxide in the air, and possible damage caused by extreme weather events and possible higher levels of pests and diseases are not taken into account. Should fertilization take place, the global decline in potential production is estimated at 3%. Under this scenario, the potential in industrialized countries would increase by 8%, while the production potential in developing countries would decrease by 9%. Agriculture in India would suffer massively from global warming, with declines in production potential of 30–40%. In Germany, the agricultural production potential would decrease by 3% in the absence of carbon dioxide fertilization, otherwise it would increase by 12%.
Climate change affects not only agricultural productivity, but also the nutritional value of important crops such as rice, potatoes and grain. Higher CO 2 concentrations likely to result in a lower content of proteins , micronutrients - for example, zinc and iron - and vitamin B . The vitamin E content could increase. For people suffering from protein deficiency (an estimated 700 million people worldwide), zinc deficiency (approx. 2 billion people) and iron deficiency (approx. 1.5 billion people), decreasing levels of these micronutrients in plant-based foods pose a serious risk Moreover, according to an extrapolation - assuming constant diets - with a CO 2 concentration of 550 ppm, as it could be exceeded in the second half of the 21st century, several hundred million people will additionally suffer from such a deficiency. South and Southeast Asia, Africa and the Middle East are particularly hard hit.
If, on the other hand, one considers not only climate change but also the arsenic contamination of rice fields , the rice harvest could decline by 42% by 2100.
Viticulture

Global warming affects viticulture; In the last two decades, for example, the flowering time of the vines and thus the start of ripening of the grapes in autumn has shifted forward.
Wars and violent conflicts
Since 2007, there have been increasing voices calling climate change a threat to world peace. At the suggestion of Great Britain, the UN Security Council debated this issue in April 2007. A US advisory body made up of senior ex-officers named climate change in a separate report as a threat to the security of the United States. The report sees climate change as a "hazard intensifier" and expects a. a significant increase in global migration by environmental refugees. In addition, the Intergovernmental Panel on Climate Change (IPCC) and Al Gore received the Nobel Peace Prize for their efforts to prevent further climate change. In 2014, the Pentagon also classified climate change as a threat to national security for the first time. The US Department of Defense is considering realigning the military in this regard, for example with the distribution of supplies.
The connection between climate change and violent conflict is, however, controversial. An influential study from 2009 found a strong relationship between warmer temperatures and the risk of civil war in Africa, but was criticized for methodological deficiencies. In 2013, a team of authors led by Solomon Hsiang again proclaimed in Science a robust influence of temperature and precipitation fluctuations on various forms of violence, which, however, did not prove to be robust when the research designs changed. The civil war in Darfur (from 2003) and local violent conflicts in Kenya are also linked to an increase in droughts due to climate change. However, other authors point out that environmental changes played a minor role in these conflicts at best, while poverty, political discrimination and existing conflicts were far more relevant to both the devastating aftermath of the drought and the outbreak of violence. The influence of climate change on the outbreak of the Syrian civil war (conveyed via drought-induced rural-urban migration) was recently discussed intensively.
In a fundamental study, the WBGU identifies four paths through which climate change can increase the risk of violent conflict outbreak: degradation of freshwater resources, decline in food production, climate-related increase in storm and flood disasters, and environmental migration . All four paths can both increase dissatisfaction (e.g. about higher food prices or a lack of state support) and reduce the opportunity costs for violent action (e.g. if state capacities are weakened by disasters or farmers are recruited by armed groups in times of drought due to a lack of livelihoods). In general, these paths tend to influence the risk of internal conflicts, while the influence of climate change on international wars is currently viewed as negligible. However, according to the climate researcher Jochem Marotzke, among others, climate change will primarily affect rich countries like Germany indirectly, for example through instabilities in the international arena. Authors such as Miles-Novello and Anderson also point out that rising temperatures can lead to a higher individual readiness to be aggressive, which in turn increases the likelihood of collective conflict. A meta-analysis from 2016 of 69 study results in the categories of higher temperatures, reduced precipitation, more extreme precipitation events, lower water availability, soil degradation and climate-related natural disasters shows that around half of all studies to date have a connection between climate change and violent conflict (within states), but the other half do not confirm such a link. However, methodologically improved studies published since then predominantly show that climate changes such as severe droughts increase the risk of violent conflicts, even if they are not the main driver of these conflicts. However, such a climate-conflict relationship can only arise if certain contextual factors such as ethnic discrimination or a lack of infrastructure are present. A review of the existing literature published at the end of 2017 largely confirms this finding.
However, research on the influence of climate change on violent conflicts is still not free from criticism. Five arguments are worth mentioning in this context: (1) The assumption of a climate-conflict context is based on an eco-deterministic, if not even Malthusian, worldview, serves to legitimize security interests and steers away from the real causes of violent conflicts (e.g. . Inequality and political instrumentalization). (2) The results of statistical studies are based on problematic models and incomplete data sets. (3) Individual case studies are not very suitable for making statements about the influence of climate-related changes and conflict dynamics beyond the analyzed case. (4) Research mainly looks at the influence of past environmental changes. However, the influence of climate change on these changes cannot (yet) be clearly demonstrated, while for other possible climate changes (rapidly changing monsoon dynamics, ice-free Arctic , melting of the Himalayan glaciers, rise in sea levels ) there are hardly any historical precursors. (5) So far, research has focused too much on regions in which violent conflicts already exist. This leads to a bias in the sample (since non-violent cases are underrepresented) and allows only limited insights into peaceful adaptation processes to climate change. Research on environmental peacebuilding offers promising starting points here.
Social science aspects
Energy supply and use
In the energy sector, climate change influences both demand patterns, for example due to changes in heating and cooling requirements, and the provision of useful energy by the energy industry .
It is expected that rising temperatures will reduce the performance of thermal power plants , estimates are 0.4-0.7% per 1 ° C of warming. In addition, there is a lower availability of cooling water . For example, according to a model calculation by researchers at Wageningen University , in the future in Europe and the United States, the fact that the rivers carry less water and it is warmer will reduce the capacity of the thermal power plants that rely on cooling water and the risk for a reduction in electricity production of more than 90 percent would be three times as large on average. As a result of a hot and dry summer, power plants were shut down in Europe in 2003, 2006 and 2009, and in the USA in 2007 and 2008.
For hydropower , global estimates range from no change to a loss of around 6% with unchecked greenhouse gas emissions; regionally, especially in high latitudes, 5 - 20% more energy could be obtained, in lower latitudes losses of a similar amount are possible. Statements on possible changes in average wind speeds that are important for the use of wind energy have been corrected upwards several times for Europe and North America: from ± 15% (2010) to ± 20 - ± 30% (2017). Only a few studies are available for other regions. B. for China or South Africa towards more or less constant conditions. In the case of solar energy , two opposing effects could be roughly balanced: increased solar radiation due to decreasing cloud cover and reduced efficiency due to higher temperatures. Rising temperatures, changing precipitation patterns and other factors influence the production of biomass , which is used as bioenergy (→ section #Biomass ). Statements on this are very uncertain; overall, significantly more favorable production conditions could develop in the north, while losses are to be expected in the south.
The thawing permafrost and extreme weather events endanger the operation of pipelines . The power grid is also affected by climate change: extreme weather events, for example from falling trees, freezing rain or forest fires , pose a risk to the transmission network , and rising temperatures increase transmission losses.
tourism
In tourism , there is likely to be a trend towards a shift in tourist flows in favor of the cooler areas remote from the equator and at the expense of tropical and subtropical countries with regard to summer vacations. Tourism destinations in Russia or Canada can, under certain circumstances, expect an increase in tourism volume by a third by 2025. From a scientific point of view, however, economic and population developments are likely to have even more significant effects on tourism than global warming.
Economic disadvantages are expected due to the lack of snow in ski areas, especially in areas located in low and middle locations. A study from Switzerland has shown that in winter tourism there, with a temperature increase of 2 ° C, a high loss of added value of 1.78 to 2.28 billion CHF (1.131–1.159 billion euros) per year can be expected. By way of comparison: the gross added value of winter sports in Switzerland currently amounts to around CHF 5.3 billion (around € 3.4 billion) per year. The foothills of the Alps and the canton of Jura will be particularly hard hit; according to data interpreted by Marty et al. From 2017 to 2060, a fifth of all Swiss lifts in 2018 were in areas where there would only be enough snow to operate in exceptional cases from the middle of the century.
Environmental flight and environmental migration
In regions of the world where climate change has a lasting impact on living conditions or makes it unbearable, there are increasing movements of refugees in the form of environmental refugees . This is to be expected especially in the " Third World ", where traditional habitats and vital resources such as drinking water B. by the globally rising sea level ( Bangladesh , Carteret Islands , Fiji - and Marshall Islands , Kiribati , Shishmaref ) and on the other hand z. B. are impaired or lost due to increasing water scarcity in semi-arid regions ( Africa ). Since above-average population growth is often an aggravating factor in the affected regions and the motives for migration are often not clearly identifiable (and are nowhere centrally registered), the precise quantitative recording of migrant numbers in connection with global warming will probably represent an insoluble methodological problem for the time being.
Insurance damage
| rank | hurricane | season | Cost (billion USD) |
|---|---|---|---|
| 1 | "Miami" | 1926 | 157.0 |
| 2 | "Galveston" | 1900 | 99.4 |
| 3 | Katrina | 2005 | 81.0 |
| 4th | "Galveston" | 1915 | 68.0 |
| 5 | Andrew | 1992 | 55.8 |
| 6th | "New England" | 1938 | 39.2 |
| 7th | "Pinar del Río" | 1944 | 38.7 |
| 8th | "Okeechobee" | 1928 | 33.6 |
| 9 | donna | 1960 | 26.8 |
| 10 | Camille | 1969 | 21.2 |
A November 2006 report by the United Nations Environment Program (UNEP) Finance Initiative indicated that insurance losses are currently doubling every 12 years. If this trend continues, the UNEP expects an annual loss of over one trillion dollars in three to four decades. However, as the World Meteorological Organization (WMO) makes clear, the increasing impact of tropical cyclones in recent times is primarily due to the growing concentration of population and infrastructure in coastal regions.
In 1930, fewer people lived in all 109 US counties on the Gulf and Atlantic coasts from Texas to Virginia than there are today in Miami alone . In addition, the increased general prosperity led to more expensive and more valuable houses, which is why the amount of damage caused by hurricanes is increasing every year. However, if one compares the increase in prosperity over the last century, it becomes apparent that a number of hurricanes would have caused much greater damage if they had hit the US coasts with today's prosperity. The "Miami" hurricane of 1926 would have caused damage of $ 157 billion.
In a report from 2005, the British Association of British Insurers expects insured losses to rise by two thirds by 2080 solely from storms, to an annual figure of $ 27 billion in the US, Japan and Europe markets alone. The Association believes that the damage caused by flooding in Great Britain has increased by fifteen times. The calculations are all valid for otherwise unchanged socio-economic conditions, i.e. they do not relate to aspects of population development or the trend towards settlement in attractive but particularly vulnerable coastal regions that has been observed in the recent past. A report by American insurers comes to a similar prognosis, according to which the insurance losses from hurricanes will double every ten years because the construction costs as well as the number of buildings increase and the type of construction changes.
According to the Munich Reinsurance Company, there is a clearly recognizable trend towards more severe and more costly natural disasters. The connection between these and global climate change is by no means clear, since in addition to floods and storm damage, events such as tsunamis and earthquakes are also counted. Nevertheless, according to the researchers at the Potsdam Institute for Climate Impact Research, a rising earth temperature increases the likelihood of catastrophic weather-related events. In insurance, this results in rising costs for policyholders or, in particularly endangered areas, the refusal of (re) insurers to offer insurance policies at all in view of the incalculable costs.
In 2008, natural disaster losses reached a record $ 200 billion and resulted in 220,000 deaths. The Munich Reinsurance Company clearly names climate change as the cause, although a large part of the insurance losses and casualties can be traced back to the earthquake in Sichuan .
Economic damage
There are great uncertainties when estimating the consequential costs of unchecked climate change. The German Institute for Economic Research (DIW) nevertheless estimates that damage of up to 200 trillion US dollars could occur by 2050 . The Stern Report , commissioned by the British government , states that the total costs and risks resulting from climate change correspond to a loss of 5% of the world gross domestic product today and in the long term , possibly even up to 20 % - which would roughly correspond to the consequences of the Great Depression of the 1930s. However, critics such as economist Richard Tol consider these numbers to be far exaggerated, as Stern arbitrarily counts the studies in his report that predict the most dramatic effects. In addition, Stern assumes that economic development will stagnate, whereas it is much more likely that the African countries in particular will have developed enormously by the year 2100.
In an expert survey, almost two-thirds of the participating economists said that climate change would predominantly cause damage globally now or in the next few years, another 26% that this would be the case by 2050 at the latest, only 2% believed that this would also be the case after the year 2100 the damage would not predominate. More than three quarters answered yes to the question that global warming would weaken economic growth in the long term. A total of 93% of the participating economists were in favor of measures to address climate change, while a majority considered drastic measures necessary.
The DIW and the Stern Report anticipate “effective climate protection” with annual costs of around 1% of the world's gross national product. Some economists consider this number to be too low, especially since Stern assumes exclusively optimistic estimates here too, for example that the cost of renewable energies will be reduced to one sixth of today's costs by 2050. In addition, Stern ignores the fact that the costly reduction of greenhouse gases to the 550 ppm (CO 2 equivalent) proposed by him would only delay global warming, but not stop it.
The economic follow-up costs of the release of methane gas alone when the permafrost under the East Siberian Sea is thawed in the course of global warming are estimated at 60 billion US dollars (60 billion euros) worldwide in 2013 .
The frequency of extreme weather events and the economic damage resulting from such events increased between 1960 and 2000. The main drivers were population growth and increased prosperity. There is limited evidence that economic losses adjusted for these two factors have increased due to climate change. In most cases, however, a clear connection can neither be established nor excluded.
While a long-term climate policy that promotes a decisive but gradual transition to a decarbonised economy is associated with comparatively low costs and risks, a late and abrupt implementation of effective climate protection measures can not only lead to greater climate damage, but also to massive losses in the market value of fossil fuel companies Industry and suddenly rising energy prices. There is a risk of instabilities in the financial system and the global economy via second and third round effects (see also carbon bubble ).
literature
General
- Federal Ministry for Consumer Protection, Food and Agriculture : Research Report. 1/2005: Focus: Climate change and its consequences. ISSN 0931-2277 ( PDF )
- Tim Flannery : We are weathermakers. Fischer, 2006, ISBN 3-10-021109-X .
- Jörg Phil Friedrich : What comes after climate change? A speculation Heise Medien, Hannover 2019, ISBN 978-3-95788-179-3 .
- Hartmut Graßl et al .: Weather disasters and climate change. Can we still be rescued? Pg Verlag, 2005, ISBN 3-937624-80-5 .
- Intergovernmental Panel on Climate Change : Climate Change 2007 - IPCC Fourth Assessment Report. 2007 online version . Particular attention should be paid to the report of Working Group II: Impacts, Adaptation and Vulnerability , also see online
- Claus Leggewie & Harald Welzer : The end of the world as we knew it. Climate, future and the chances of democracy. Frankfurt a. M. 2009.
- Mark Lynas: Storm warning. Reports from the hot spots of the global climate catastrophe. Riemann, Munich 2004, ISBN 3-570-50041-1
- Max Planck Institute for Meteorology : Climate Projections for the 21st Century. 2006 ( PDF, 2.0 MB )
- Hans Joachim Schellnhuber, W. Cramer, N. Nakicenovic, T. Wigley & G. Yohe (Eds.): Avoiding Dangerous Climate Change. Cambridge University Press, 2006; also as download ( Memento from February 9, 2006 in the Internet Archive )
Financial
- UNEP Finance Initiative: Adaptation and Vulnerability to Climate Change: The Role of the Finance Sector. CEO Briefing, November 2006 ( PDF )
Marine ecosystems
- Pew Center on Global Climate Change: Coral reefs & Global climate change - Potential Contributions of Climate Change to Stresses on Coral Reef Ecosystems. 2004 ( PDF )
- The Royal Society: Ocean acidification due to increasing atmospheric carbon dioxide. Policy Document 12/05, 2005 ( PDF ( Memento of October 1, 2007 in the Internet Archive ))
-
Scientific Advisory Council of the Federal Government on Global Change : The Future of the Seas - Too Warm, Too High, Too Acid. Special report, Berlin 2006 ( PDF ( Memento of January 27, 2007 in the Internet Archive )) and associated external special report:
- Keith Brander: Assessment of possible impacts of climate change on fisheries. 2006 ( PDF ( Memento from December 16, 2007 in the Internet Archive ))
- Nick Brooks, Jim Hall & Robert Nicholls (2006): Sea-Level Rise: Coastal Impacts and Responses. 2006 ( PDF ( Memento of November 10, 2007 in the Internet Archive ))
- Hans-Otto Pörtner : Effects of CO2 input and temperature increase on the marine biosphere. 2006 ( PDF )
Polar caps, permafrost and glaciers
- Arctic Climate Impact Assessment - Report of the Arctic Council on the effects of climate change (downloadable in full, English), see also Arctic Council
- Permafrost Monitoring Switzerland (PERMOS): Permafrost in the Swiss Alps 2002/03 and 2003/04. In: The Alps. No. 10, 2005, pp. 24–31 ( PDF )
- Matthew Sturm, Donald K. Perovich & Mark C. Serreze: Climate Research: Melting Ice at the North Pole. In: Spectrum of Science . March 2004, pp. 26-33
- Michael Zemp: Glaciers and climate change - Spatio-temporal analysis of glacier fluctuations in the European Alps after 1850. PhD thesis, University of Zurich. 2006 ( PDF, 7.4 MB ( Memento from February 21, 2007 in the Internet Archive ))
Extreme weather, storms, hurricanes
- Munich Reinsurance Company: Hurricanes - stronger, more frequent, more expensive. Knowledge Edition, 2006 (PDF; 3.1 MB) ( Memento from September 13, 2011 in the Internet Archive ).
- Judith A. Curry, PJ Webster & GJ Holland: Mixing Politics and Science in Testing the Hypothesis That Greenhouse Warming Is Causing a Global Increase in Hurricane Intensity. In: Bulletin of the American Meteorological Society. August 2006, pp. 1025-1037 ( PDF )
See also
- Consequences of global warming in Europe
- Effects of global warming on viticulture .
- Adaptation to global warming
- Oceanic anoxic event
Web links
- bmub.bund.de : The IPCC Intergovernmental Panel on Climate Change (with links to status reports and special reports)
- bmz.de : Climate risk management - InsuResilience initiative for climate risk insurance
- deutschlandfunk.de , Wissenschaft im Brennpunkt , May 29, 2016, Monika Seynsche : The fight for land - the world's deltas are arming themselves
- IPCC report on the consequences (long version, English)
- Consequences of climate change - information page of the Hamburg education server about climate change and its consequences
- Umweltbundesamt , Walter A. Maier et al .: Possible effects of climate changes on the spread of pathogens primarily relevant to human medicine via animal vectors and on the important human parasites in Germany. Research report 200 61 218/11, UBA-FB 000454 (PDF; 3.8 MB)
-
pik-potsdam.de : Potsdam Institute for Climate Impact Research
- Sea level rise - land under? Strategies between climate protection and protection from the climate : Lecture by Manfred Stock from PIK, June 2006 (PDF; 18 kB)
- klimahabenonline.com : Portal for the visualization of climate change in Germany in cooperation with WetterOnline , funded by the European Institute for Innovation and Technology .
- realclimate.org : English-language blog by climate researchers that explains numerous causes and consequences of global warming
- Models Provide Stormy Forecasts for the Future - Global warming will have an impact (November 29, 2014 memento in the Internet Archive ) in ACCENT Global Change Magazine for Schools, 2006. Summary of studies on hurricane activity.
- taz.de : The idyll is crumbling : About the warming of the Alps and the increasing danger of rock slides
- thelancet.com , August 2017, Giovanni Forzieri, Alessandro Cescatti, Filipe Batista e Silva, Luc Feyen: Increasing risk over time of weather-related hazards to the European population: a data-driven prognostic study (“Increasing risk for the European population in Times of weather-related hazards: a data-based prognostic study ”), doi: 10.1016 / S2542-5196 (17) 30082-7
- University of Illinois , June 29, 2006, James Kloeppel: Food-crop yields in future greenhouse-gas conditions lower than expected ("Harvest yields under future greenhouse gas conditions lower than expected")
- US Global Change Research Program reading list on hurricanes and climate change (English)
- zamg.ac.at: Climate change information portal of the Austrian Central Institute for Meteorology and Geodynamics
Individual evidence
- ↑ 4th status report of the International Panel of Climate Change (IPCC) Working Group 1 Summary for Policy-Makers, page 10 (PDF; 3.9 MB)
- ^ Will Steffen et al .: Trajectories of the Earth System in the Anthropocene. In: Proceedings of the National Academy of Sciences . August 6, 2018 doi: 10.1073 / pnas.1810141115
- ↑ Intergovernmental Panel on Climate Change (2007): Climate Change 2007 - IPCC Fourth Assessment Report. Summary for Policymakers. (PDF; 3.9 MB)
- ^ Federal Environment Agency and Max Planck Institute for Meteorology (2006): Future climate changes in Germany - Regional projections for the 21st century. , Background paper, April (PDF; 82 kB) ( Memento from September 30, 2007 in the Internet Archive )
- ↑ Stefan Schmitt: The flood of tomorrow. How high does the sea rise? The Intergovernmental Panel on Climate Change warns even more than feared in its new report. In: Die Zeit , September 26, 2019, p. 35. Online version ; accessed on September 30, 2019.
- ↑ Already 1.5 degrees more in Germany. New report shows the effects of climate change / United Nations are sounding the alarm. In: Der Tagesspiegel , November 27, 2019, p. 4.
- ↑ a b Intergovernmental Panel on Climate Change (2007a): Climate Change 2007: Climate Change Impacts, Adaptation and Vulnerability. Summary for Policymakers (PDF; 946 kB)
- ↑ Rosenzweig, Cynthia, David Karoly, Marta Vicarelli et al. (2008): Attributing physical and biological impacts to anthropogenic climate change , in: Nature , Vol. 453, pp. 353-357, doi: 10.1038 / nature06937 . See also NASA Research News: Earth Impacts Linked to Human-Caused Climate Change, May 14, 2008
- ↑ Josef Settele , Robert Scholes a. a .: 4 Terrestrial and inland water systems . In: Climate Change 2014: Impacts, Adaptation, and Vulnerability. Part A: Global and Sectoral Aspects . Contribution of Working Group II to the Fifth Assessment Report of the Intergovernmental Panel on Climate Change. 2014, 4.2 A Dynamic and Inclusive View of Ecosystems, p. 280–282 ( ipcc.ch [PDF; 10.4 MB ]).
- ^ CD Harvell, D. Montecino-Latorre et al. a .: Disease epidemic and a marine heat wave are associated with the continental-scale collapse of a pivotal predator (Pycnopodia helianthoides). In: Science Advances. 5, 2019, p. Eaau7042, doi: 10.1126 / sciadv.aau7042 .
- ↑ Mark C. Urban, Accelerating extinction risk from climate change . In: Science 348, Issue 6234, (2015), 571-573, doi: 10.1126 / science.aaa4984 .
- ↑ ACIA Scientific Report, p. 997. online ( memento of the original from October 25, 2017 in the Internet Archive ) Info: The archive link was inserted automatically and has not yet been checked. Please check the original and archive link according to the instructions and then remove this notice. (PDF; 1.1 MB)
- ↑ Jan Dönges: First mammal extinct due to climate change spectrum from June 14, 2016, accessed on March 1, 2019
- ↑ AFP / Stuttgarter Nachrichten, First mammal extinct due to climate change in: Stuttgarter Nachrichten, February 19, 2019, accessed on March 1, 2019
- ^ How Long Can the Ocean Slow Global Warming? Retrieved March 22, 2010 .
- ↑ Christopher L. Sabine, Richard A. Feely, Nicolas Gruber and others: The Oceanic Sink for Anthropogenic CO 2 . In: Science. Vol. 305, No. 5682, 2004, pp. 367-371, doi: 10.1126 / science.1097403 . (PDF; 550 kB) ( Memento from July 6, 2007 in the Internet Archive )
- ↑ a b J.-P. Gattuso et al. a .: Contrasting futures for ocean and society from different anthropogenic CO 2 emissions scenarios . In: Science . tape 349 , no. 6243 , July 2015, doi : 10.1126 / science.aac4722 .
- ↑ a b J. A. Church u. a .: Sea Level Change . In: IPCC (Ed.): Climate Change 2013: The Physical Science Basis. Contribution of Working Group I to the Fifth Assessment Report of the Intergovernmental Panel on Climate Change . 2013, chap. 13 ( PDF ).
- ↑ https://public.wmo.int/en/media/press-release/global-climate-2015-2019-climate-change-accelerates
- ↑ Meehl, Gerald A., Warren M. Washington, William D. Collins, Julie M. Arblaster, Aixue Hu, Lawrence E. Buja, Warren G. Strand and Haiyan Teng (2005): How Much More Global Warming and Sea Level Rise ? , in: Science, March 18, Vol. 307, No. 5716, pp. 1769-1772, doi: 10.1126 / science.1106663
- ↑ a b c Scientific Advisory Board of the Federal Government on Global Change (2006): The future of the seas - too warm, too high, too acidic . Special report, Berlin (PDF; 3.5 MB) ( Memento from January 27, 2007 in the Internet Archive )
- ↑ Samuel S. Patel (2006): A Sinking Feeling , in: Nature Vol. 440, April 6, pp. 734-736.
- ↑ RJ Nicholls: Synthesis of vulnerability analysis studies . 1995 (PDF; 1.1 MB)
- ^ Robert J. Nicholls and Richard SJ Tol: Impacts and responses to sea-level rise: a global analysis of the SRES scenarios over the twenty-first century. In: Phil. Trans. R. Soc. A , Volume 364, Number 1841, April 2006, pp. 1073-1095. doi: 10.1098 / rsta.2006.1754
- ↑ S. Jevrejeva et al .: Flood damage costs under the sea level rise with warming of 1.5 ◦ C and 2 ◦ C . In: Environmental Research Letters . tape 13 , 2018, doi : 10.1088 / 1748-9326 / aacc76 .
- ↑ Ryan F. Heneghan, Ian A. Hatton, Eric D. Galbraith: Climate change impacts on marine ecosystems through the lens of the size spectrum . In: Emerging Topics in Life Sciences . 2019, doi : 10.1042 / ETLS20190042 .
- ↑ Heike K. Lotze, Derek P. Tittensor, Andrea Bryndum-Buchholz, Tyler D. Eddy, William WL Cheung, Eric D. Galbraith, Manuel Barange, Nicolas Barrier, Daniele Bianchi, Julia L. Blanchard, Laurent Bopp, Matthias Büchner, Catherine M. Bulman, David A. Carozza, Villy Christensen, Marta Coll, John P. Dunne, Elizabeth A. Fulton, Simon Jennings, Miranda C. Jones, Steve Mackinson, Olivier Maury, Susa Niiranen, Ricardo Oliveros-Ramos, Tilla Roy , José A. Fernandes, Jacob Schewe, Yunne-Jai Shin, Tiago AM Silva, Jeroen Steenbeek, Charles A. Stock, Philippe Verley, Jan Volkholz, Nicola D. Walker, Boris Worm: Global ensemble projections reveal trophic amplification of ocean biomass declines with climate change . In: Proceedings of the National Academy of Sciences . June 2019, doi : 10.1073 / pnas.1900194116 .
- ↑ Christopher M. Free, James T. Thorson, Malin L. Pinsky, Kiva L. Oken, John Wiedenmann, Olaf P. Jensen: Impacts of historical warming on marine fisheries production . In: Science . March 2019, doi : 10.1126 / science.aau1758 .
- ↑ DLF24 : Gulf of Oman - "death zones" without oxygen larger than expected . In: Deutschlandfunk . 2018 ( deutschlandfunk.de [accessed April 27, 2018]).
- ↑ World Meteorological Organization (ed.): WMO Statement on the State of the Global Climate in 2019 . 2020, Deoxygenation, p. 13-14 ( wmo.int ).
- ↑ a b c Summary for Policymakers . In: Hans-Otto Pörtner , Debra C. Roberts, Valérie Masson-Delmotte , Panmao Zhai, Melinda Tignor, Elvira Poloczanska, Katja Mintenbeck, Maike Nicolai, Okem Andrew, Jan Petzold, Bard Rama, Nora Weyer (eds.): IPCC Special Report on the Ocean and Cryosphere in a Changing Climate . 2019, Box 5.4, 5.4.2, 6.4.2.
- ↑ Landsberg JH (2002). The effects of harmful algal blooms on aquatic organisms . Reviews in Fisheries Science, 10 (2): 113-390.
- ^ Fu FX, Place AR, Garcia NS, Hutchins DA: CO 2 and phosphate availability control the toxicity of the harmful bloom dinoflagellate Karlodinium veneficum. In: Aquat Microb Ecol. 2010; 59: 55-65.
- ^ Tatters AO, Flewelling LJ, Fu F, Granholm AA, Hutchins DA: High CO 2 promotes the production of paralytic shellfish poisoning toxins by Alexandrium catenella from Southern California waters. In: Harmful Algae. 2013; 30: 37-43.
- ↑ Gustaaf M. Hallegraeff: Climate Change and Marine and Freshwater Toxins. De Gruyter, 2015, ISBN 978-3-11-033359-6 (accessed from De Gruyter Online).
- ↑ Terry P. Hughes, Andrew H. Baird, Elizabeth A. Dinsdale, Natalie A. Moltschaniwskyj, Morgan S. Pratchett, Jason E. Tanner, Bette L. Willis: Assembly Rules of Reef Corals Are Flexible along a Steep Climatic Gradient. Current Biology, online April 12, 2012.
- ^ TP Hughes, AH Baird, DR Bellwood, M. Card, SR Connolly, C. Folke, R. Grosberg, O. Hoegh-Guldberg, JBC Jackson, J. Kleypas, JM Lough, P. Marshall, M. Nyström, SR Palumbi, JM Pandolfi, B. Rosen, J. Roughgarden: Climate Change, Human Impacts, and the Resilience of Coral Reefs. Science 301, 2003, 929-933.
- ↑ Terry P. Hughes et al .: Global warming and recurrent mass bleaching of corals . In: Nature . tape 543 , 2017, p. 373-377 , doi : 10.1038 / nature21707 .
- ↑ Rahmstorf, Stefan (2002): Ocean circulation and climate during the past 120,000 years , in: Nature 419, pp. 207–214 (PDF; 340 kB)
- ↑ Rahmstorf, Stefan (2006): Thermohaline Ocean Circulation , in: Encyclopedia of Quaternary Sciences, Edited by SA Elias. Elsevier, Amsterdam (PDF; 3.2 MB) ( Memento from July 3, 2007 in the Internet Archive )
- ^ L. Caesar, S. Rahmstorf, A. Robinson, G. Feulner, V. Saba: Observed fingerprint of a weakening Atlantic Ocean overturning circulation . In: Nature . tape 556 , no. 7700 , April 2018, p. 191-196 , doi : 10.1038 / s41586-018-0006-5 .
- ↑ David JR Thornalley, Delia W. Oppo, Pablo Ortega, Jon I. Robson, Chris M. Brierley, Renee Davis, Ian R. Hall, Paola Moffa-Sanchez, Neil L. Rose, Peter T. Spooner, Igor Yashayaev, Lloyd D. Keigwin: Anomalously weak Labrador Sea convection and Atlantic overturning during the past 150 years . In: Nature . tape 556 , no. 7700 , April 2018, p. 227 , doi : 10.1038 / s41586-018-0007-4 .
- ↑ a b c d WMO-IWTC: Summary Statement on Tropical Cyclones and Climate Change, 2006. (PDF; 78 kB) ( Memento of the original from March 25, 2009 in the Internet Archive ) Info: The archive link was inserted automatically and has not yet been checked . Please check the original and archive link according to the instructions and then remove this notice.
- ↑ P. Chylek, G. Lesins (2008): Multidecadal variability of Atlantic hurricane activity: 1851-2007, J. Geophys. Res. 113, D22106, doi: 10.1029 / 2008JD010036 .
- ↑ David B. Enfield, Luis Cid-Serrano (2009): Secular and multidecadal warmings in the North Atlantic and their relationships with major hurricane activity . International Journal of Climatology (in press). doi: 10.1002 / joc.1881
- ↑ James P. Kossin, Kenneth R. Knapp, Timothy L. Olander, Christopher S. Velden: Global increase in major tropical cyclone exceedance probability over the past four decades . In: Proceedings of the National Academy of Sciences . May 2020, doi : 10.1073 / pnas.1920849117 . See also the message: Longer period of record reveals increases in storm intensity. NOAA, May 19, 2020, accessed August 27, 2020 .
- ↑ James B. Elsner: Continued Increases in the Intensity of Strong Tropical Cyclones . In: Bulletin of the American Meteorological Society . tape 101 , no. August 8 , 2020, doi : 10.1175 / BAMS-D-19-0338.1 (open access).
- ↑ Kerry Emanuel (2005): Increasing destructiveness of tropical cyclones over the past 30 years . In: Nature, July 31, doi: 10.1038 / nature03906
- ↑ A NOAA-led team of scientists has found that the apparent increase in the number of tropical storms and hurricanes since the late 19th and early 20th centuries is likely attributable to improvements in observational tools and analysis techniques that better detect short-lived storms . In: Study: Better Observations, Analyzes Detecting Short-Lived Tropical Systems, NOAA website, August 11, 2009 Archived copy ( Memento of August 15, 2009 in the Internet Archive )
- ↑ CW Landsea et al. (2004): The Atlantic hurricane database re-analysis project: Documentation for the 1851-1910 alterations and additions to the HURDAT database . In: RJ Murname, K.-B. Liu: Hurricanes and Typhoons: Past, Present and Future . New York: Columbia University Press, pp. 177-221, ISBN 0-231-12388-4 .
- ↑ CW Landsea et al. (2009): Impact of Duration Thresholds on Atlantic Tropical Cyclone Counts . In: Journal of Climate Early Online Releases, doi: 10.1175 / 2009JCLI3034.1 .
- ^ TA McCloskey and G. Keller (2008): 5000 year sedimentary record of hurricane strikes on the central coast of Belize . In: Quaternary International (in press). doi: 10.1016 / j.quaint.2008.03.003 .
- ↑ Kam-biu Liu et al. (2001): A 1,000-Year History of Typhoon Landfalls in Guangdong, Southern China, Reconstructed from Chinese Historical Documentary Records . In: Annals of the Association of American Geographers 91 (3), pp. 453-464. doi: 10.1111 / 0004-5608.00253
- ↑ Kam-biu Liu and Miriam L. Fearn (2000): Reconstruction of Prehistoric Landfall Frequencies of Catastrophic Hurricanes in Northwestern Florida from Lake Sediment Records . In: Quaternary Research 54 (2), pp. 238-245. doi: 10.1006 / qres.2000.2166 .
- ↑ a b R. Iestyn Woolway, Benjamin M. Kraemer, John D. Lenters, Christopher J. Merchant, Catherine M. O'Reilly, Sapna Sharma: Global lake responses to climate change . In: Nature Reviews Earth & Environment . July 14, 2020, doi : 10.1038 / s43017-020-0067-5 .
- ^ Benjamin M. Kraemer, Thomas Mehner, Rita Adrian: Reconciling the opposing effects of warming on phytoplankton biomass in 188 large lakes . In: Scientific Reports . 2017, doi : 10.1038 / s41598-017-11167-3 .
- ↑ a b Xiao Yang, Tamlin M. Pavelsky, George H. Allen: The past and future of global river ice . In: Nature . January 2020, doi : 10.1038 / s41586-019-1848-1 . See also the message: Sarah Derouin: River ice is disappearing . In: Eos . February 2020, doi : 10.1029 / 2020EO140159 .
- ↑ Sapna Sharma, Kevin Blagrave, John J. Magnuson, Catherine M. O'Reilly, Samantha Oliver, Ryan D. Batt, Madeline R. Magee, Dietmar Straile, Gesa A. Weyhenmeyer, Luke Winslow, R. Iestyn Woolway: Widespread loss of lake ice around the Northern Hemisphere in a warming world . In: Nature Climate Change . January 2019, doi : 10.1038 / s41558-018-0393-5 . See also the message: Matt McGrath: Lakes 'skating on thin ice' as warming limits freeze. In: BBC News. January 28, 2019, accessed February 23, 2020 .
- ↑ The Copenhagen Diagnosis, page 41 (PDF; 3.5 MB)
- ↑ L. Olsson, L. Eklundh and J. Ardö (November 2005): “A recent greening of the Sahel trends, patterns and potential causes”. In: Journal of Arid Environments 63 (3), pp. 556-566. doi: 10.1016 / j.jaridenv.2005.03.008
- ↑ SAHEL DROUGHT: PAST PROBLEMS, AN UNCERTAIN FUTURE (PDF; 967 kB) NOAA. Retrieved January 26, 2013.
- ↑ H. Paeth: Climate change in Africa: physical-geographical findings and climate model simulations. In Africa. Editors: R. Glaser, K. Kremb, a. Thresher. 2nd edition 2011
- ↑ Peter D. Noerdlinger; Kay R. Brower (2007): The melting of floating ice raises the ocean level . In: The Geophysical Journal International, 170, pp. 145–150, doi: 10.1111 / j.1365-246X.2007.03472.x (PDF; 343 kB)
- ^ Stefan Rahmstorf, Hans-Joachim Schellnhuber: The climate change . 2006, p. 64 .
- ↑ Oppenheimer, Michael (2006): Ice Sheets and Sea Level Rise: Model Failure is the Key Issue , guest post at RealClimate.org , see online
- ^ V. Helm, A. Humbert, H. Miller: Elevation and elevation change of Greenland and Antarctica derived from CryoSat-2 . In: The Cryosphere . 8, 2014, pp. 1539–1559. doi : 10.5194 / tc-8-1539-2014 .
- ↑ Climate change: When villages melt sueddeutsche.de February 20, 2007
- ↑ Schneider, DP, EJ Steig, TD van Ommen, DA Dixon, PA Mayewski, JM Jones, and CM Bitz (2006): Antarctic temperatures over the past two centuries from ice cores , in: Geophysical Research Letters, 33, L16707, doi : 10.1029 / 2006GL027057
- ↑ Chapman, WL and Walsh, JE 2007. A synthesis of Antarctic temperatures . Journal of Climate 20: 4096-4117.
- ↑ NASA / Grace (2006): NASA Mission Detects Significant Antarctic Ice Mass Loss. News release, March 2nd
- ^ University of Illinois, Urbana-Champaign's Polar Research Group
- ↑ NSIDC Southern Hemisphere Sea Ice Area ( Memento of the original from January 13, 2008 in the Internet Archive ) Info: The archive link was inserted automatically and has not yet been checked. Please check the original and archive link according to the instructions and then remove this notice.
- ↑ Powell, Dylan C., Thorsten Markus and Achim Stössel (2005): Effects of snow depth forcing on Southern Ocean sea ice simulations , in: Geophysical Research Letters, Vol. 110, C06001, doi: 10.1029 / 2003JC002212 (PDF, preprint; 3.6 MB) . See also: American Geophysical Union and NASA joint press release: Warmer Air May Cause Increased Antarctic Sea Ice Cover ( March 3, 2008 memento in the Internet Archive ) June 29, 2005, and NASA Feature: Sea Ice May Be on Increase in the Antarctic: A Phenomenon Due to a Lot of 'Hot Air'? 16 August 2005
- ^ Badische Zeitung , Panorama , July 25, 2013, dpa : badische-zeitung.de: Permafrost is melting faster and faster (July 26, 2013)
- ↑ Arctic Climate Impact Assessment (2005): Arctic Climate Impact Assessment . Cambridge University Press, ISBN 0-521-61778-2 , see online
- ↑ National Snow and Ice Data Center (NSIDC): Arctic Sea Ice News Fall 2007
- ↑ NASA (2006): Arctic Ice Meltdown Continues With Significantly Reduced Winter Ice Cover , September 13th feature, see online
- ↑ Serreze, Mark C., Marika M. Holland and Julienne Stroeve (2007): Perspectives on the Arctic's Shrinking Sea-Ice Cover , in: Science, Vol. 315., No. 5818, pp. 1533-1536, doi: 10.1126 /science.1139426
- ↑ Holland, MM, CM Bitz and B. Tremblay (2006): Future abrupt reductions in the Summer Arctic sea ice , in: Geophysical Research Letters ( PDF ( Memento from June 13, 2010 in the Internet Archive ))
- ↑ Chen, JL, CR Wilson and BD Tapley (2006): Satellite Gravity Measurements Confirm Accelerated Melting of Greenland Ice Sheet , in: Science, published online on August 10, 10, Science doi: 10.1126 / science.1129007
- ↑ Dim Coumou, Alexander Robinson, Stefan Rahmstorf: Global increase in record-breaking monthly mean temperatures . In: Climatic Change . 118, No. 3-4, June 2013, pp. 771-782. ISSN 0165-0009 . doi : 10.1007 / s10584-012-0668-1 .
- ^ JE Hansen, M. Sato, R. Ruedy : Perception of climate change . In: Proceedings of the National Academy of Sciences . 109, No. 37, September 11, 2012, pp. E2415-E2423. ISSN 0027-8424 . doi : 10.1073 / pnas.1205276109 .
- ↑ Four Degree Dossier for the World Bank: Risks of a Future Without Climate Protection . Potsdam Institute for Climate Impact Research. November 19, 2012. Retrieved January 5, 2014.
- ↑ Oerlemans, Johannes Hans (2005): Extracting a Climate Signal from 169 Glacier Records , in: Science Express, March 3, doi: 10.1126 / science.1107046
- ↑ Dyurgerov, Mark B. and Mark F. Meier (2005): Glaciers and the Changing Earth System: A 2004 Snapshot . Institute of Arctic and Alpine Research, Occasional Paper 58 (PDF; 2.6 MB)
- ^ Rühland, K., NR Phadtare, RK Pant, SJ Sangode, and JP Smol (2006): Accelerated melting of Himalayan snow and ice triggers pronounced changes in a valley peatland from northern India , In: Geophys. Res. Lett. , 33, L15709, doi: 10.1029 / 2006GL026704 .
- ^ HJ Fowler and DR Archer (2006): Conflicting Signals of Climatic Change in the Upper Indus Basin . In: Journal of Climate 19 (17), pp. 4276-4293. doi: 10.1175 / JCLI3860.1
- ↑ Christian Schneebergera, Heinz Blattera, Ayako Abe-Ouchib and Martin Wild (2003): Modeling changes in the mass balance of glaciers of the northern hemisphere for a transient 2 × CO 2 scenario . In: Journal of Hydrology 282 (1-4), November 10, 2003, pp. 145-163. doi: 10.1016 / S0022-1694 (03) 00260-9
- ↑ TP Barnett, JC Adam and DP Lettenmaier (2005): Potential impacts of a warming climate on water availability in snow-dominated regions . In: Nature 438, pp. 303-309. doi: 10.1038 / nature04141
- ↑ Union of Concerned Scientists (2005): Early Warning Signs: Spring Comes Earlier , online text
- ↑ Root, Terry L., Dena P MacMynowski, Michael D. Mastrandrea and Stephen H. Schneider (2005): Human-modified temperatures induce species changes: Joint attribution , in: Proceedings of the National Academy of Sciences (PNAS), Vol. 102, No. 21, May 24, pp. 7465–7469, see online (Open Access)
- ↑ a b Walther, GR, E. Post, P. Convey, A. Menzel, C. Parmesan, TJC Beebee, JM Fromentin, O. Hoegh-Guldberg, F. Bairlein (2002): Ecological responses to recent climate change , in: Nature, Vol. 416, p. 389-395, see online
- ↑ Keeling, CD, JFS Chin, TP Whorf (1996): Increased activity of northern vegetation inferred from atmospheric CO 2 measurements , in: Nature 382, 146-149, doi: 10.1038 / 382146a0
- ↑ Visser, Marcel E., Frank Adriaensen, Johan H. van Balen et al. (2003): Variable responses to large-scale climate change in European Parus populations , in: Proceedings of the Royal Society B: Biological Sciences, Vol. 270, No. 1513 / February 22, 22, pp. 367-372 doi: 10.1098 /rspb.2002.2244 . See also Science News ( Memento from April 15, 2008 in the Internet Archive )
- ↑ X. u. Lian, Shilong Piao et al. a .: Summer soil drying exacerbated by earlier spring greening of northern vegetation. In: Science Advances. 6, 2020, p. Eaax0255, doi : 10.1126 / sciadv.aax0255 .
- ↑ Magnuson, John, Dale M. Robertson, Barbara J. Benson et al. (2000): Historical Trends in Lake and River Ice Cover in the Northern Hemisphere , in: Science, Vol. 289, No. 5485, pp. 1743–1746, September 8, doi: 10.1126 / science.289.5485.1743
- ↑ UNEP GRID Arendal: Changing Weather
- ↑ NOAA Geophysical Fluid Dynamics Laboratory: GFDL R30 Podel projected Climate Changes: Year 2050
- ↑ Timothy J Osborn, Mike Hulme, Philip D Jones, Tracy A Basnett: Observed trends in the daily intensity of United Kingdom precipitation . In: International Journal of Climatology . tape 20 , no. 4 , March 30, 2000, pp. 347-364 , doi : 10.1002 / (SICI) 1097-0088 (20000330) 20: 4 <347 :: AID-JOC475> 3.0.CO; 2-C .
- ↑ Frich, P., LV Alexander, P. Della-Marta, B. Gleason, M. Haylock, AMG Klein Tank and T. Peterson (2002): Observed coherent changes in climatic extremes during the second half of the twentieth century , in : Climate Research, pp. 193–212, V.19 (PDF; 2.6 MB) ( Memento from March 19, 2012 in the Internet Archive )
- ^ UK Department for Environment Food and Rural Affairs and UK Department for International Development (2004): African Climate Report. A report commissioned by the UK Government to review African climate science, policy and options for action (PDF) ( Memento of February 14, 2006 in the Internet Archive )
- ↑ Meredith, Edmund ( Helmholtz Center for Ocean Research ) et al. in Nature Geoscience : Crucial role of Black Sea warming in amplifying the 2012 Krymsk precipitation extreme Our results reveal a physical mechanism linking a sudden amplificat ion of coastal convective precipitation extremes to gradual SST increase. The increased lower tropospheric humidity provides a richer moisture source for convective precipitation and contributes to low-level instability. More importantly, the near-surface warming reduces static stability, allowing deep convection to be more easily triggered. published on July 13, 2015
- ↑ Der Spiegel : The ocean warming brought the floods of July 14, 2015, accessed on July 15, 2015
- ^ Paul J. Durack, Susan E. Wijffels and Richard J. Matear. Ocean Salinities Reveal Strong Global Water Cycle Intensification During 1950 to 2000. Science 2012. doi: 10.1126 / science.1212222 .
- ↑ scinexx: Climate change stimulates the water cycle more than expected
- ↑ Zbigniew W. Kundzewicz et al. : Trend detection in river flow series . In: Hydrological Sciences Journal , Vol. 50 (5), 797-810 & 811-824. 1. Annual maximum flow & 2. Flood and low-flow index series
- ↑ PCD Milly, RT Wetherald, KA Dunne, TL Delworth (2002): Increasing risk of great floods in a changing climate , in: Nature, January 31, pp. 514-517, V. 415, doi: 10.1038 / 415514a
- ↑ Mudelsee, M., M. Börngen, G. Tetzlaff and U. Grünewald (2003): No upward trends in the occurrence of extreme floods in central Europe , in: Nature, Vol. 421, pp. 166–169, doi: 10.1038 / nature01928
- ^ MJ Crozier (2010): Deciphering the effect of climate change on landslide activity: A review , in: Geomorphology, 124 (3–4): 260–267. doi: 10.1016 / j.geomorph.2010.04.009
- ↑ M. Dehn, G. Bürger, J. Buma, P. Gasparetto (2000): Impact of climate change on slope stability using expanded downscaling , in: Engineering Geology, 55 (3): 193-204. doi: 10.1016 / S0013-7952 (99) 00123-4
- ↑ L. Borgatti, M. Soldati (2010): Landslides as a geomorphological proxy for climate change: A record from the Dolomites (northern Italy) , in: Geomorphology, 120 (1-2): 56-64. doi: 10.1016 / j.geomorph.2009.09.015
- ↑ M. Jakob, S. Lambert (2009): Climate change effects on landslides along the southwest coast of British Columbia , in: Geomorphology, 107 (3-4): 275-284. doi: 10.1016 / j.geomorph.2008.12.009
- ^ Statement by the Federal Ministry for Education and Research in Heinz Nolzen (Ed.): "Handbuch des Geographieunterrichts, Vol. 12/2, Geozonen", Aulis Verlag Deubner & Co. KG, Cologne 1995
- ↑ Duo Chan and Qigang Wu: Significant anthropogenic-induced changes of climate classes since 1950 . In: Nature Scientific Reports . August 28, 2015, doi : 10.1038 / srep13487 ( HTML ).
- ^ Hare, William (2003): Assessment of Knowledge on Impacts of Climate Change - Contribution to the Specification of Art. 2 of the UNFCCC. External expertise for the WBGU special report “World in Transition: Thinking beyond Kyoto. Climate protection strategies for the 21st century " (PDF; 1.7 MB) ( Memento from December 13, 2007 in the Internet Archive )
- ↑ Hare, William (2005): Relationship between increases in global mean temperature and impacts on ecosystems, food production, water and socio-economic systems (PDF; 393 kB) ( Memento from September 28, 2007 in the Internet Archive )
- ↑ J. Schultz: "The Earth's Eco Zones" Ulmer, Stuttgart 2008, ISBN 978-3-8252-1514-9
- ↑ a b Heinz Nolzen (Ed.): "Handbuch des Geographieunterrichts, Vol. 12/2, Geozonen", Aulis Verlag Deubner & Co. KG, Cologne 1995
- ↑ a b c d article: "Forests in climate change" on the Hamburg education server, accessed in January 2013
- ↑ a b Homepage of Martin R. Textor, Institute for Education and Future Research (IPZF), Würzburg , queried in January 2013
- ↑ Article "The tropics expand northwards" in the world of December 4, 2007
- ↑ Naia Morueta-Holme, Kristine Engemann, Pablo Sandoval-Acuña, Jeremy D. Jonas, R. Max Segnitz, Jens-Christian Svenning: Strong upslope shifts in Chimborazo's vegetation over two centuries since Humboldt . In: PNAS . 112, No. 41, October 2015, pp. 12741–12745. doi : 10.1073 / pnas.1509938112 .
- ↑ Williams, John W., Stephen T. Jackson and John E. Kutzbach (2007): Projected distributions of novel and disappearing climates by 2100 AD , in: Proceedings of the National Academy of Sciences, 104 (13), March 27, doi: 10.1073 / pnas.0606292104
- ↑ Parmesan, Camille and Gary Yohe (2003): A globally coherent fingerprint of climate change impacts across natural systems , in: Nature, Vol. 421, January 2, pp. 37-42 archive link ( Memento of the original from September 11, 2006 in the Internet Archive ) Info: The archive link was inserted automatically and has not yet been checked. Please check the original and archive link according to the instructions and then remove this notice. (PDF)
- ↑ Lenoir, J., JC Gégout, PA Marquet, P. de Ruffray and H. Brisse (2008): A Significant Upward Shift in Plant Species Optimum Elevation During the 20th Century , in: Science, Vol. 320, No. 5884, Pp. 1768–1771, June 27, doi: 10.1126 / science.1156831
- ↑ MAZonline: Potsdam climate researcher warns of deserts in Europe . September 11, 2017 ( planet earth out of balance ).
- ↑ Thomas, CD et al. (2004): Extinction risk from climate change , in Nature, Vol. 427, pp. 145-148, see online
- ↑ Diamond, Jared (2006): Collapse - How Societies Choose to Fail or Succeed , Penguin Books, Reprint January, ISBN 0-14-303655-6
- ↑ Westerling, Anthony Leroy, Hugo G. Hidalgo, Daniel R. Cayan and Thomas W. Swetnam (2006): Warming and Earlier Spring Increases Western US Forest Wildfire Activity , in: Science, online publication July 6, doi: 10.1126 /science.1128834
- ↑ Stock, Manfred (Ed.) (2005): KLARA - Climate Change - Effects, Risks, Adaptation . PIK Report No. 99 (PDF; 11.6 MB)
- ↑ A. Park Williams et al .: Observed Impacts of Anthropogenic Climate Change on Wildfire in California . In: Earth's Future . 2019, doi : 10.1029 / 2019EF001210 .
- ↑ Brian Soden. In: Volker Mrasek : deutschlandfunk.de: Increase in water vapor in the atmosphere . Deutschlandfunk , Research News, July 29, 2014
- ↑ Volker Mrasek: deutschlandfunk.de: Increase in water vapor in the atmosphere . Deutschlandfunk , Research News, July 29, 2014
- ↑ Scheffer, M., V. Brovkin, and P. Cox (2006): Positive feedback between global warming and atmospheric CO 2 concentration inferred from past climate change , in: Geophysical Research Letters, 33, L10702, doi: 10.1029 / 2005GL025044
- ↑ Climate model of the University of Bern, Ben Matthews (2002), online version ( Memento of the original from March 11, 2006 in the Internet Archive ) Info: The archive link was inserted automatically and has not yet been checked. Please check the original and archive link according to the instructions and then remove this notice.
- ↑ JG Canadell, C. Le Quéré, MR Raupach, CB Field, ET Buitenhuis, P. Ciais, TJ Conway, NP Gillett, RA Houghton, G. Marland (2007): Contributions to accelerating atmospheric CO 2 growth from economic activity, carbon intensity, and efficiency of natural sinks , in: PNAS, Vol. 104, No. 47, pp. 18866-18870. doi: 10.1073 / pnas.0702737104
- ↑ Kenneth J. Feeley, S. Joseph Wright, MN Nur Supardi, Abd Rahman Kassim, Stuart J. Davies (2007): Decelerating growth in tropical forest trees. Ecology Letters, Volume 10, Issue 6, pp. 461-469. doi: 10.1111 / j.1461-0248.2007.01033.x
- ^ RB Myneni, CD Keeling, CJ Tucker, G. Asrar & RR Nemani (1997): Increased plant growth in the northern high latitudes from 1981 to 1991 , in: Nature 386, 698-702, April 17, see online
- ↑ Angert, A., S. Biraud, C. Bonfils, CC Henning, W. Buermann, J. Pinzon, CJ Tucker and I. Fung (2005): Drier summers cancel out the CO 2 uptake enhancement induced by warmer springs , in : PNAS, Vol. 102, No. 31, August 2, see online
- ↑ Flurin Babst, Olivier Bouriaud, Benjamin Poulter, Valerie Trouet, Martin P. Girardin, David C. Frank: Twentieth century redistribution in climatic drivers of global growth tree. In: Science Advances. 5, 2019, p. Eaat4313, doi: 10.1126 / sciadv.aat4313 .
- ↑ Gorissena, A. and MF Cotrufo (1999): Elevated Carbon Dioxide Effects on Nitrogen Dynamics in Grasses, with Emphasis on Rhizosphere Processes , in: Soil Science Society of America Journal, No. 63, pp. 1695–1702, see online ( memento of the original dated November 5, 2012 in the Internet Archive ) Info: The archive link was automatically inserted and not yet checked. Please check the original and archive link according to the instructions and then remove this notice. (PDF; 29 kB)
- ↑ Allen, AS, JA Andrews, AC Finzi, R. Matamala, DD Richter and WH Schlesinger (1999): Effects of Free Air CO 2 -Enrichment (FACE) on Belowground Processes in a PINUS TAEDA Forest , in: Ecological Applications, Vol 10, no. 2, pp. 437-448, doi : 10.1890 / 1051-0761 (2000) 010 [0437: EOFACE] 2.0.CO; 2
- ↑ B. Buffet, D. Archer (2004): Global inventory of methane clathrate: sensitivity to changes in the deep ocean , in: Earth and Planetary Science Letters, Vol. 227, pp. 185-199, (PDF; 610 kB)
- ↑ AV Milkov (2004): Global estimates of hydrate-bound gas in marine sediments: how much is really out there? , in: Earth-Science Reviews, Vol. 66, pp. 183-197
- ^ BP (2006): Quantifying energy - BP Statistical Review of World Energy , June 2006, PDF
- ↑ M. Davie, B. Buffet (2001): A numerical model for the formation of gas hydrate below the seafloor , in: Journal of Geophysical Research, Vol. 106, pp. 185-199, [1] (PDF)
- ↑ Deutschlandfunk , Wissenschaft im Brennpunkt , August 7, 2016, Andrea Rehmsmeier : On thin ice (November 5, 2016)
- ↑ ipa.arcticportal.org: International Permafrost Association (November 5, 2016)
- ↑ Alexey Portnov, Andrew J. Smith et al .: Offshore permafrost decay and massive seabed methane escape in water depths> 20 m at the South Kara Sea shelf . tape 40 . GRL, 2013, p. 3962-3967 , doi : 10.1002 / grl.50735 . Online PDF
- ↑ Walter, KM, SA Zimov, JP Chanton, D. Verbyla and FS Chapin: Methane bubbling from Siberian thaw lakes as a positive feedback to climate warming . In: Nature . 443, 2006, pp. 71-75. doi : 10.1038 / nature05040 .
- ↑ P. Forster, P., V. Ramaswamy et al .: Changes in Atmospheric Constituents and in Radiative Forcing . Science 326 edition. Cambridge University Press, Cambridge and New York 2007, 2007, ISBN 978-0-521-88009-1 , pp. 212 . Online (PDF; 8 MB)
- ^ Drew T. Shindell *, Greg Faluvegi, Dorothy M. Koch, Gavin A. Schmidt , Nadine Unger, Susanne E. Bauer: Improved attribution of climate forcing to emissions . Science 326 edition. AAAS, 2009, p. 716-718 , doi : 10.1126 / science.1174760 . On-line
- ↑ Global warming time bomb trapped in Arctic soil: study ( Memento of November 3, 2011 in the Internet Archive )
- ↑ Khvorostyanov, DV, P. Ciais, G. Krinner, and SA Zimov (2008) Vulnerability of east Siberia's frozen carbon stores to future warming in Geophys. Res. Lett. , 35, L10703, (PDF; 1.4 MB) doi: 10.1029 / 2008GL033639
- ↑ ScienceDaily.com
- ↑ Slipping mountain slopes by thawing the permafrost ( Memento from December 29, 2007 in the Internet Archive )
- ^ A b Louise M. Farquharson, Vladimir E. Romanovsky, William L. Cable, Donald A. Walker, Steven Kokelj, Dimitry Nicolsk: Climate change drives widespread and rapid thermokarst development in very cold permafrost in the Canadian High Arctic . In: Geophysical Research Letters . June 2019, doi : 10.1029 / 2019GL082187 .
- ↑ IPCC: Table SPM-2, in: Summary for Policymakers. In: Climate Change 2013: The Physical Science Basis. Contribution of Working Group I to the Fifth Assessment Report of the Intergovernmental Panel on Climate Change.
- ↑ National Snow an Ice Data Center (2005): Sea Ice Decline Intensifies , see online (PDF; 334 kB)
- ↑ Arctic Climate Impact Assessment: Impacts of a Warming Arctic (2004) (PDF; 14.7 MB) (p. 10)
- ↑ a b c Kirk R. Smith and Alistair Woodward: Human Health: Impacts, Adaptation, and Co-Benefits . In: CB Field et al. (Ed.): Climate Change 2014: Impacts, Adaptation, and Vulnerability. Part A: Global and Sectoral Aspects. Contribution of Working Group II to the Fifth Assessment Report of the Intergovernmental Panel on Climate Change . 2014 ( ipcc.ch [PDF]).
- ↑ Intergovernmental Panel on Climate Change (2007b): Human health. Climate Change 2007: Impacts, Adaptation and Vulnerability. Contribution of Working Group II to the Fourth Assessment Report of the Intergovernmental Panel on Climate Change (PDF; 816 kB)
- ↑ a b Scott C. Sheridan and Michael Allen: Changes in the frequency and intensity of extreme events Temperature and Human Health Concerns . In: Current Climate Change Reports . No. 1 , 2015, doi : 10.1007 / s40641-015-0017-3 .
- ↑ Scott C Sheridan and Michael Allen: Temporal trends in human vulnerability to excessive heat . In: Environmental Research Letters . March 19, 2018, doi : 10.1088 / 1748-9326 / aab214 .
- ^ A b W. R. Keatinge, GC Donaldson: The Impact of Global Warming on Health and Mortality. In: Southern Medical Journal. 97 (11), pp. 1093-1099, November 2004. online ( memento of the original from October 19, 2012 in the Internet Archive ) Info: The archive link was automatically inserted and not yet checked. Please check the original and archive link according to the instructions and then remove this notice.
- ↑ Antonio Gasparrini et al. a .: Projections of temperature-related excess mortality under climate change scenarios . In: The Lancet: Planetary Health . tape 1 , no. 9 , December 2017, doi : 10.1016 / S2542-5196 (17) 30156-0 . See also Veronika Huber: Fewer deaths from climate change? In: SciLogs: Klimalounge. March 22, 2018, accessed March 23, 2018 .
- ^ Steven C. Sherwood and Matthew Huber: An adaptability limit to climate change due to heat stress . In: Proceedings of the National Academy of Sciences . tape 107 , no. 21 , May 25, 2010, doi : 10.1073 / pnas.0913352107 .
- ↑ Jeremy S. Pal and Elfatih AB Eltahir: Future temperature in southwest Asia projected to exceed a threshold for human adaptability . In: Nature Climate Change . tape 6 , October 6, 2016, doi : 10.1038 / nclimate2833 .
- ↑ Suchul Kang, Elfatih AB Eltahir: North China Plain threatened by deadly heat waves due to climate change and irrigation . In: Nature Communications . July 2018, doi : 10.1038 / s41467-018-05252-y .
- ↑ Eun-Soon Im, Jeremy S. Pal and Elfatih AB Eltahir: Deadly heat waves projected in the densely populated agricultural regions of South Asia . In: Science Advances . tape 3 , no. 8 , August 2, 2017, doi : 10.1126 / sciadv.1603322 .
- ↑ C. Raymond, D. Singh, RM Horton: Spatiotemporal Patterns and Synoptics of Extreme Wet-Bulb Temperature in the Contiguous United States . In: Journal of Geophysical Research Atmospheres . December 2017, doi : 10.1002 / 2017JD027140 .
- ↑ Otto Wöhrbach: Human air conditioning is reaching its limit. Sweating cools you down - but not always and everywhere. Climate change is threatening more and more regions of the world with heat death. ( Online version under other title ) In: Der Tagesspiegel , August 27, 2019, p. 19.
- ↑ a b W. R. Keatinge et al. (2000): Heat related mortality in warm and cold regions of Europe: observational study . In: British Medical Journal 321 (7262), pp. 670-673. on-line
- ↑ Alistair Woodward: Climate change effects on human health: projections of temperature-related mortality for the UK during the 2020s, 2050s and 2080s . In: Journal of Epidemiology & Community Health . 2014, doi : 10.1136 / jech-2014-20404000 .
- ↑ WWF & IfW (2007): Costs of Climate Change - The Effect of Rising Temperatures on Health and Performance (PDF; 5.1 MB)
- ↑ Y. Fang, V. Naik, LW Horowitz and DL Mauzerall: Air pollution and associated human mortality: the role of air pollutant emissions, climate change and methane concentration increases from the preindustrial period to present . In: Atmospheric Chemistry and Physics . tape 13 , no. 3 , February 4, 2013, doi : 10.5194 / acp-13-1377-2013 .
- ^ Raquel A. Silva et al .: Future global mortality from changes in air pollution attributable to climate change . In: Nature Climate Change . tape 7 , 2017, doi : 10.1038 / nclimate3354 .
- ↑ Dirk Pavlik, Majana Heidenreich, Ralf Wolke and Rainer Stern: KLENOS - Influence of a change in energy policy and the climate on air quality as well as consequences for compliance with immission limit values and examination of further emission-reducing measures - final report . Ed .: Federal Environment Agency. December 2016 ( Umweltbundesamt.de ).
- ↑ Martens P., Kovats RS, Nijhof S., de Vries P., Livermore MTJ, Bradley DJ, Cox J., McMichael AJ (1999): Climate change and future populations at risk of malaria - a review of recent outbreaks. In: Global Environmental Change. Vol. 9, pp. 89-107, doi: 10.1016 / S0959-3780 (99) 00020-5
- ↑ IPCC Report Section 8: Human Health (PDF; 816 kB)
- ↑ Centers for Disease Control: Eradication of Malaria in the United States (1947–1951). on-line
- ^ Reiter P. From Shakespeare to Defoe: Malaria in England in the Little Ice Age , Emerging Infectious Diseases, Vol. 6, pp. 1–11, [2]
- ↑ IPCC Report Chapter 10 - 10.4.4.3, 10.4.5 (PDF; 876 kB)
- ^ Margot Kathrin Dalitz: Autochthonous Malaria in Central Germany . Dissertations at the University and State Library of Saxony-Anhalt in Halle
- ↑ Wilfried Bautsch u. Helmut Eiffert, Medical Association of Lower Saxony: Guide to Antibiotic Therapy Part 1: Borreliosis ( Memento of the original from January 3, 2017 in the Internet Archive ) Info: The archive link was inserted automatically and has not yet been checked. Please check the original and archive link according to the instructions and then remove this notice.
- ↑ Glenz K, Bouchon B, Stehle T, Wallich R, Simon MM, Warzecha H: Production of a recombinant bacterial lipoprotein in higher plant chloroplasts . In: Nat. Biotechnol. . 24, No. 1, January 2006, pp. 76-7. doi : 10.1038 / nbt1170 . PMID 16327810 .
- ^ Iain R. Lake et al .: Climate Change and Future Pollen Allergy in Europe . In: Environmental Health Perspectives . 2016, doi : 10.1289 / EHP173 .
- ↑ John R. Porter, Liyong Xie et al. a .: 7 Food Security and Food Production Systems . In: CB Field et al. a. (Ed.): Climate Change 2014: Impacts, Adaptation, and Vulnerability. Part A: Global and Sectoral Aspects. Contribution of Working Group II to the Fifth Assessment Report of the Intergovernmental Panel on Climate Change . 2014 ( ipcc.ch [PDF; 2.3 MB ]).
- ^ The World Health Organization (2002): The World Health Report 2002
- ^ A b Cline, William (2007): Global Warming and Agriculture. Center for Global Development; Peterson Institute for International Economics.
- ↑ David B Lobell, Christopher Field : Global scale climate-crop yield relationships and the impacts of recent warming . (pdf) In: Environmental Research Letters . 2, No. 1, March 2007. doi : 10.1088 / 1748-9326 / 2/1/014002 .
- ↑ Long, Stephen P., Elizabeth A. Ainsworth, Andrew DB Leakey, Josef Nösberger and Donald R. Ort (2006): Food for Thought: Lower-Than-Expected Crop Yield Stimulation with Rising CO2 Concentrations , in: Science, Vol. 312, no. 5782, pp. 1918–1921, doi: 10.1126 / science.1114722 , see also the message here
- ↑ Schimmel, David (2006): Climate Change and Crop Yields: Beyond Cassandra , in: Science, Vol. 312, No. 5782, pp. 1889-1890, doi: 10.1126 / science.1129913
- ↑ Alessandra SENSI (Eurostat), see web link: EU Commission ( Memento of the original from January 12, 2012 in the Internet Archive ) Info: The archive link was inserted automatically and has not yet been checked. Please check the original and archive link according to the instructions and then remove this notice.
- ↑ Kristie L. Ebi and Lewis H. Ziska: Increases in atmospheric carbon dioxide: Anticipated negative effects on food quality . In: PLOS Medicine . July 2018, doi : 10.1371 / journal.pmed.1002600 .
- ↑ Samuel S. Myers, Antonella Zanobetti, Itai Kloog, Peter Huybers, Andrew DB Leakey, Arnold Bloom, Eli Carlisle, Lee H. Dietterich, Glenn Fitzgerald, Toshihiro Hasegawa, N. Michele Holbrook, Randall L. Nelson, Michael J. Ottman , Victor Raboy, Hidemitsu Sakai, Karla A. Sartor, Joel Schwartz, Saman Seneweera, Michael Tausz and Yasuhiro Usui: Increasing CO 2 threatens human nutrition . In: Nature . May 7, 2014, doi : 10.1038 / nature13179 .
- ↑ Matthew R. Smith and Samuel S. Myers: Impact of anthropogenic CO 2 emissions on global human nutrition . In: Nature Climate Change . tape 8 , August 2018, doi : 10.1038 / s41558-018-0253-3 .
- ↑ E. Marie Muehe, Tianmei Wang, Caroline F. guy Britta Planer-Friedrich, Scott Fendorf: Rice production threatened by coupled stress of climate and soil arsenic. In: Nature Communications. 10, 2019, doi : 10.1038 / s41467-019-12946-4 .
- ↑ Expected losses in rice harvests. In: biooekonomie.de. November 13, 2019, accessed November 20, 2019 .
- ^ The CNA Corporation (2007): National Security and the Threat of Climate Change. Alexandria, VA (USA).
- ^ The Nobel Peace Prize 2007. Retrieved February 18, 2019 (American English).
- ↑ Global warming: Pentagon classifies climate change as a threat to national security. SPIEGEL ONLINE, from October 13, 2014
- ↑ David B. Lobell, John A. Dykema, Shanker Satyanath, Edward Miguel, Marshall B. Burke: Warming increases the risk of civil war in Africa . In: Proceedings of the National Academy of Sciences . tape 106 , no. 49 , December 8, 2009, ISSN 0027-8424 , p. 20670-20674 , doi : 10.1073 / pnas.0907998106 , PMID 19934048 ( pnas.org [accessed February 18, 2019]).
- ↑ Halvard Buhaug: Climate not to blame for African civil wars . In: Proceedings of the National Academy of Sciences . tape 107 , no. 38 , September 21, 2010, ISSN 0027-8424 , p. 16477–16482 , doi : 10.1073 / pnas.1005739107 , PMID 20823241 ( pnas.org [accessed February 18, 2019]).
- ^ Edward Miguel, Marshall Burke, Solomon M. Hsiang: Quantifying the Influence of Climate on Human Conflict . In: Science . tape 341 , no. 6151 , September 13, 2013, ISSN 0036-8075 , p. 1235367 , doi : 10.1126 / science.1235367 , PMID 24031020 ( sciencemag.org [accessed February 18, 2019]).
- ↑ H. Buhaug, J. Nordkvelle, T. Bernauer, T. Böhmelt, M. Brzoska: One effect to rule them all? A comment on climate and conflict . In: Climatic Change . tape 127 , no. 3-4 , December 2014, ISSN 0165-0009 , p. 391–397 , doi : 10.1007 / s10584-014-1266-1 ( springer.com [accessed February 18, 2019]).
- ↑ Alexander De Juan: Long-term environmental change and geographical patterns of violence in Darfur, 2003-2005 . In: Political Geography . tape 45 , March 2015, p. 22–33 , doi : 10.1016 / j.polgeo.2014.09.001 ( elsevier.com [accessed February 18, 2019]).
- ↑ Carol R. Ember, Teferi Abate Adem, Ian Skoggard, Eric C. Jones: Livestock Raiding and Rainfall Variability in Northwestern Kenya . In: Civil Wars . tape 14 , no. 2 , June 2012, ISSN 1369-8249 , p. 159-181 , doi : 10.1080 / 13698249.2012.679497 .
- ↑ Jan Selby, Clemens Hoffmann: Beyond scarcity: Rethinking water, climate change and conflict in the Sudans . In: Global Environmental Change . tape November 29 , 2014, p. 360-370 , doi : 10.1016 / j.gloenvcha.2014.01.008 ( elsevier.com [accessed February 18, 2019]).
- ↑ Tobias Ide, Janpeter Schilling, Jasmin SA Link, Jürgen Scheffran, Grace Ngaruiya: On exposure, vulnerability and violence: Spatial distribution of risk factors for climate change and violent conflict across Kenya and Uganda . In: Political Geography . tape 43 , November 2014, p. 68–81 , doi : 10.1016 / j.polgeo.2014.10.007 ( elsevier.com [accessed February 18, 2019]).
- ↑ Tobias Ide: Climate War in the Middle East? Drought, the Syrian Civil War and the State of Climate-Conflict Research . In: Current Climate Change Reports . tape 4 , no. 4 , December 2018, ISSN 2198-6061 , p. 347–354 , doi : 10.1007 / s40641-018-0115-0 ( springer.com [accessed February 18, 2019]).
- ↑ WBGU: HG 2007 Security. Retrieved February 18, 2019 .
- ↑ Tobias Ide, Jürgen Scheffran: On climate, conflict and cumulation: suggestions for integrative cumulation of knowledge in the research on climate change and violent conflict . In: Global Change, Peace & Security . tape 26 , no. 3 , September 2, 2014, ISSN 1478-1158 , p. 263-279 , doi : 10.1080 / 14781158.2014.924917 .
- ↑ Jochem Marotzke: Don't panic - also with the climate . In: Frankfurter Allgemeine Sonntagszeitung . No. 13 , 29 March 2020, p. 58 .
- ^ Andreas Miles-Novelo, Craig A. Anderson: Climate Change and Psychology: Effects of Rapid Global Warming on Violence and Aggression . In: Current Climate Change Reports . January 31, 2019, ISSN 2198-6061 , doi : 10.1007 / s40641-019-00121-2 .
- ↑ Tobias Ide, P. Michael Link, Jürgen Scheffran, Janpeter Schilling: The Climate-Conflict Nexus: Pathways, Regional Links, and Case Studies . In: Handbook on Sustainability Transition and Sustainable Peace (= Hexagon Series on Human and Environmental Security and Peace ). Springer International Publishing, Cham 2016, ISBN 978-3-319-43884-9 , pp. 285-304 , doi : 10.1007 / 978-3-319-43884-9_12 .
- ↑ Adrien Detges: Local conditions of drought-related violence in sub-Saharan Africa: The role of road and water infrastructures . In: Journal of Peace Research . tape 53 , no. 5 , September 2016, ISSN 0022-3433 , p. 696-710 , doi : 10.1177 / 0022343316651922 .
- ↑ Halvard Buhaug, Hanne Fjelde, Mihai Croicu, Nina von Uexkull: Civil conflict sensitivity to growing-season drought . In: Proceedings of the National Academy of Sciences . tape 113 , no. 44 , November 1, 2016, ISSN 0027-8424 , p. 12391-12396 , doi : 10.1073 / pnas.1607542113 , PMID 27791091 ( pnas.org [accessed February 18, 2019]).
- ↑ Kendra Sakaguchi, Anil Varughese, Graeme Auld: Climate Wars? A Systematic Review of Empirical Analyzes on the Links between Climate Change and Violent Conflict . In: International Studies Review . tape 19 , no. 4 , December 1, 2017, ISSN 1521-9488 , p. 622–645 , doi : 10.1093 / isr / vix022 ( oup.com [accessed February 18, 2019]).
- ↑ Jon Barnett: The prize of peace (is eternal vigilance): a cautionary editorial essay on climate geopolitics . In: Climatic Change . tape 96 , no. 1-2 , September 2009, ISSN 0165-0009 , p. 1-6 , doi : 10.1007 / s10584-009-9591-5 .
- ↑ Betsy Hartmann: Converging on Disaster: Climate Security and the Malthusian Anticipatory Regime for Africa . In: Geopolitics . tape 19 , no. 4 , October 2, 2014, ISSN 1465-0045 , p. 757-783 , doi : 10.1080 / 14650045.2013.847433 .
- ↑ Tobias Ide, Jürgen Scheffran: On climate, conflict and cumulation: suggestions for integrative cumulation of knowledge in the research on climate change and violent conflict . In: Global Change, Peace & Security . tape 26 , no. 3 , September 2, 2014, ISSN 1478-1158 , p. 263-279 , doi : 10.1080 / 14781158.2014.924917 .
- ^ Jan Selby: Positivist Climate Conflict Research: A Critique . In: Geopolitics . tape 19 , no. 4 , October 2, 2014, ISSN 1465-0045 , p. 829-856 , doi : 10.1080 / 14650045.2014.964865 .
- ↑ Tobias Ide: Research methods for exploring the links between climate change and conflict: Research methods for exploring the links between climate change and conflict . In: Wiley Interdisciplinary Reviews: Climate Change . tape 8 , no. 3 , May 2017, p. e456 , doi : 10.1002 / wcc.456 .
- ^ Andrew R. Solow: Global warming: A call for peace on climate and conflict . In: Nature . tape 497 , May 8, 2013, ISSN 1476-4687 , p. 179–180 , doi : 10.1038 / 497179a ( nature.com [accessed February 18, 2019]).
- ^ Nils Petter Gleditsch: Whither the weather? Climate change and conflict . In: Journal of Peace Research . tape 49 , no. 1 , January 2012, ISSN 0022-3433 , p. 3-9 , doi : 10.1177 / 0022343311431288 .
- ↑ Adrien Detges, Jon Barnett, Tobias Ide, Courtland Adams: sampling bias in climate-conflict research . In: Nature Climate Change . tape 8 , no. 3 , March 2018, ISSN 1758-6798 , p. 200–203 , doi : 10.1038 / s41558-018-0068-2 ( nature.com [accessed February 18, 2019]).
- ↑ a b D. J. Arent et al. a .: Key economic sectors and services . In: CB Field et al. a. (Ed.): Climate Change 2014: Impacts, Adaptation, and Vulnerability. Part A: Global and Sectoral Aspects. Contribution of Working Group II to the Fifth Assessment Report of the Intergovernmental Panel on Climate Change . 2014, Executive Summary, Chap. 10.2 Energy.
- ↑ a b Jennifer Cronin, Gabrial Anandarajah and Oliver Dessens: Climate change impacts on the energy system: a review of trends and gaps . In: Climatic Change . August 2018, doi : 10.1007 / s10584-018-2265-4 .
- ↑ Michelle TH van Vliet, John R. Yearsley, Fulco Ludwig, Stefan Vögele, Dennis P. Lettenmaier & Pavel Kabat: Vulnerability of US and European electricity supply to climate change . In: Nature Climate Change . Vol. 2, Issue 6, June 2012, doi: 10.1038 / nclimate1546
- ↑ Climate change A lack of water could endanger electricity production . In: Spiegel Online . 4th June 2012
- ↑ Hamilton, Jacqueline M. and Richard SJ Tol (2005): Climate change and international tourism: A simulation study , in: Global Environmental Change, Part A, Volume 15, Issue 3, October, pp. 253-266, doi: 10.1016 /j.gloenvcha.2004.12.009
- ↑ Presentation at the IOC V. World Conference on Sport and the Environment, Turin, Rolf Bürki, Bruno Abegg and Hans Elsasser, Research Center for Economic Geography and Regional Planning Policy, University of St. Gallen , and Geographical Institute of the University of Zurich a. a., see online ( Memento of the original dated January 2, 2007 in the Internet Archive ) Info: The archive link was inserted automatically and has not yet been checked. Please check the original and archive link according to the instructions and then remove this notice.
- ↑ Abegg, Bruno (1996): Climate Change and Tourism . Final report as part of the National Research Program "Climate Change and Natural Disasters" (NRP 31)
- ↑ Where can we still ski in 2060? , Republic, February 6, 2019
- ↑ Fiji relocating villages - How climate change is eating away at home . In: Deutschlandfunk Kultur . ( deutschlandfunkkultur.de [accessed on November 3, 2017]).
- ↑ tagesschau.de: Climate change: Distress of the Marshall Islands. Retrieved November 3, 2017 .
- ^ Manfred Wöhlcke (Science and Politics Foundation): Environmental migration. (April 2002) ( Memento from September 27, 2007 in the Internet Archive )
- ↑ UNEP.org Press Release: Public Private Partnerships Unlock Climate Cover for the Vulnerable Escalating Cost of Natural Disasters Could Hit “One Trillion Dollar Year” Mark , November 14, 2006, see online ( Memento of the original November 14, 2006 in the Internet Archive ) Info: The archive link was inserted automatically and has not yet been checked. Please check the original and archive link according to the instructions and then remove this notice.
- ↑ Roger A. Pielke, Jr. et al. (2008): Normalized Hurricane Damage in the United States: 1900-2005. In: Natural Hazards Review , Volume 9, Issue 1, pp. 29-42. doi : 10.1061 / (ASCE) 1527-6988 (2008) 9: 1 (29)
- ^ Association of British Insurers (2005): Financial Risks of Climate Change , Summary Report (PDF; 790 kB) ( Memento of October 28, 2005 in the Internet Archive )
- ^ Insurance Journal: Sound Risk Management, Strong Investment Results Prove Positive for P / C Industry , April 2006.
- ↑ Hurricanes - stronger, more frequent, more expensive. Knowledge edition, 2006
- ↑ Alarming balance sheet 2008: natural disasters caused 200 billion dollars in damage . In: Spiegel Online . December 29, 2008
- ↑ a b Kemfert, Claudia and Barbara Praetorius (2005): The economic costs of climate change and climate policy , in: DIW, Vierteljahreshefte zur Wirtschaftsforschung 74, 2/2005, pages 133-136 ( online ).
- ↑ a b Stern (2006): Stern Review on the Economics of Climate Change , online , see also Spiegel report: Climate change threatens the world economy .
- ↑ a b c d Richard SJ Tol: The Stern Review of the economics of climate change: a comment. In: Energy & Environment , Volume 17, Number 6, November 2006, pp. 977-981. online ( memento of the original from August 10, 2007 in the Internet Archive ) Info: The archive link was automatically inserted and not yet checked. Please check the original and archive link according to the instructions and then remove this notice. (PDF; 37 kB)
- ↑ 1,103 economists who had published on climate change in high-ranking specialist journals were surveyed; 365 replied in whole or in part.
- ↑ Peter Howard and Derek Sylvan: Expert Consensus on the Economics of Climate Change . Ed .: Institute for Policy Integrity, New York University School of Law. December 2015 ( policyintegrity.org [PDF; 1.5 MB ]).
- ^ Gail Whiteman, Chris Hope, Peter Wadhams: Climate science: Vast costs of Arctic change . In: Nature . Vol. 499, No. 7459 , July 2013, p. 401-403 , doi : 10.1038 / 499401a (English).
- ↑ This does not include damage that is difficult to monetize.
- ↑ Wolfgang Cramer and Gary W. Yohe: Detection and Attribution of Observed Impacts . In: Intergovernmental Panel on Climate Change (Ed.): Climate Change 2014: Impacts, Adaptation, and Vulnerability. Part A: Global and Sectoral Aspects. Contribution of Working Group II to the Fifth Assessment Report of the Intergovernmental Panel on Climate Change . 2014, 18.4.3.1. Economic Losses Due to Extreme Weather Events.
- ↑ Francis Weyzig u. a .: The Price of Doing Too Little Too Late: The impact of the carbon bubble on the EU financial system . A report prepared for the Greens / EFA Group - European Parliament (= Green European Foundation [Hrsg.]: Green New Deal Series . Volume 11 ). Brussels February 2014 ( gef.eu ). The Price of Doing Too Little Too Late: The impact of the carbon bubble on the EU financial system ( Memento of the original from December 24, 2016 in the Internet Archive ) Info: The archive link was inserted automatically and has not yet been checked. Please check the original and archive link according to the instructions and then remove this notice.
- ↑ European Committee for Systemic Risks (Ed.): Too late, too sudden: Transition to a low-carbon economy and systemic risk (= Reports of the Advisory Scientific Committee . Volume 6 ). February 2016 ( europa.eu [PDF; 709 kB ]).
- ↑ Federal Ministry of Finance (Ed.): Relevance of climate change for the financial markets (= monthly report ). August 19, 2016 ( bundesfinanzministerium.de [PDF; 260 kB ]).
- ↑ Where the rain falls: New Internet portal provides information on climate change and its consequences , Deutschlandfunk : Umwelt und Konsument dated December 3, 2012