
Cassini-Huygens
| Cassini-Huygens | |||||||||||||||||||||||||||||||||||||||||||||||||||||||||||||||||||||||||||||||
|---|---|---|---|---|---|---|---|---|---|---|---|---|---|---|---|---|---|---|---|---|---|---|---|---|---|---|---|---|---|---|---|---|---|---|---|---|---|---|---|---|---|---|---|---|---|---|---|---|---|---|---|---|---|---|---|---|---|---|---|---|---|---|---|---|---|---|---|---|---|---|---|---|---|---|---|---|---|---|---|
 Artist's impression of Cassini (large probe) and Huygens (left) in front of Titan (foreground) and Saturn (background) |
|||||||||||||||||||||||||||||||||||||||||||||||||||||||||||||||||||||||||||||||
| Mission goal | Saturn and its moons | ||||||||||||||||||||||||||||||||||||||||||||||||||||||||||||||||||||||||||||||
| Client |
|
||||||||||||||||||||||||||||||||||||||||||||||||||||||||||||||||||||||||||||||
| Launcher | Titan IVB (401) | ||||||||||||||||||||||||||||||||||||||||||||||||||||||||||||||||||||||||||||||
| construction | |||||||||||||||||||||||||||||||||||||||||||||||||||||||||||||||||||||||||||||||
| Takeoff mass | 2523 kg | ||||||||||||||||||||||||||||||||||||||||||||||||||||||||||||||||||||||||||||||
| Course of the mission | |||||||||||||||||||||||||||||||||||||||||||||||||||||||||||||||||||||||||||||||
| Start date | October 15, 1997, 8:43:00 UTC | ||||||||||||||||||||||||||||||||||||||||||||||||||||||||||||||||||||||||||||||
| launch pad | Cape Canaveral , LC-40 | ||||||||||||||||||||||||||||||||||||||||||||||||||||||||||||||||||||||||||||||
| End date | September 15, 2017, 10:32 UTC | ||||||||||||||||||||||||||||||||||||||||||||||||||||||||||||||||||||||||||||||
|
|||||||||||||||||||||||||||||||||||||||||||||||||||||||||||||||||||||||||||||||
Cassini-Huygens was the mission of two space probes to explore the planet Saturn and its moons . Cassini there was an Orbiter , which on behalf of NASA by the Jet Propulsion Laboratory was built to the objects from one orbit to study Saturn. Huygens was conceived as a lander and constructed by Aérospatiale on behalf of ESA with the participation of the Italian space agency ASI .
The coupled probes were launched on October 15, 1997 from Launch Complex 40 on Cape Canaveral with a Titan IVB rocket. On July 1, 2004, Cassini went into orbit around Saturn, and on January 14, 2005, Huygens landed on Titan for measurements in the atmosphere and on the surface, three weeks after Cassini's separation . Orbiters can only penetrate the Titan atmosphere with their remote sensing instruments to a limited extent. Huygens sent data for 72 minutes that greatly improved our understanding of the moon.
With its extensive range of scientific instruments, the Cassini orbiter provided many new, sometimes revolutionary, findings with regard to Saturn and its moons. The mission was extended several times and ended on September 15, 2017 with the planned entry of the probe into Saturn's atmosphere.
prehistory

development
The two probes Voyager 1 and Voyager 2 started in 1977 and reached Saturn in 1980. Shortly after this success, a mission to Saturn and Titan was considered. In 1983 the Solar System Exploration Committee presented a study. This envisaged four planetary missions up to the year 2000. The committee was a merger between the committees for space research of the European Science Foundation and the National Academy of Sciences , which began its work in 1982. In addition to the Cassini mission (back then still known as the “Saturn Orbiter / Titan Probe” program or SOTP), the ideas for the Magellan space probe and the Mars Observer were also created . At the beginning, the Saturn / Titan mission was part of the “ Mariner Mark II” project, as part of which a similarly built probe for the flyby of an asteroid or comet , called “Comet Rendezvous / Asteroid Flyby” (CRAF), is being developed should. In order to save costs, it was planned to construct both probes from as many similar instruments and systems as possible. After a positive report, which was carried out cooperatively by ESA and NASA, ESA approved the first studies on the probe in 1986. The probe was named "Cassini" after Giovanni Domenico Cassini , who discovered the Saturn moons Iapetus , Rhea , Dione and Tethys in the second half of the 17th century.
In the period from 1987 to 1988, the development of the Mariner Mark II probe continued, while the Europeans carried out the first studies on the titanium lander as part of the "Horizon 2000" program. These were named after Christiaan Huygens , who discovered the moon and understood the rings of Saturn correctly for the first time. Funding for the development of the Mariner Mark II was approved in 1989, but three years later Congress limited spending on the probe. The CRAF mission had to be stopped. One consequence was the restructuring of the Cassini project. Only the ISS , VIMS and RSS were planned as instruments . By discontinuing the CRAF project, the cost advantage that was to be achieved by using the same components was eliminated, which was achieved at the end of 1993 in combination with the new NASA director Daniel Goldin and his motto "faster, better, cheaper" (German for faster, better , cheaper ), also endangered the entire Cassini project. Thereupon the then Director of ESA, Jean-Marie Luton , wrote a letter to the Vice-President of the United States Al Gore , to the United States Secretary of State Warren Christopher and to Goldin himself. In particular, he criticized the United States' solo effort on this matter:
“Europe therefore views any prospect of a unilateral withdrawal from the cooperation on the part of the United States as totally unacceptable. Such an action would call into question the reliability of the US as a partner in any future major scientific and technological cooperation. "
“Therefore, Europe regards any possibility of a unilateral withdrawal from cooperation by the United States as completely unacceptable. Such an act would call into question the reliability of the USA as a partner for any further scientific and technical cooperation. "

A little later, Goldin approved the continuation of the project. Nevertheless, the mission came again in 1995 in the field of vision of the United States Senate Committee on Appropriations , which wanted to discontinue the project. This decision was reversed. The components of the probes were assembled in 1996 and subjected to initial tests. Cassini was transported to Cape Canaveral on April 21, 1997 , where the final tests were carried out the following summer.
In parallel with the Cassini program in the USA, the Europeans developed the Huygens lander. NASA had a say in important decisions. During the development of Huygens, a total of three prototypes were built to test individual aspects, such as the electrical systems or the load-bearing capacity of the construction. The project reached its first milestone in April 1991:
The definitions of the requirements and the first design proposal were accepted.
In the spring of 1994 the concepts for the mechanical and electrical systems were verified. The last and most important hurdle, a critical examination of the overall design, was successfully overcome in September 1995. In the following two years, an external NASA commission examined the concept for its suitability for use. In 1997, the year of launch, the technicians successfully completed the final tests of Huygens' suitability for launch and mission.
Shortly before the start on October 15, 1997, almost 5,000 people from 18 nations worldwide were involved in the mission.
costs
The cost of the project was given by NASA in 2009 as follows:
| Post | costs |
|---|---|
| Development before the start | $ 1,422 million |
| Mission support | US $ 710 million |
| Mission pursuit | US $ 54 million |
| begin | $ 442 million |
| ESA expenses | US $ 500 million |
| ... of which from Germany: approx. 120 million euros | |
| ASI expenses | US $ 160 million |
| total cost | US $ 3,288 million |
In early 2010, NASA planned to extend the mission to 2017 and estimated a further cost of US $ 60 million annually.
The "Stop Cassini" movement
Because of the radionuclide batteries , which contain plutonium-238 (for details see energy supply ), a protest group formed under the motto "Stop Cassini" to prevent the start. The supporters of the group considered the dangers posed by the consequences of a false start or an unplanned re-entry into the earth's atmosphere to be irresponsible. In the event of a false start , the premature death of tens of thousands to millions of people was predicted because Cassini contained enough plutonium-238 to kill 1.2 billion people if evenly distributed. The use of solar cells and long-life fuel cells has been suggested as an alternative .
The JPL came in a study on the environmental impact of Cassini-Huygens to the conclusion that the use of solar cells is not practical. This was mainly due to the fact that there was no payload fairing that could have held the necessary solar panels with a total area of 598 m². The resulting increase in mass of 1337 kg (+63 percent) would also have meant a massive reduction in the scientific payload. Without this measure, a solar-powered probe would have exceeded the permissible total weight for the Titan IVB (6234 kg) by almost a ton. In addition, due to their high electrostatic potential , the solar panels would have generated significantly more interference than an energy supply from radionuclide batteries, which could have disrupted some instruments. The solar panels would also have had to be unfolded and aligned with the sun, which would have meant an additional risk to the success of the mission.
Since NASA did not rule out a false start or re-entry into the earth's atmosphere, a multi-layered safety concept was implemented for the radionuclide batteries (see power supply ) in order to prevent or at least reduce the release of radioactive material in an emergency. Six possible accident scenarios were identified in the period from the ignition of the boosters until they left Earth orbit:
| Mission phase (s) | Minutes after start |
description | Released radioactivity in Bq | Probability of release |
|---|---|---|---|---|
| 1 | 0:00 - 0:11 | (Self-) destruction with impact of the batteries on concrete | 2.97 · 10 6 | 1.7 · 10 −6 |
| No ignition of a booster and parts of the fairing to hit the batteries | 1.38 · 10 6 | 9.1 · 10 −6 | ||
| Serious damage to the Centaur upper stage and impact of the batteries on concrete | 2.98 · 10 6 | 0.42 · 10 −6 | ||
| 2 - 4 | 0:11 - 4:06 | No critical scenario with release of radioactivity expected (crash into the Atlantic Ocean ) | - | - |
| 5 | 4:06 - 11:28 | (Self-) destruction and impact of the GPHS modules on rock in Africa | 0.54 · 10 6 | 4.6 · 10 −6 |
| Error in the Centaur upper level and impact of the GPHS modules on rock in Africa | 0.54 · 10 6 | 0.37 · 10 −6 | ||
| 6th | 11:28 - 92:56 | Unplanned re-entry into the earth's atmosphere and impact of the GPHS modules on rock | 0.56 · 10 6 | 4.4 · 10 −6 |
If Cassini-Huygens had entered the earth's atmosphere uncontrollably during the swing-by maneuver on August 18, 1999, which according to NASA could have happened with a chance of one in a million, a total of five billion people would have been affected. In this population, the cancer rate would have increased by 0.0005 percent, which statistically would have meant 5000 additional cancer deaths.
Ultimately, the "Stop Cassini" movement achieved no changes and no termination of the mission, it was carried out as planned. Bill Clinton approved the mission - the American president must approve any release of radioactive material into space. Opponents of the mission appealed to Clinton to refuse to sign. Their protest also appealed to the European space agency ESA, which was involved in Cassini. In Germany, critics collected more than 10,000 signatures.
Mission objectives
The Cassini-Huygens mission was designed to comprehensively improve our understanding of a large number of objects and processes in the Saturn system. Before the start, NASA and ESA defined the following research areas:
titanium
- Determination of the atmospheric composition and the isotope ratios , including the noble gases contained ; historical development
- Observation of the gas distribution in the atmosphere, search for further organic compounds and the energy source for chemical processes in the atmosphere, study of the distribution of aerosols
- Measurement of winds and temperature, investigation of cloud formation and seasonal changes in the atmosphere, search for electrical discharges
- Investigation of the upper atmosphere, particularly with regard to ionization effects and their role as a source of electrically charged and uncharged particles for the magnetosphere
- Recording the surface structure and composition as well as investigations into the interior of the moon
Magnetosphere
- Determination of the exact configuration of the axially symmetrical magnetic field and its relationship to radio radiation in the kilometer range
- Determination of the composition, sources and sinks of charged particles in the magnetosphere
- Investigation of the wave-particle interactions, dynamics of the magnetosphere on the day side, the magnetotail of Saturn and their interactions with the solar wind , moons and the rings
- Studies on the interaction of Titan's atmosphere and exosphere with the surrounding plasma
Icy moons
- Determination of the general properties and geological history of the moons
- Research into the mechanisms of deformation of the superficial and inner crust
- Investigation of the composition and distribution of surface material, especially dark, organic matter and those with a low melting point
- Research into the interactions with the magnetosphere and the ring system, as well as possible gas introduction into the atmosphere
Saturn and its ring system
- Studies of the configuration of the rings and of the dynamic processes that created the rings
- Mapping of the composition and size-dependent distribution of the ring material
- Investigation of the interactions of the rings with Saturn's magnetosphere, atmosphere and ionosphere as well as with the moons
- Determination of the dust and meteorite distribution near the rings of Saturn
- Determination of temperature, cloud properties and composition of the atmosphere
- Measurement of global winds, including wave and vortex structures
- Observation of the essential cloud structures and processes
- Research into the internal structure and rotational properties of the deep atmosphere
- Study of the daily changes and the influence of the magnetosphere on the ionosphere
- Determination of the restrictions for models for researching the history of Saturn
- Investigation of the sources and structure of lightning and static discharges in the atmosphere
Technology of the Cassini orbiter


With a launch mass of 5364 kg (including 3132 kg of fuel), Cassini was the heaviest American spacecraft ever built. Its cylindrical cell, 6.7 m high and 4 m wide, consisted mainly of aluminum and was divided into different levels (from bottom to top: drive, lower equipment level plus energy supply, upper equipment level, communication). Due to the trajectory of the probe, a complex climate system was integrated, which ensured the operational capability of both Venus and Saturn. During the swing-by maneuver at Venus, Cassini had to be cooled because of the short distance to the sun, which was realized by means of gold-coated Mylar foil on the side facing the sun and radiators on the side facing away from the sun . At Saturn, the solar radiation is so low that the electronics and scientific instruments had to be heated. This was done primarily by using the waste heat from the three radionuclide batteries, otherwise by using small heating resistors .
power supply


Because of the great distance to the sun at Saturn, three radionuclide batteries (designation: "GPHS RTG") were used at Cassini for energy supply, since solar cells could not be used because of their size and mass. The 56 kg batteries were each filled with 12.2 kg of plutonium dioxide (of which each 9.71 kg 238 Pu , a total of 29.4 kg), which due to its radioactive α-decay ( half-life : 87 years) 4.4 kW per battery Thermal output released. This heat converted silicon - germanium - thermocouples with an efficiency from 6.5 to 7 percent in electrical energy to.
The electrical power per radioisotope battery was 285 W at the start (total 855 W) and then decreased because the activity of the plutonium steadily decreases and the thermocouples become more and more inefficient due to wear and tear. In 2010, all batteries together delivered around 670 W of electrical power; at the end of the 2017 mission, around 605 W were still available.
Since plutonium 238 highly toxic and a strong α-emitters is (details, see the "Stop Cassini" movement ), a multi-layered security system has been in the construction of RTGs developed: The plutonium was as sintered before plutonium that has a ceramic matrix forms, which at mechanical stress breaks into larger fragments, but does not turn into fine dust that could be inhaled. In addition, the compound plutonium dioxide withstands the heat of a possible re-entry into the atmosphere without evaporating, and chemically reacts neither with the air components oxygen and nitrogen nor with water and hardly with other substances. Inside the battery, this plutonium ceramic was housed in 18 individual capsules, each with its own heat shield and impact-proof housing. Inside these capsules, the ceramic was surrounded by several layers of different materials (including iridium and graphite ), which, thanks to their high melting point and high resistance to corrosion , were supposed to prevent radioactive substances from escaping after an impact. The outermost protective barrier consisted of a jacket made of carbon fibers and the aluminum housing.
The Power and Pyrotechnic Subsystem (PPS) was responsible for power distribution. It generated the on-board voltage of 30 volts direct current (on two lines with +15 V and −15 V each) and initiated pyrotechnic processes, for example the separation from the Centaur upper stage. The electricity was distributed via a cabling subsystem ( CABL), which consisted of over 20,000 cable connections with around 1630 connection nodes. In total, over 12 km of cables were used in the Cassini orbiter. The wiring was electrically completely passive and had no power electronics or data processing components. It was used exclusively for power management and data transfer.
electronics


The two most important elements of the electronics were the two semiconductor mass storage devices and the Engineering Flight Computer (EFC) from IBM , which was responsible for all control tasks within the probe. It had a total of 58 microprocessors , including one of the MIL-STD-1750A type .
This processor has already been used in several military systems (including Northrop B-2 , General Dynamics F-16 and Hughes AH-64 ) and was used for the first time for a space mission. It is based on a 16-bit architecture , has a computing power of 1.7 MIPS and has an internal 8 kbit memory. The main memory of the EFC was 32 Mbit in size and consisted of SRAM memory cells which, compared to conventional SDRAM cells, have significantly less capacity, but are more radiation-resistant.
For the first time in space history, the two mass storage devices ( Solid State Recorder, SSR ) were not based on magnetic tapes , but on DRAM technology. Compared to magnetic tapes, the SSD architecture used has the following advantages:
- higher reliability (no moving parts),
- simultaneous reading and writing,
- lower access times ,
- higher data rates,
- lower energy consumption and
- no torque generation and thus no memory-related rotation of the probe.
Each recorder had a storage capacity of 2.56 Gbit, of which 560 Mbit was used for forward error correction . The recorders were divided into 640 DRAM cells each with 4 Mbit storage space, which could be read and written simultaneously at a data rate of 2 Mbit per second. Because of the intense radiation in open space and in the radiation belt of Jupiter , both temporary data errors and damage to the memory cells are inevitable. For this reason, an error detection and correction system was integrated on the hardware side, which detects defective memory areas, restores data as far as possible and marks the memory location as defective. The gate arrays used had a logic for the boundary scan test in order to detect transmission and format errors with a probability of over 99 percent. When designing the system, it was planned that around 200 Mbit of storage space would be lost through radiation and wear and tear by the end of the mission. Each SSR weighed 13.6 kg, was 0.014 m 3 and required 9 W of electrical power.
The SSR and EFC components are housed together with other electronic components in the cylindrical Electronic Packaging Subsystem (EPS) , which is located on the upper equipment level directly below the antenna section. The EPS is divided into 12 standardized modules; it protects the electrical systems it contains from radiation and interference signals from neighboring electronics. It also uses a temperature control system to ensure that the components operate within their temperature specifications and are not damaged by hypothermia or overheating.
communication
The radio signals for communication with Cassini were generated by the Radio Frequency Subsystem (RFS). The core of the system were two traveling wave tubes - amplifiers with a power of 20 W. These could also be used at the same time to increase the transmit and receive power, but could also work on their own if an amplifier was defective (principle of redundancy ). The telemetry control , signal processing and transponder assemblies were also duplicated . Further components were a highly stable oscillator , a diplexer and a circuit for controlling the antennas.
The generated signals were then transmitted via the antenna subsystem (ANT). The most important component was the high gain antenna (HGA) on the tip of the probe, which was designed as a Cassegrain parabolic antenna . It measured 4 m in diameter and was therefore larger than the antennas of the Voyager probes, which had a diameter of 3.66 m. It was provided by the Italian space agency Agenzia Spaziale Italiana . The HGA had a high directional effect , which on the one hand enabled the data rate to be greatly increased with the same transmission power, but on the other hand the antenna also had to be very precisely aligned with the earth.
There were also two low-gain antennas (LGA) attached to the tip of the HGA sub-reflector and to the other end of the probe so that data could be transmitted in every flight position. Since the data rate was very low due to the compact antenna design, they were mainly intended as an emergency solution if the HGA could not be aligned to the ground. During the cruise flight phase, these antennas were also used for scheduled communication, since no high data rates were required for the short, routine system checks. This saved the fuel that would have been necessary to align the main antenna with the earth.
Since the HGA had to offer capacity for some scientific radio experiments in addition to communication, its structure was much more complex than with other space probes. The following is an overview of the frequencies and systems used:


In the center of the HGA parabolic antenna is a construction that the transmitters for the X-band and K was a sheltered band because the highest at that position antenna gain was achieved. The K u band radar system had a completely different task than the other radio instruments, which is why a complex structure was necessary: In addition to the transmitter in the middle, there were a total of 100 waveguides , which were arranged in four module groups around this area. The S-band transmitter was located in the sub-reflector behind a special surface that was impermeable to the other frequency bands and thus acted as a reflector, and illuminated the parabolic antenna directly. The high gain antenna was also used as a heat shield against the sun's heat radiation during the cruise flight, as long as it was less than 2.7 AU away.
Together with the terrestrial antennas of the Deep Space Network , the following transmission rates were achieved:
- with Jupiter 249 kbit / s with a 70 m antenna, approx. 62 kbit / s with a 34 m antenna;
- at Saturn 166 kbit / s with a 70 m antenna, approx. 42 kbit / s with a 34 m antenna.
- Depending on the distance to earth, data rates of up to 948 bit / s can be achieved via the low-gain antenna.
- The lowest possible data rate was 5 bit / s.
The high gain antenna in combination with the S-band transmitter was used to communicate with the Huygens probe. Receipt was on two channels with 8 kbit / s each, with one channel failing due to a design error (for details see mission history).
| antenna |
Frequency band |
Center frequencies |
Bandwidth / antenna gain |
Transmission direction |
Associated system |
tasks |
|---|---|---|---|---|---|---|
| HGA | ||||||
| S-band | ||||||
| 2,040 MHz | 10 MHz / 35 dBi | reception | RFS | Communication with Huygens | ||
| 2,098 MHz | ||||||
| 2,298 MHz | Send | RSS | radio-technical atmospheric research | |||
| X-band | ||||||
| 7.175 MHz | 50 MHz / 47 dBi | reception | RFS | Communication with the earth | ||
| 8,425 MHz | Send | |||||
| k. A. | Send | RSS | radio-technical atmospheric research | |||
| K u band | 13,776 MHz | 200 MHz / 51 dBi | Send, receive |
RADAR | SAR radar images | |
| K ” £‹ a band | ||||||
| 32.028 MHz | 200 MHz / 57 dBi | Send | RSS | radio-technical atmospheric research | ||
| 34,316 MHz | reception | |||||
| LGA | ||||||
| X-band | ||||||
| 7.175 MHz | 50 MHz / k. A. | reception | RFS | Communication with Earth (technical telemetry only) |
||
| 8,425 MHz | Send |
Flight control

Cassini had a propulsion system ( Propulsion Module Subsystem, PMS) and an attitude control system ( Attitude and Articulation Control Subsystem, AACS) to regulate its flight path and orientation in space. Both sections were at the bottom of the probe. The AACS had its own computer, which was also based on a MIL-STD-1750A processor and had 8 MBit RAM. Its main task was to calculate corrective maneuvers based on the data from the two star sensors , which selected four to five particularly bright stars in their 15 ° field of view as guide stars . In addition to these sensors, three inertial navigation systems were used to determine the position .
Cassini had two main engines, each with 440 N thrust, which were responsible for all major flight path corrections. Monomethylhydrazine (1870 kg) was used as fuel , and nitrous oxide (1130 kg) was used as the oxidizing agent . These components were analyzed by helium - pressurized gas into the combustion chambers promoted the two main engines and ignited immediately on contact ( Hypergol ). Both components were in a large tank, separated by an internal bulkhead. The tank took up most of the space inside the spacecraft, around which the electrical and scientific modules were arranged in a ring. The cylindrical helium tank held 9 kg and was attached to the side of the probe.
For maneuvers to change position, 16 smaller engines were used, each delivering 0.5 N thrust and being attached to four arms in groups of four. The fuel used here was hydrazine , the spherical 132 kg tank of which was arranged on the opposite side. All tanks were heated to prevent their contents from freezing.
The alignment of the probe in space was carried out by means of four reaction wheels , which were located near the main and attitude control engines.
Scientific instruments from Cassini
overview
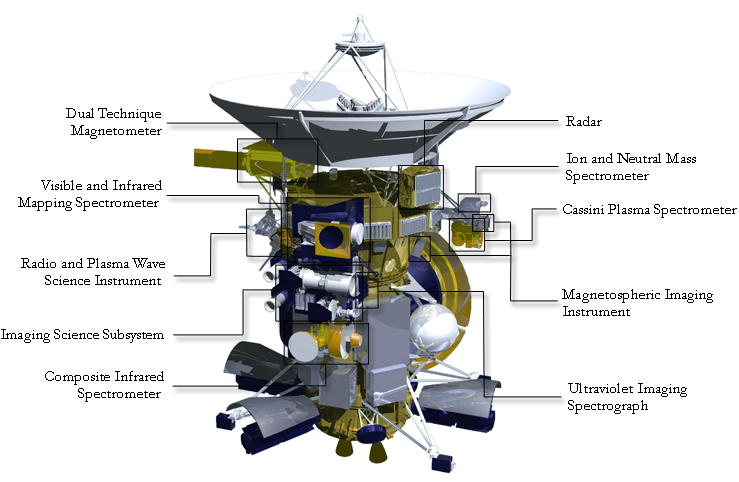
The following graphic shows the location of most of Cassini's scientific instruments. The Radio Science Subsystem and Cosmic Dust Analyzer cannot be seen as they are located on the back of the orbiter.

The following graphic provides an overview of the electromagnetic spectra covered by Cassini's optical instruments:


The following graphic shows the fields of view of Cassini's optical instruments:


Ultraviolet Imaging Spectrograph (UVIS)
The UVIS was the primary instrument for research in the ultraviolet spectrum. One of the main research areas was the investigation of the composition of the atmospheres and surfaces of Saturn and its moons and rings. The focus was on the elements hydrogen , nitrogen and carbon . The instrument was also used to study light phenomena and auroras caused by magnetic fields. In order to meet all scientific requirements, the UVIS housed four different telescope constructions with corresponding detectors: the EUV for the extreme UV range, the FUV for the far UV range, the HSP for broadband intensity measurements and the HDAC to determine the concentration of hydrogen and To determine helium . The entire instrument weighed 14.46 kg, required a maximum of 11.83 W electrical power and achieved a data rate of up to 32 kilobits per second.
The first channel was the Far Ultraviolet Spectrograph (FUV) instrument; it measured the radiation in the far UV range at a wavelength of 110 to 190 nm. It used a telescope with a focal length of 100 mm and a diameter of 20 mm. The following horizontal fields of view could be selected through three slits in front of the mirror coated with magnesium fluoride / aluminum (vertical fixed at 3.6 °): 0.043 °, 0.086 ° and 0.34 °. The incident UV light was then divided by a grid structure in a total of 1024 spectra which then from 64 linearly arranged cesium iodide - photocathode were measured, a quantum yield achieved by 8 percent. The entire detector measured 25.6 mm x 6.4 mm, with a single pixel measuring 25 µm x 100 µm.
The Extreme Ultraviolet Spectrograph instrument (EUV) formed the second measuring channel and recorded radiation in the extreme UV range at 56 to 118 nm. It used the same telescope construction as the FUV, but had a different mirror (here coated with boron carbide ) and a detector, which was sensitive in the extreme UV spectral range. Its dimensions were similar to those of the FUV, but the photocathodes were based on potassium bromide and had a much higher quantum yield of 25 percent.
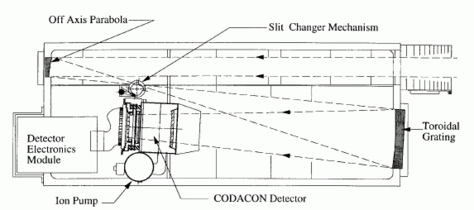
Cross-section of the FUV instrument: the EUV only differs in the lack of a pump in the lower part

Structure of the HSP
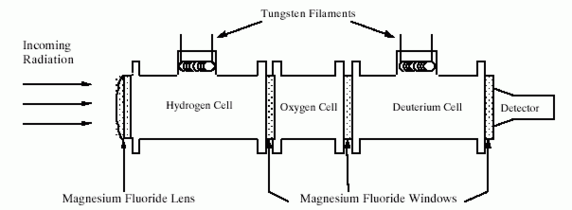
Cross-section through the HDAC instrument
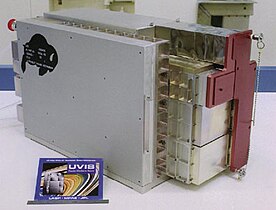
The UVIS instrument


A differently structured instrument is the high speed photometer (HSP). It should examine the rings of Saturn, by analyzing the ultraviolet light at an occultation by the rings of a star passes these. A telescope with a focal length of 200 mm, a diameter of 135 mm and a field of view of 0.35 ° was used for this purpose. The mirror concentrated the UV radiation on a magnesium fluoride lens , which was located just in front of the detector. This was based on CsI and was sensitive in the range of 115 and 190 nm. A special feature of the sensor was its extremely short exposure time of only 2 ms. This was necessary in order to be able to carry out as many finely resolved measurements as possible during the relatively short occultation phase.
The fourth and final channel was the hydrogen-deuterium absorption cell channel instrument (HDAC). Since it was only supposed to measure the spectra of hydrogen and helium (the predominant components of Saturn's atmosphere), several absorption layers had to be used. These consisted of three chambers filled with hydrogen, oxygen and deuterium and separated by windows made of magnesium fluoride. The oxygen cell had to be vented before take-off, as water precipitated there, rendering this absorption layer ineffective. In the hydrogen and deuterium cells were tungsten - filament that could change due to high temperatures, the absorption properties of these substances and thus differential measurements of the UV spectrum enabled The detector used was an electron multiplier , the hydrogen and deuterium spectra of Lyman Series measured at 121.53 and 121.57 nm.
Imaging Science Subsystem (ISS)

This optical instrument system was used to produce images in the visible spectrum as well as in the near infrared and ultraviolet range. It was divided into a wide-angle and a telephoto camera, both of which were firmly attached to the structure of the probe. In order to photograph an object, the entire probe had to be aligned accordingly. The system conducted a wide range of scientific missions, mainly in the fields of atmospheric research, surface analysis and the study of Saturn's rings. The system was also used for optical navigation . The ISS weighed 57.83 kg and required a maximum of 56 W electrical power.
Both camera systems used largely the same electronics, the core of which was a MIL-STD-1750A processor and generated up to 366 kbit of data per second. The radiation- protected CCD image sensor had a resolution of 1024 × 1024 pixels and was sensitive in the spectrum from 200 to 1050 nm. The UV sensitivity was made possible by a thin phosphor coating on the sensor. Brightness information was recorded with twelve bits per pixel, whereby this could also be scaled down to eight bits to reduce the data rate. The exposure time could be selected in 64 steps from 0.005 to 1200 seconds. After the electronics had read the image data from the respective sensor, it was compressed in order to save storage space and transmission volume. There were both lossy and lossless methods for this purpose. The latter halved the image size in most cases without affecting the quality. In the case of very detailed recordings, however, the efficiency of the algorithm decreases significantly. The lossy DCT method (based on JPEG compression) achieved higher compression rates, but led to significant artifacts and was therefore only rarely used. Another compression method is adding up pixels. Here, 2 × 2 or 4 × 4 pixels can be binned to one pixel, which halves / quarters the resolution and reduces the file size to a quarter / sixteenth.

The Wide Angle Camera ( WAC ) was used to observe large areas of space and therefore had a relatively large field of view of 3.5 °. The optics were based on the construction of the Voyager probes, measured 57.15 mm in diameter and had a focal length of 200 mm. A total of 18 filters were available, which could be switched in front of the image sensor by means of a two-wheel mechanism. The moving components of this system were based on experiences with the Hubble Space Telescope's WFPC camera . As a result of the special transmission properties of the optics, the wide-angle camera was only highly sensitive in the range from 400 to 700 nm, with a low sensitivity up to around 1000 nm.
The telecamera ( NAC - Narrow Angle Camera) had a field of view that was 10 times narrower, which leads to ten times higher resolutions. Therefore, the NAC was primarily used for the detailed investigation of individual spatial areas. The focal length was 2002 mm with a telescope diameter of 190.5 mm. This camera also had a two-wheeled filter system with a total of 24 filters. To reduce the image noise , the CCD sensor was equipped with a combined heating and cooling system that was isolated from the rest of the camera. Due to better transmission properties, the telecamera was able to work with high sensitivity in the entire spectral range of the sensor.
Visible and Infrared Mapping Spectrometer (VIMS)

Similar to the ISS, the VIMS was primarily intended to study atmospheres and rings, whereby it was also able to map titanium's surface. It worked in the range of the near UV spectrum over the visible light up to the middle infrared spectrum. Many organic molecules have their absorption spectrum here , which means that they can be recorded particularly well using the VIMS instrument. This contrast capability, which is better than that of the ISS, results in a relatively low resolution, so that both instruments complemented each other instead of replacing each other. The VIMS is divided into two separate telescopes, which were only connected by a common readout electronics: the VIMS-V for the visible spectral range and the VIMS-IR for the infrared range. The entire VIMS instrument weighed 37.14 kg, required up to 27.2 W of electrical power (nominal: 21.83 W) and produced up to 183 kBit of data per second.
The VIMS-V instrument, working in the visible range, had a telescope with a focal length of 143 mm, a diameter of 45 mm and a field of view of 1.83 °. The CCD sensor consisted of 256 × 512 pixels and was sensitive in 96 spectra in the range from 300 to 1050 nm (near ultraviolet to near infrared). The silicon-based pixel elements were 24 µm² in size, achieve a quantum yield of 13 to 41 percent and each provided 12 bits of brightness information. Two special light-emitting diodes and reference stars were used for calibration .

The VIMS-IR had a telescope with a focal length of 426 mm and a field of view of 1.83 °. The indium - antimony -based CCD sensor consisted of 256 linearly arranged pixels and achieved a quantum yield of over 70 percent. It was sensitive in 256 spectra in the range 850 to 5100 nm and a pixel element measured 103 µm × 200 µm. The calibration was carried out using a laser diode , brightness information was recorded per pixel with 12 bits. In contrast to the VIMS-V, the instrument was cooled in a complex way, since the internal heat of the electronics would have led to significant interference. The sensor itself was plugged directly into a radiator to dissipate heat and was highly isolated from the rest of the instrument, particularly the electronics. In the area of the telescope, special materials were used which, when heated, emitted only a minimum of infrared radiation in the spectral range of the VIMS-IR. The entire instrument was additionally insulated from space and the probe itself, whereby special cables were used that conduct less heat than conventional copper cables. These measures allowed the sensor to be cooled down to 60 K (−213 ° C), while the electronics were kept at the optimal temperature of 288 K (+15 ° C).
The shared electronics used an 80C86 processor for data processing, which could access 64 kByte RAM and 96 kByte PROM . A 4-Mbyte buffer temporarily stored the data prior to transmission to the Cassini bus system. The image data of the VIMS instruments could also be compressed without loss in order to save the necessary storage space and transmission volume. To this was added a separate RISC - coprocessor type ADSP 2100 is used, which was clocked at 9 MHz and on the Harvard architecture based. 8 kByte RAM were available for compression; the time signal was generated by a 24 MHz oscillator component. The processor needed 1.76 ms to compress a spectral channel, whereby the compression usually achieved a loss-free file size reduction to 33 to 40 percent. As with the ISS, it is also possible to add pixels together (specifically in the 3-to-1 and 5-to-1 modes).
Composite Infrared Spectrometer (CIRS)

With the CIRS, which works in the infrared range, primarily surface and atmospheric temperatures and their composition should be researched. It consisted of a telescope whose collected light was directed onto one of three different detectors. These were all read out by shared electronics. This produced up to six kBit of data per second. The telescope had a focal length of 304.8 mm and a diameter of 50.8 mm. Sun protection reduced interference and at the same time served as a cooling element. The CIRS weighed 39.24 kg and required a maximum of 32.9 W of electrical power, with a requirement of around 26 W in normal operation.
The first spectrometer worked in the range from 7.16 to 9.09 µm and had a resolution of 0.237 mrad. The detector was based on cadmium telluride (CdTe) and consisted of ten linearly arranged pixels. The second spectrometer was essentially the same as the first, but operated in the range from 9.09 to 16.7 µm. To enable proper calibration, another spectrometer was available that evaluates the reference radiation from an LED infrared source. The third spectrometer had a field of view of 0.25 ° and was sensitive in the spectral range from 16.67 to 1000 µm. This area was adjusted to the thermal radiation of Saturn's moons and rings, which is why this spectrometer was primarily used for temperature measurements .
radar

Since titanium has a very dense atmosphere , its surface can only be examined to a very limited extent by passive optical instruments. As a solution, an imaging radar was installed at Cassini , which can penetrate the atmosphere without any significant loss of quality and which can create three-dimensional terrain profiles of the surface. In order to reduce the construction effort, the system also used the communication antenna, which, however, meant that data transmission and radar recordings were not possible at the same time. The instrument had three subsystems: a radar altimeter , a synthetic aperture radar for creating 3D terrain profiles and a passive radiometer . The entire instrument weighed 41.43 kg, required a maximum electrical power of 108.4 W and generated a data rate of up to 365 kbit per second.
The Synthetic Aperture Radar (SAR) was the most important subsystem, as it could generate 3D terrain profiles with relatively high accuracy. The transmitter achieved a radiation power of around 46 W, with a traveling wave tube with an operating voltage of 4000 volts being used for amplification . Depending on the operating mode, the system worked with a pulse repetition frequency (PRF) of 1.8 to 6.0 kHz and a transmission time (also pulse width ) of 200 to 400 milliseconds with a bandwidth of 0.43 or 0.85 MHz. You could choose between high and low resolution for the image. In high-resolution mode, the distance resolution, depending on the orbital position and distance, was 0.48 to 0.64 km and the horizontal resolution ranged from 0.35 to 0.41 km. The low resolution mode offered a range resolution of 0.48 to 2.70 km and a horizontal resolution of 0.41 to 0.72 km. Both modes mapped less than 1.1 percent of the titanium surface per measurement.

Problems arose with the energy supply during the development, since the radar required considerably more energy for the required resolution than the radionuclide batteries provided. In the first drafts, batteries were therefore provided as buffers, which are charged during the inactive phase and then provide additional energy for radar operations. However, the problem of wear and tear, which was exacerbated by the radiation in open space, and the size of the batteries worried the engineers, which is why a solution based on capacitors as an energy buffer was implemented. Since the radar's duty cycle was a maximum of 10 percent, the capacitors were able to charge with 34 W during the remaining 90 percent and completely release the stored energy in a 0.09 to 3 s long transmission pulse with a power of up to 200 W. This complex is known as the Energy Storage Subsystem (ESS) and was able to significantly reduce the peak energy requirement while maintaining the average output.
A radar altimeter was used to determine the exact distance from the probe to the surface of titanium. It was not imaging and measured the distance with a resolution of 60 m. The pulse repetition frequency was 4.7 to 5.6 kHz and the transmission time was 150 ms with a bandwidth of 4.25 MHz. When the altimeter was operating at reduced resolution, backscattering from the surface could be measured. The data obtained were combined with the SAR images on earth, as these would otherwise have lost quality due to the varying radar cross-sections of the surface. The pulse repetition frequency was 1 to 3 kHz and the transmission time was 500 ms with a bandwidth of 0.11 MHz. 20 percent of the titanium surface could be recorded in one measurement run, the horizontal resolution was 55 to 140 km.
The radar system could also operate in a passive mode, measuring the radio emissions at 13.78 GHz emitted by titanium or other objects. In one measurement run, 40 percent of the titanium surface could be recorded with a horizontal resolution of 6 to 600 km, with a bandwidth of 135 MHz. The data obtained enabled conclusions to be drawn about the temperature (accurate to 5 K) and the photochemistry of titanium and other moons during the evaluation .
Radio Science Subsystem (RSS)

The RSS was intended to study the atmosphere and the exact masses of Saturn and its moons. Research into the ring system and the improvement of the ephemeris data were also part of the range of applications. For this purpose, three transceiver systems were used, which measured the change in radio waves when they cross atmospheres or ring systems in order to determine their temperature, density and composition. Depending on the frequency band, the signals were evaluated by Cassini itself or by the systems of the Deep Space Network (DSN).
In the area of the S-band, Cassini sent a highly stable carrier wave in the direction of the DSN without receiving any signals. The transmitter of the communication system was used, which emitted the carrier wave with a power of 10 W. The X-band was also broadcast in the same way, whereby radiated signals could also be received and evaluated by the DSN.
For measurements in the K a the RSS used its own transmitter, which has been specially designed for the requirements of the instrument band (at 32.028 GHz and 34.316 GHz). It could both send and receive signals to the DSN. A traveling wave tube was used for amplification, whereby the carrier wave was emitted with a power of 7 W. The transmitter weighed 14.38 kg and the entire instrument required up to 80.7 W of electrical power.
Radio and Plasma Wave Science Instrument (RPWS)


The RPWS was primarily intended to investigate the interaction of interplanetary plasma with the magnetic fields and upper atmospheric layers of Saturn and its moons. To do this, it evaluated the low-frequency radio waves with long wavelengths, as these mainly arise from the aforementioned interactions.
Three different detectors were used: a Langmuir probe , a receiver for magnetic waves and one for electrical waves. The latter used three Y-shaped 10 m rod antennas for reception , which were made of a beryllium - copper alloy and, due to their size, only unfolded after the launch. The three magnetic wave antennas were 25 cm long and 2.5 cm in diameter. They had a preamplifier and were perpendicular to each other so that three-dimensional measurements were possible. The Langmuir probe had a cantilever arm with a length of 1 m, at the end of which was attached a ball with a diameter of 5 cm. She could electron densities 5-10000 electrons / cc and energy spectra of 0.1 to 4 electron volts capture.
All waves picked up by the antenna systems could be routed to one of five receiver systems with the help of a switching logic:
- Radio frequency receiver: 440 channels in the range from 3.5 to 16 MHz, only electrical antennas
- Medium frequency receiver: 80 channels in the range from 0.024 to 16 kHz, a magnetic or electrical antenna
- Low frequency receiver: 28 channels in the range from 1 to 26 Hz, any two antennas
- 5-channel waveform receiver: sensitive in the 1 to 26 Hz and 3 to 2.5 kHz ranges. Five antennas of all kinds in parallel
- Broadband receiver: sensitive in the ranges 60 to 10.5 kHz and 0.8 to 75 kHz, any type of antenna
The electronics of the RPWS essentially consisted of three processing units: the low-rate processor (LRP), the high-rate processor (HRP) and the compression processor (DCP). The core of all three components was a 16-bit 80C85 microprocessor that was clocked at 3 megahertz and could access 64 to 96 kbytes of RAM. The entire instrument weighed 37.68 kg, required up to 16.4 W of electrical power and generated up to 366 kBit of data per second.
Dual Technique Magnetometer (MAG)

This instrument was supposed to investigate the structure of the magnetic fields in the Saturn system and observe their change through solar activity. For this purpose, two subsystems were used, which were attached to an 11 m long non-magnetic boom: the Vector / Scalar Helium Magnetometer (V / SHM) for field direction or strength measurement and the Fluxgate magnetometer, which simultaneously measures the direction and strength of a magnetic field can. Both systems were controlled by central electronics. Its core was a double redundant processor of the type 80C86 , which was clocked with 4 MHz and could access 128 kByte RAM for program code. In addition, 32 kByte PROM and 16 MB RAM were connected for scientific data. The central electronics could read out 16 to 250 measurements per second ( sampling ), each data packet being 16 to 19 bits in size. The data was buffered in a radiation-tolerant 64-kbyte memory module and, in standard mode, transmitted 136 measurements to the Cassini on-board computer every four seconds. The entire instrument weighed 3 kg, required 3.1 W electrical power and produced up to 3.60 kBit of data per second.
The Vector / Scalar Helium Magnetometer worked in either magnetic field strength or direction mode. In the latter case, the instrument could either work in the strength range of ± 32 nanotesla with a resolution of 3.9 picotesla or perform measurements in the range of ± 256 nT with an accuracy of 31.2 pT. In the strength mode, magnetic fields with a strength of 256 to 16,384 nT could be recorded.
Parallel measurements of direction and strength could be carried out with the fluxgate magnetometer . Four measuring ranges with different properties were available:
- Range: ± 40 nT Resolution: 4.9 pT
- Range: ± 400 nT Resolution: 48.8 pT
- Range: ± 10,000 nT Resolution: 1.2 nT
- Range: ± 44,000 nT Resolution: 5.4 nT
Cassini Plasma Spectrometer (CAPS)

The CAPS measured the flow of ions and electrons using the functions of mass per charge (only for ions) and energy per charge as well as the angle of incidence of these particles. It was primarily intended to determine the composition of charged particles that escape from the atmosphere of Titan and Saturn, as well as their interactions with the magnetic fields in the Saturn system. Three instruments were used for this purpose: an ion mass spectrometer (IMS), an electron mass spectrometer (ELS) and an ion beam spectrometer (IBS), which provided the three-dimensional vector data. All instruments were controlled via a shared electronic system, the core of which were two almost identical circuit boards . These were equipped with their own RAM, ROM and a 16-bit PACE 1750A processor based on the MIL-STD-1750A . All measuring instruments of the CPAS were continuously moved by a motor at different speeds over a range of 216 °, whereby the place of origin of the impacting particles could be determined. The entire system weighed 12.5 kg, had an electrical power consumption of 14.5 W and generated 8 kBit of data per second.
The ion mass spectrometer (IMS) consisted of a toroidal , electrostatic filter that only allowed positively charged particles with a certain energy spectrum to pass through to the time-of-flight mass spectrometer . The filter also measured the energy per particle and reduced the opening angle, which led to better spatial resolution. The spectrometer then measured the mass per charge. So that it could also detect particles with low charges of up to 1 eV, they were accelerated by an arrangement of eight thin carbon foils before they entered the instrument , which created a linear electric field with a potential of 15 kV. When passing through the foils, large molecules were also broken down into their atomic components. After the acceleration, the particles hit two microchannel plates , which were made of lead glass and generated around 300 electrons per particle impact, which were then measured to determine the spectrum.
The electron spectrometer (EMS) only measured the flow and the angle of incidence of the negatively charged electrons. Otherwise it worked with the same principles as the ion spectrometer, except that it did not have carbon foils to accelerate the electrons.
The ion beam spectrometer (IBS) was also similar in structure to the ion mass spectrometer (IMS), but it also lacked carbon foils, which meant that large ionized molecules could also be measured. It also processed 100 times more electrons per unit of time, although no measurements of the mass per charge were carried out.

Magnetospheric Imaging Instrument (MIMI)
Similar to the CAPS, this instrument was supposed to examine the plasma in the Saturn system, but in a higher energy range. It consisted of three detectors with different tasks: the “Low Energy Magnetospheric Measurement Systems” (LEMMS) for measuring ions, protons and electrons, the “Charge-Energy-Mass Spectrometer” (CHEMS) for measuring charges and the “Ion and Neutral Camera” “(INCA), which can map the three-dimensional distribution and composition of ions. The entire instrument weighed 28.1 kg, required an average of 20.3 W electrical power and generated around 1 to 4 kBit of data per second.
The LEMMS was able to measure the following energy spectra: electrons with 0.015 to 10 MeV, protons with 0.015 to 130 keV and ions with 0.02 to 130 MeV. For the measurement, the particles hit various foils, and their energy was calculated from the resulting current pulses. The instrument had two openings, one with a 15 ° field of view for low energy particles and one for high energy particles with a 30 ° field of view. In order to also be able to measure angles, the LEMMS rotated 360 °. The instrument weighed 6.27 kg and required a nominal 5.2 W of electrical power.
The CHEMS analyzed the plasma near Saturn. The energy spectrum is between 10 and 220 keV. The field of view was 160 °. A time-of-flight mass spectrometer and an additional detector were used for the measurement. The CHEMS weighed 6.66 kg and required an average of 3.5 W electrical power.
The INCA instrument was distinguished by its ability to create three-dimensional maps of the distribution of ion and hot neutron plasma. The latter was recorded on the basis of its thermal radiation, the spectrum ranged from 7 keV to 8 MeV per nucleon. The field of view measured 120 ° × 90 °. The INCA weighed 6.92 kg and required 3 W electrical power in normal operation.
Ion and Neutral Mass Spectrometer (INMS)

The INMS was another spectrometer for examining titanium's upper atmosphere and its chemical composition. For this purpose, ions and neutrons were captured and examined. The entire instrument weighed 9 kg, required an average of 27.7 W electrical power and generated a nominal 1.5 kBit / sec.
The INMS had a closed and an open ion source . This resulted in three possible operating modes for the instrument:
- closed ion source: detection of neutral molecules
- open source: recording of free radicals
- open source plus ionization: detection of positively charged ions with an energy of less than 100 eV
The trapped particles were first separated according to their mass using a quadrupole mass spectrometer and then directed to the ion detectors of the two sources. These were designed as secondary electron multipliers and had two measuring ranges for atomic masses from 1 to 12 u and 12 to 199 u. The lower detection limit in the closed mode was 70,000 particles / cm 3 , in the open mode the limit was 700,000 particles / cm 3 . In addition, there were two other detectors for the detection of trace gases that are up to two million counts / s, evaluate and connections with quantities down to 100 pico moles were able to determine.

Cosmic Dust Analyzer (CDA)
The CDA was supposed to study the properties of interplanetary dust within the Saturn system. Furthermore, particles from interstellar space and meteorites near the rings should be researched. The instrument, which could be freely pivoted up to 270 °, had an opening with a diameter of 41 cm, with which dust was caught and then passed through four grids. The first and last grids were grounded so that the other two electrically charged grids are in a Faraday cage. If electrically charged dust particles, as are very often found in the Saturn system, hit the grids, their charge could be determined to a billiardth of a coulomb. The two grids were also inclined by 9 ° to the axis so that the angles of incidence could also be measured with an accuracy of 10 °.
After passing through the grids, the particles hit two identical 16 mm rhodium plates. As a result of the impact, the atoms on the plate were ionized and scattered into space. These ions were then accelerated with a voltage of 1 kV in order to be separated on the basis of their speed over a distance of 230 mm in a time-of-flight mass spectrometer. Finally, the ions hit electron multipliers and ion colliminators, which measured their mass and energy. A maximum of one particle could be analyzed per second.
Although all important parameters of dust particles could be determined with the described method, the system could no longer work reliably with a high number of impacting particles, for example in the immediate vicinity of the rings. Therefore, the CDA still had the “High-Rate Detector” (HRD), which could work efficiently even at high impact rates. It was based on two 50 cm² polyvinylidene fluoride films with a thickness of 6 and 28 µm each. A particle impact caused an electric shock, from which the kinetic energy could be calculated. This measurement is only rudimentary, but it could process up to 10,000 impacts per second. The entire instrument weighed 16.36 kg, required an average of 11.4 W electrical power (maximum 18.4 W) and produced up to 524 bits of data per second.
Technology of the Huygens probe


The Huygens lander was used to research Saturn's moon Titan and was provided by the European Space Agency (ESA). It was attached to the Cassini orbiter by means of an adapter, weighed 318 kg and measured 1.6 m in diameter. Their cell consisted mainly of aluminum, which was used in sandwich honeycomb panels of various thicknesses (25 to 72 mm). In most cases, the surfaces were connected and stiffened internally by several titanium struts.
Huygens was firmly attached to Cassini during the cruise. In addition to communication, the Huygens lander was also supplied with power (up to 210 W) via a plug so that it did not have to strain its batteries for function tests. The separation took place by means of three small explosive charges 22 days before the landing phase. Huygens received the necessary impulse from three steel springs, which could apply a force of 500 N each. At the same time, guide rollers ensured that the probe rotated around its own axis at seven revolutions per minute. After the separation, it moved away from Cassini at about 0.3 m / s.
Five batteries were responsible for powering Huygens. Each battery consisted of two modules, each with thirteen LiSO 2 cells connected in series with a capacity of 15.2 Ah . This gave the probe a total of 76 Ah at a voltage of 28 V. During the cruise almost all electrical systems were deactivated to save energy; only a few rudimentary functional tests were carried out periodically. The energy requirement then rose to up to 351 W, with the energy system being able to deliver a maximum of 400 W. The consumption during the individual mission phases was planned as follows:
| Mission phase | performance recording |
Duration | consumption |
|---|---|---|---|
| Cruise flight after the separation |
0.3 W | 22 d | 158 Wh |
| Phase before entry | 125 W | 18 min | 37 Wh |
| First phase of relegation | 339 W | 80 min | 452 Wh |
| Second phase of relegation | 351 W | 73 min | 427 Wh |
| Surface mission | 351 W | 45 min | 263 Wh |
| total | 22.15 d | 1338 Wh | |
| Reserve (= 37%) | 790 Wh | ||
The Command & Data Management Subsystem (CDMS) was responsible for controlling the probe . Since no more commands could be sent to the probe after Cassini was disconnected, the electronics were designed to be fail-safe to a very high degree. Therefore the CDMS main computer was designed with double redundancy. Each computer used a MIL-STD1750A processor with a 1 Mbit EPROM to store software, which could be reprogrammed as long as the probe was connected to the Cassini orbiter. The following systems were also redundant:
- Mission Timer Unit (triple, timer)
- Central Acceleration Sensor Unit (triple, acceleration sensor )
- Radar altimeter (double)
- Solid State Recorder (double, data storage)
- Probe Data Relay Subsystem (dual, communication)

The redundant communication system consisted of a 10-watt S-band transmitter and an omnidirectional antenna. The data rate to the high gain antenna from Cassini was 1 to 8 kbit / s. To be on the safe side, both transmission systems were working at the same time, sending the same data (with the exception of images) with a time lag of six seconds. The data were recorded using Cassini's SSR mass storage devices and sent to Earth after the mission was over. During the cruise, data could also be transmitted directly to Earth if antennas of the Deep Space Network were available for reception.
Since Huygens had to enter the dense atmosphere of the moon, it was protected from the high temperatures (up to 1500 ° C) by a 79.3 kg heat shield . The front main shield was conical, had a diameter of 2.75 m and consisted mainly of ceramic - heat protection tiles with a thickness of 17 to 18 cm. The load-bearing structure was made of carbon fiber reinforced plastic (CFRP) in a sandwich honeycomb core construction . The top of the probe was also protected by a shield. With a diameter of 1.6 m, this weighed only 11.4 kg, as significantly less heat occurs on the back and accordingly less heat protection was required. The material used was a construction made of stiffened aluminum sheet and a thin layer of sprayed-on silicon spheres.
After the probe had survived the most demanding part of the entry, it had to be braked strongly so as not to crash when landing on the surface. For this purpose, three parachutes were used one after the other. The first was deployed at an altitude of around 160 km shortly after a small cover in the upper heat shield was blown off. It had a diameter of 2.59 m and hung on a 27 m long rope and served to pull out the 8.3 m main screen. Since such a large parachute would reduce the rate of descent too much (the batteries for the energy supply have only a very limited lifespan), this parachute was cut off shortly after the front heat shield was released at Mach 0.6 . The last parachute measured 3.03 m in diameter and took over the speed control of the rest of the flight. All screens were made of a Kevlar - nylon material and were attached to two low-friction bearings so that they could be decoupled from the rotating movement of the probe.
Scientific instruments from Huygens
overview
The following graphic provides an overview of Huygens instruments and systems:


Descent Imager / Spectral Radiometer (DISR)
The DISR was the most complex instrument on board Huygens. It was used to study the atmosphere by means of images and spectrum measurements during the descent and the stay on the surface. The DISR was divided into two sections: one directed its instruments mainly upwards towards the sky and the other downwards towards the ground. There were a total of three cameras pointing downwards or to the side, six spectrometers and several photodiodes . Although these instruments all had their own optics, the captured light was directed to a central CCD image sensor by means of glass fiber strands, which in turn was divided into different areas. Before the image data was sent, it was compressed in two stages. First, the color depth was reduced to 8 bits, which corresponds to 256 shades of gray. Then 16 × 16-bit blocks were compressed using the discrete cosine transformation , which should reduce the amount of data to a third to an eighth. Nevertheless, this was still so large that both available transmitters had to be used to send images, so that the double redundancy in the transmission was lost. The entire device complex weighed 8.1 kg, required 13 to 70 W of electrical power (a total of 48 Wh during the descent) and produced 4.8 kBit of data per second, thus taking up about half of the transmission bandwidth.
The high-resolution camera (HRI) looked down at an angle of 25.6 °, the assigned CCD chip part had a resolution of 160 × 256 pixels and was sensitive in the range from 660 to 1000 nm (from red to the near infrared range) . Since the probe rotated on its own axis during the descent, recordings with a width of up to 21.5 ° were possible. The vertical field of view was 9.6 °, the horizontal 15 °. The medium-resolution camera (MRI) had a larger field of view (21.1 ° and 30.5 °) both vertically and horizontally than the HRI, produced because of the insignificantly larger chip (179 × 256 pixels) only half the resolution images. The side-looking camera (SRI) provided images with a lower resolution of about a third compared to the MRI. This was due to the even larger field of view (vertically 25.6 ° and horizontally 50.8 °) with an even smaller chip size of 128 × 256 pixels. By rotating the probe, the SRI camera was able to create a panorama consisting of 30 individual images in the area of the horizon.
In addition to the cameras, three spectrometers for the visible, ultraviolet and infrared spectrum were directed upwards and downwards. All spectrometers pointing upwards had a field of view of 170 ° horizontally and 3 ° vertically, but otherwise did not differ from the sensors pointing downwards. The common characteristics are as follows:
- UV spectrometer: 350–480 nm measuring range, single-pixel detector
- Light spectrometer: 480–960 nm measuring range, 8 × 200 pixel detector, 2.4 nm resolution
- IR spectrometer: 870–1700 nm measuring range, 132-pixel detector (arranged linearly), 6.3 nm resolution.
In order to improve measurements close to the ground, a downward-pointing lamp was installed, which was activated when the height fell below 100 m. It requires 20 W electric power, had a filament made of tungsten , whose emissions using a 5 cm measured reflector directed towards the ground have been.
The third measurement complex is called "Solar Aureolen Experiment" and was used to determine the refraction and absorption behavior of the titanium atmosphere at 500 nm and 939 nm. The detectors each measured 6 × 50 pixels and had a bandwidth of 50 nm. In addition, there was a sun sensor for determining navigation data .

Aerosol Collector and Pyrolyser (ACP)
This instrument did not perform any scientific measurements as it was designed only to collect and purify aerosol . It collected several aerosol samples in precise time periods in two altitude regions of 140 to 32 km and 22 to 17 km. A pump was used to draw the atmosphere through a filter protruding from the front of the probe. The filter was then transferred to a small oven and heated in stages. The individual stages were each of different strengths (20 ° C, 250 ° C and 650 ° C) in order to separate different molecules and compounds by evaporation or pyrolysis . In particular, the following elements and connections were searched for:
After processing, the gas was fed to the GCMS for analysis. The ACP weighed 6.3 kg, required between 3 and 85 W of electrical power (a total of 78 Wh were consumed during the descent) and worked with a data stream of 128 bits / sec.
Gas Chromatograph and Mass Spectrometer (GCMS)

The GCMS examined the composition of the atmosphere below 170 km and determined the isotope ratio of the most common types of gas on titanium. The instrument weighed 17.3 kg (the heaviest of the entire probe), required 28 to 79 W of electrical power, and generated data at an average of 960 bits per second. The system was divided into a quadrupole mass spectrometer and an upstream gas chromatograph .
The latter was mainly used to separate and pre-analyze the inflowing gas in order to better classify the data that were then generated by the mass spectrometer. For this purpose, three capillary columns with hydrogen as the carrier gas were used. The separated gases were then fed into the mass spectrometer, where the atoms were ionized and then analyzed. The spectrometer was able to carry out measurements in a spectrum from 2 to 146 u with a resolution of about one Mµ , whereby noble gases down to 10 to 100 parts per billion could be detected. The spectrometer had several gas inlets that could be opened and closed depending on the situation: A channel for direct, unprocessed measurements, three connectors to the capillary columns of the gas chromatograph and a channel to the ACP instrument so that its collected and processed aerosols could be analyzed.
Doppler Wind Experiment (DWE)
The DWE was used to study Titan winds and turbulence. This was done with the help of a small radar that had a very stable oscillator that generated radio signals with a frequency of 10 MHz. The deviation was only 14 mHz during the entire three-hour mission, which enabled high-precision measurements of the winch through the Doppler effect . The speed resolution achieved was 1 mm / s. The system was activated when the altitude fell below 160 km and worked until it hit the surface. It weighed 1.9 kg, consumed up to 18 W of electrical power (a total of 28 Wh during the descent) and generated 10 bits of data per second.
Huygens Atmosphere Structure Instrument (HASI)

This instrument was intended to study the physical properties and composition of Titan's atmosphere. For this purpose, it had four independent sensor packages: an acceleration sensor (ACC), a pressure measuring system (PPI), two temperature meters (TEM) and a complex for determining conductivity, wave formation and height above ground (PWA). The HASI was the first system to be activated; it was already working from an altitude of 1300 km - 10 minutes before the parachutes opened. The complete instrument weighed 6.3 kg, consumed 15 to 85 W of electrical power (a total of 38 Wh during the descent) and delivered 896 bits of data per second.
The accelerometer measuring the acceleration of the probe in all three axes with an accuracy of one percent and a resolution of less than one micro g . The pressure measuring system consisted of a keel probe and three pressure gauges with the measuring ranges 0–400 hPa , 400–1200 hPa and 1200–1600 hPa. The two platinum temperature sensors worked with an accuracy of 0.5 K with a resolution of 0.02 K. Die Conductivity of the atmosphere was measured with two sensors, which examined the mutual impedance and weak electrical alternating voltage with an accuracy of 10 percent. This also enabled lightning strikes within the atmosphere to be detected and measured. Another sensor measured DC electrical voltage and the conductivity of the ions present. A microphone with an accuracy of five percent and able to detect noises with a pressure of more than 10 mPa was used to measure noise . Finally, there was a radar altimeter that began to work from an altitude of 60 km and had a resolution of 40 m at an altitude of 24 km. The accuracy here is 1.5 dB.
Surface Science Package (SSP)

The SSP was supposed to investigate the nature of the soil of Titan directly at the landing site, whereby provisions were also made for the eventual landing in a methane lake . The system had nine sensor packages in order to be able to examine a wide range of surface properties. All direct measuring instruments were mounted on the underside of the probe and either had direct contact with the ground or were located directly above it. The SSP weighed 3.9 kg, required 11 W of electrical power (a total of 30 Wh during the descent) and produced an average of 704 bits of data per second.
Although the system was essentially working directly on the surface, some sensors were activated much earlier during the descent. This includes an acceleration sensor that worked with two piezo elements to measure accelerations during the descent and impact. The latter enables conclusions to be drawn about the hardness and density of the surface at the landing site. The sensor was activated together with the inclinometer at an altitude of 153 km. The slope was determined by means of a tube filled with methanol with a platinum lid. Depending on the angle of inclination, the contact surface with the platinum changes and with it the conductivity of the system. This enables angles of inclination of up to 47 ° to be determined. From an altitude of 120 km, a group of several ceramic piezo elements that resemble those from sonar devices was activated . Two elements worked in transmit or receive mode to measure the speed of sound , another was designed as a transmitter and examined the surface using ultrasound . If the probe had landed in a methane lake or river, the transmitter could have worked as a sonar and measured the flow velocity . From an altitude of 18 km, temperature sensors and a refractometer were activated. The latter determines the optical refractive index of surfaces and liquids. For this purpose, two light-emitting diodes send light through a specially constructed prism towards the ground. The reflected light is then directed onto an array of photodiodes in order to determine the refractive index.
Shortly before the impact on the surface, the remaining sensors were activated. This includes a complex for determining the thermal conductivity , temperature and heat capacity of the soil. Two 5 cm long platinum wires with a diameter of 10 and 25 µm were used for the measurement. These were in direct contact with the surface and were electrified. Conclusions about the thermal parameters of the surrounding material can then be drawn from the electrical resistance. Another instrument used an electrode to measure the electrical capacitance of the ground. Had the probe landed in a lake, it would have been able to detect the presence of polar molecules. The last sensors were two coupled densitometers , which could measure the density of the material under Huygens using the Archimedean principle .
Mission progress to Saturn
Takeoff and flight in the inner solar system

Cassini-Huygens took off on October 15, 1997 at 08:43 UTC from Launch Complex 40 on Cape Canaveral . A Titan IVB with a Centaur upper stage was used as the launch vehicle , which initially brought the probe onto a trajectory towards Venus at a speed of 8 km / s . This was necessary because the rocket could not generate the 15.1 km / s required for a direct flight (the Titan IVB was already the most powerful launch vehicle available at that time). The probe collected additional energy through two swing-by maneuvers in April 1998 and June 1999 , which led to an increase in speed to 13.6 km / s. Before setting off for the outer planets , the probe carried out another swing-by maneuver on the earth on August 18, 1999 to increase the speed to 19.1 km / s and set course for Jupiter . During the entire past mission phase, the high gain antenna was aimed at the sun in order to act as a heat protection for the sensitive electronics. Only on December 1, 1999 was the intensity of the solar radiation low enough to turn the antenna away from the sun again. On January 23, 2000, the asteroid (2685) Masursky was approached , but due to its small size and distance of approx. 1.5 million km, it was only visible as a small point on the telecamera images .
Defect in the communication system

During the fifth routine test of the probe systems in February 2000, a massive malfunction in Cassini's communication system became apparent. The test was carried out via the deep space network system on Earth, which sent simulated data from the Huygens probe to Cassini, 90 percent of which was then lost. After a few months, the cause was finally found in the receiving system of the "Bit Loop Detector", which could not process the Doppler effect . Although at first glance the receiver had sufficient bandwidth to compensate for the frequency shifts, this only applied to the pure carrier wave and not to the sidebands that contained the modulated data stream. As a result, the signal with the data was largely outside the bandwidth of the receiver and was lost. This fact was not noticed by any of the agencies involved during the entire development and construction phase. A full test that could have discovered the error was also not carried out due to the high level of effort. The error was also not noticed in other function tests, as there was no specification for the modulated data stream that could have been used. Finally, it was no longer possible to reprogram the software to compensate for the design error, as this could only have happened before the probe was started.
By December 2000, several plans had been developed to save the Huygens submission, most of which aimed to reduce the Doppler effect as much as possible and thus bring larger parts of the sidebands into the frequency range of the receiver. This would then ultimately increase the amount of evaluable data. In July 2001 it was decided to increase the fly-by height of Cassini on Titan, which would accelerate the probe less strongly. Compared to the original flight plan, this reduced the relative speed to Huygens, whereby the frequency shift due to the Doppler effect was reduced and thus a significantly larger part of the sideband with the data was within the bandwidth of the receiver. The new plan required continuous trajectory modification over the next two years.
Fly by Jupiter

After passing the earth ( Gravity Assist in August 1999) and the orbit of Mars (late 1999), Cassini kept course for Jupiter . Originally, for cost reasons, no observations of the giant planet were planned, which, however, led to protests among the scientists involved . They argued that the fly-by at Jupiter would be ideal for calibrating the instruments and making measurements with unprecedented accuracy. The proposals were finally accepted, and on October 1, 2000, the first telecamera images were taken from a distance of 84.3 million km .
Over the next five months, Cassini was able to supplement the Galileo space probe, which is also active in the Jupiter system . Contrary to the original plan, this investigated mainly the moons . Because of a serious defect in Galileo's deployable antenna, all scientific data had to be transmitted via the far less powerful low-gain antennas, which is why Galileo stopped most of the photographic activities, as these required a high data rate .
During the stay in the Jupiter system, Cassini made many high-resolution images of Jupiter and thus took over part of the original tasks of Galileo for some time. In the course of this part of the mission, the highest-resolution photo mosaic of the planet was made from several individual images (see picture on the right). A total of 26,287 images were taken from the ISS system, whereby a large number of the available filters were used to investigate the gas distribution in Jupiter's atmosphere.
In mid-December, Cassini had the opportunity to take pictures of a few moons. However, on December 17th there was a major incident in the area of the reaction wheels , which controlled the orientation of the probe in space (see Interplanetary Navigation ). When wheel number three was accelerated from 50 to 208 revolutions per minute to change its position, a significant increase in temperature was noted at its bearings . The on-board computer interpreted this as an increase in friction and switched off the reaction wheels, whereupon the position was regulated via the thrust nozzles . However, since this consumed a lot of fuel, the instrument platform was deactivated from the ground from December 19 to 27 and only the position-independent instruments (e.g. RPWS or MAG ) were allowed to continue running. When the bike started up again, an uneven distribution of the lubricant was found. However, this problem finally disappeared completely with increasing operating time, and the scientific observations could continue as planned.
During the eight-day rest period, however, the opportunities to take pictures of some of Jupiter's moons were missed, so that some pictures were only possible from Himalia . These could only resolve the small moon into a few pixels because of the great distance of 4.4 million km. Still, this was much better than previous recordings that only showed Himalia as a simple point. Thus, for the first time, the elongated shape and size (approx. 120 km × 150 km) could be determined. The MIMI instrument also made it possible for the first time to take three-dimensional recordings of Jupiter's magnetic field. On March 22nd, the observation of Jupiter ended and Cassini was on the way to Saturn, where the primary mission was to start.
Confirmation of the theory of relativity
During the summer of 2002, the sun was exactly between Cassini-Huygens and the earth, which made it possible to test and measure the general theory of relativity . This predicted that a radio signal sent from Cassini to earth should have a longer transit time than one would expect at the corresponding distance. This effect, called Shapiro delay , is said to be caused by the strong gravity and the associated curvature of space . Since the signal has to pass this “dent” in spacetime , the transit time is extended by a few fractions of a second compared to the otherwise almost straight, direct path. This delay could then also be determined by the antennas of the Deep Space Network, which experimentally confirmed the general theory of relativity once more.
Primary mission to Saturn

Phoebe fly by
With the final course correction maneuver, Cassini-Huygens swiveled into an orbit around Saturn on July 1, 2004, with which the primary mission of the probes began. Many instruments were activated before this date (the first already in March) and on June 12th Phoebe was examined during a flyby . The probe approached the moon up to 2000 km and produced images of unequaled quality at the time. A very old celestial body was found, which consists essentially of ice and is covered with a layer of darker material several hundred meters thick. The surface of Phoebe has a large number of impact craters , which some researchers see as an indication that the moon is a holdover from the formation of the solar system about 4.5 billion years ago. Some craters are up to 50 km in diameter and have massively reshaped the surface. The rotation of Phoebe made it possible to capture the entire surface, with very high resolutions down to 12 m per pixel.
Flight through the rings

On the way to the first fly-by at Saturn, Cassini-Huygens had to fly through Saturn's rings, which made it possible to take very high-resolution images of their structure at close range. However, the maneuver was dangerous because of the countless boulders, so that a gap between the E and F rings was targeted, which could be seen as a matter-free space on the images of the Voyager probes. If obstacles had been seen on the images of the ISS , the orbit could have been raised to avoid it. However, this would have resulted in additional fuel consumption and ultimately turned out to be unnecessary. During the flight, however, the probe was rotated so that the high gain antenna served as an improvised protective shield against smaller particles. The rings were primarily examined with the ISS and UVIS instruments , which provided many new insights into the structure and composition of the rings. So these consisted not primarily of ice, as previously assumed, but mainly of dust, which is very similar to that on the surface of Phoebe. In addition, an unusually high concentration of atomic oxygen was also discovered at the edge of the rings. Since the components get younger and younger from the inside out (similar to the annual rings in trees), it is assumed that the oxygen could come from a collision in January of the same year.
Saturn flyby and new moons

During the first and closest fly-by of the mission, Cassini-Huygens flew past Saturn's cloud line at a distance of only 18,000 km, only to then pass its rings again. When evaluating all the images, it was finally possible to identify two very small and not yet known Saturn moons , which were provisionally designated as "S / 2004 S1" and "S / 2004 S2". The first measures 3 km in diameter, the second 4 km. Both moons are about 200,000 km from Saturn and their orbit is between those of Mimas and Enceladus . The moons were discovered on long exposure images, with S / 2004 S1 possibly already being found during the Voyager mission; a similar object was named "S / 1981 S14" in 1981. The moons were later renamed Methone (S1) and Pallene (S2).
First pass by Titan

On October 26 , 2004 , the first flyby of Titan took place at a distance of 1174 km. The surface was captured with a level of precision that was previously unattainable. 11 of the 12 instruments were used for observation, whereby a software error in the CIRS prevented a more detailed examination in the infrared spectrum. The images from the radar system were of particular interest, as the surface is difficult to examine with optical instruments due to the dense atmosphere of titanium. During the flyby , around one percent of the surface could be captured with a resolution of up to 300 m per pixel. In combination with other instruments, the surface of titanium could be characterized as relatively young, and dynamic processes could also be observed. This was seen as an indication of flowing, possibly organic materials. There were also indications that indicated the presence of glaciers and lakes. An ice volcano was probably discovered during the flyby (see picture on the right).
The Huygens Mission
Separation and cruise flight

The Huygens Mission began with the separation from Cassini on December 25, 2004 at 3:00 a.m. Central European Time . The three small explosive charges successfully separated Huygens and accelerated the probe to 0.35 m / s (relative to Cassini) with a spin of 7.5 revolutions per minute. The measurement of the rotation was only made possible by the weak, directed magnetic field of the probe. This could be recorded with the highly sensitive magnetometer from Cassini, although Huygens should not have been magnetic in order not to interfere with this instrument. The magnetic field was not noticed until after it was completed, and it was so weak that it was not classified as a critical problem for the mission. Twelve hours after the separation, Cassini took a picture of Huygens with the telecamera of the ISS, which confirmed after a detailed survey that the probe was on a correct course. According to the flight plan, Huygens should reach Titan in 20 days after the separation.
Landing on Titan

Twenty days after the separation, on January 14, 2005, Huygens' scientific mission began. In the following, the events are listed in chronological order ( CET ) (all times refer to the time of reception on earth; due to the signal transit time 67 minutes after the respective event). Huygens immediately sent all the data obtained at 1 to 8 kbit / sec to Cassini, where they are temporarily stored in order to transmit them to earth in the days after the end of the Huygens mission.

- 06:51
- The internal clock activated the electronics of the probe and placed the transmitters in low power mode to wait for data transmission to begin.
- 11:13
- Huygens entered Titan's atmosphere at an altitude of 1270 km.
- 11:17
- The probe had fallen below a speed of 400 m / s, which initiated the opening of the first parachute at an altitude of about 180 km. This separated the upper heat shield through its resistance and unfolded the main parachute 2.5 seconds later.
- 11:18
- The large lower heat shield was cut off at a height of about 160 km. This enabled the DISR to be activated, which now had a clear view downwards and produced the first images and spectra.
- 11:32
- The main parachute separated at an altitude of about 125 km, after which the third and final parachute unfolded.
- 11:49
- At an altitude of 60 km, the HASI's radar altimeter was activated, allowing Huygens' on-board computer to make further decisions based on the altitude instead of being controlled by the internal clock.
- 12:57
- The GCMS was the last instrument activated.
- 13:30
- The DISR lamp was activated to get good spectra from the surface after the imminent landing.
- 13:34 (± 15 min): Huygens landed successfully on the surface of Titan at a speed of 17 km / h. The temperature was −180 ° C, the pressure was 146.7 kPa.
- 15:44
- Huygens lost contact with Cassini because line of sight was lost. At that point, Huygens' mission was over.
- 16:14
- Cassini directed his antenna back to earth and transmitted the first data.

Results
During the inspection of the received data from Huygens, another technical error was revealed: Cassini's receiving system only recorded data from channel B. Huygens had two redundant transmitters (channels A and B), each of which transmitted all the collected measurement data with a time delay. However, two experiments were excluded from this redundancy: the Doppler Wind Experiment (DWE) for measuring wind speed and the image data from the DISR . The measurement by the DWE instrument should be done on board Cassini and through a VLBI network on earth. The instrument used the highly stable oscillator of the channel A transmitter for this purpose. Since no data was received on this channel, no measurements by Cassini were possible. Although it was possible to reconstruct the wind speeds from the data from the VLBI network, these were many times more inaccurate than the planned measurements by Cassini. The DISR instrument, on the other hand, transmitted the images obtained alternately on channels A and B, since the amount of data would have been too large to be sent redundantly. Therefore, half of the 1215 images were lost on reception. The failure to activate the channel A receiver was due to a programming error which was the responsibility of ESA. Another problem related to the sun sensor, which was unable to detect the sun due to the unexpected backward rotation. Thus it could not initially be determined in which direction the cameras were looking and where Huygens was exactly. However, through extensive reconstructions, the necessary parameters could be determined two months after landing with an accuracy of about 5 °.


During the mission, 474 MBit of data were collected and transmitted in 3:44 hours, 606 of which were images. It was found that the moon's atmosphere consists mainly of nitrogen and methane , with the concentration of methane increasing with decreasing altitude. At an altitude of 20 km, clouds of methane were discovered, which then reach the ground in the form of fog. The isotope argon-40 was also detected in the atmosphere , suggesting volcanic activity. However, this does not result in the ejection of lava as it does on Earth, but in the eruption of water ice and ammonia . Surprisingly, no isotopes of the type Argon-36 and Argon-38, which originate from the beginnings of the solar system, were found. It follows that Titan must have lost its entire atmosphere at least once in its history. As expected, the noble gases krypton and xenon were rare , as these are bound in aerosols and thus transported to the ground. The evaluation of the nitrogen molecules showed that Titan's atmosphere must have been five times denser in the past. Among other things, three outgassing waves are said to be responsible for the loss : The first took place when the moon was forming, the second about two billion years ago (the compacting silicate core generated large amounts of heat) and the last about 500 million years ago when there were convection currents in the mantle of titanium. The wind measurements showed a speed of about 35 m / s at a height of about 60 km, with the winds getting slower with decreasing height until they finally come to a standstill below a height of 10 km. The wind direction was constant "East" up to this 10 km, but turned very quickly to "West" when it fell below this limit. The currents within the atmosphere are not caused by changing solar radiation, as they are on Earth, as their intensity is about 100 times less than on Earth due to the much greater distance. In return, Saturn's gravitation influence on Titan is 400 times stronger than that of the Moon on Earth, which creates an ebb and flow mechanism in the atmosphere .
Thanks to the large number of images in combination with imaging spectra and radar measurements, Huygens was able to learn a lot about the surface of titanium, which was hardly possible until then due to the dense atmosphere. The surface was darker than expected due to deposits of organic matter and the soil on which the probe landed resembled wet sand or clay on earth. The substance consists mainly of polluted water and hydrocarbon ice. The warmth of the probe caused small outbreaks of methane bound in the ground below the probe shortly after landing. The sideways-looking camera (SRI) images showed a flat plane with gravel-like bodies that were 5 to 15 cm in diameter. During the descent, the DISR took spectacular pictures of the surface of Titan, especially just before landing, when much of the haze and cloud layer had been traversed. The relief showed diverse formations, including mountains, valleys and also dunes that are up to 1500 km long. Many channels have also been found which, along with the rounded shapes of the stones on the surface and the consistency of the soil, indicate erosion by liquids. Methane was assigned a primary role early on, which was ultimately confirmed. On Titan there is a constant methane cycle with rain, rivers and lakes, which is responsible for the erosion of the relief.
Video of the descent

The following video shows Huygens' descent from the perspective of the DISR instrument, with some data also coming from other instruments. Time was accelerated 40 times before the impact and 100 times after the impact.
The trajectory of the probe and its photographic images are shown in the central field of vision. Colored overlays show that a recording was made by the color-coded instrument (right) in the corresponding image area. At the beginning of the video, the cardinal points and the landing zone are briefly displayed for orientation.
In the top left corner, Huygens' status with regard to the parachutes and the heat shield is displayed, as well as a scale for comparison with a human. The trajectory of the probe is shown at the bottom left (view from the south), as well as the directions to Cassini (blue) and the sun (red). Furthermore, a scale of Mount Everest is shown. In the lower right corner, the viewing direction to Cassini (blue), to the sun (red) and the side-facing camera (SRI, green) are displayed. At the top right there is a UTC clock and a mission timer.
Various data and activities are displayed on the right. A flashing of the respective colored point means a recording by the correspondingly assigned instrument. The recorded area is also marked with the same color on the central field of view. Color points marked with a small additional pink square at the bottom right indicate that the assigned instrument is looking up instead of down.
Additional information is acoustically integrated in the stereo audio output. The left audio channel shows the speed of Huygens' rotation with its frequency; a click means the completion of a rotation. The right channel shows events in the data collection. The frequency of the background noise is linked to the signal strength to Cassini, individual ring tones indicate instrument activity. A certain tone frequency is assigned to each instrument, whereby this continues to decrease analogously to the instrument list on the right.
Mission history 2005

After the end of the Huygens mission, the Cassini probe passed the moon Enceladus on February 17, 2005 at an altitude of 1577 km . The resolution of the images exceeded that of the Voyager probes by ten times. In their time they had already been able to determine that the moon reflected a lot of light and had hardly any dark areas. Spectral analyzes by Cassini were able to provide the reason for this: The moon is completely covered with ultrapure water ice that is free of any pollution. Canals and elevations have formed on this ice sheet, which in their pattern resemble those on Europa and Ganymede ; however, the small number and size of impact craters indicate a rather young moon. During a second flyby on March 9, a magnetic field and an atmosphere were also detected. Since Enceladus does not develop enough gravity to hold an atmosphere permanently, there has to be a source that continuously supplies gas. It was therefore assumed that there must be some form of volcanic activity on the moon.

On May 10, the JPL announced that a new moon could be discovered, which was temporarily given the designation "S / 2005 S1" and was later renamed Daphnis . With the help of the NAC camera, the moon was found in a gap in the A-ring, where such a body had been suspected for some time. Daphnis has a diameter of about 7 km and a mass of about 80 billion tons and orbits Saturn at a distance of up to 136,500 km. The gravity of the moon has caused waves to form on the edge of the rings surrounding it. The waves of the faster particles in the inner ring run ahead of the moon, the slower ones in the outer ring run after it.
On July 11th, Cassini passed the moon Hyperion at a distance of about 10,000 km and made recordings with the NAC camera with a resolution of up to 1 km. Measurements of density versus surface indicate that about 40 percent of the interior of the moon is hollow.

On July 29, it was announced that the Enceladus flyby on July 14 had found clear signs of active volcanism. This is mainly based on the discovery of localized water vapor clouds and hotspots , especially at the south pole of the moon. The gases generated by the volcanic processes compensate for the slow evaporation of the atmosphere into space. The atmosphere consists mainly of 65 percent water vapor and 20 percent molecular hydrogen, the remainder being essentially carbon dioxide . In addition, the Cosmic Dust Analyzer measured a very high concentration of particles in the atmosphere. These turned out to be the primary source for Saturn's E-ring.
After Cassini passed Tethys on September 24 and took pictures of the previously unknown South Pole, two days later she flew very close (about 500 km) past Hyperion. The detailed images showed a unique sponge-like surface structure, for the process of which there is no explanation yet. Of particular interest is the black material found in many of the moon's craters, such as the large impact crater with a diameter of 120 km. Also noteworthy is the completely unpredictable, chaotic rotation that is unique for a moon in the solar system.
Mission history 2006


On March 1, it was announced that after a detailed analysis of the data by Cassini and Huygens, the source of the methane had been found in Titan's atmosphere. It resides in methane-rich water ice that forms a crust over an ocean of liquid water and ammonia . This ice was partially melted in three outgassing phases so that the methane could escape into the atmosphere. The heat required for this comes from the core of the moon, where some radioactive elements, due to their decay, provided enough heat to create convection currents inside from time to time, which ultimately transport this heat to the surface, where it melts the ice.
In March and April, investigations of the rings led to the result that the A-ring contained 35 percent more particles and fragments than originally assumed. This is due to the fact that the transparency of the ring is highly dependent on the viewing angle. In this ring there were also indications of up to 10 million very small moons, so-called "moonlets", which are approx. 100 m tall. They could provide more information about how the rings of Saturn came about.
On May 4, it was announced that the dark areas previously interpreted as oceans in the equatorial regions of Titan are in fact sand dunes. This was the result of investigations with the Cassini radar system. The structure of these dunes is very similar to those on Earth (see picture on the right). They were created by a combination of strong tidal effects from Saturn and slow winds near the ground.
During a flyby on July 22nd, several methane lakes around Titan's North Pole were discovered using the radar system. With a high probability they could be identified as the source of the hydrocarbons in the atmosphere, thus achieving an important mission goal. The lakes have a diameter of 1 to 100 km.

On September 19, the JPL announced that a new Saturn ring had been discovered during an observation two days earlier. This was carried out when Saturn obscured the sun for the longest time up to now (12 hours), whereby the rings were illuminated extremely strongly without direct sunlight overloading the Cassini instruments. The new ring is located in the area of the E and G rings and coincides with the orbits of Janus and Epimetheus . Hence, astronomers assume that meteorite impacts on these moons are the source of the ring's particles. Due to the long observation time, it was also possible to establish beyond doubt that ice particles escaping from Enceladus migrate into the E-ring of Saturn and are thus significantly involved in its formation.
On October 11, the JPL announced that it had discovered significant changes in the structure of the innermost ring, the D-ring. It had several bright spots where vertical distortion had occurred. The regular intervals between the disturbances, which occur approximately every 30 km, are also noticeable. Presumably this distortion of the ring structure was caused either by a collision with a meteorite or with a small moon. The Hubble space telescope was able to perceive changes in the structure of the D-ring as early as 1995 and, in combination with Cassini's data, dated the collision time to 1984.
On November 9, it was announced that Cassini had discovered an extraordinary storm while flying past Saturn's south pole. He has a clearly defined eye around which high mountains of clouds circle. Its structure thus resembles a hurricane on earth. The storm reaches speeds of 550 km / h, measures approx. 8000 km in diameter and the tower clouds reach heights of up to 75 km. In contrast to hurricanes on Earth, the storm system does not move, but remains stationary at the South Pole.
On December 12th, the JPL announced that a mountain formation with the highest mountain on the moon to date had been found on Titan. The formation was discovered with the help of the radar and infrared system and is almost 150 km long and 30 km wide. Due to the high resolution of up to 400 m per pixel, structures that resemble lava flows could also be recognized. The peaks of the massif rise up to 1.5 km into the sky and are covered on their peaks by several layers of organic, white material, which could possibly be methane snow.
Mission history 2007

A possible explanation for the geysers on Enceladus was released on March 12th. The heat required for their creation is said to come from relatively short-lived radioactive isotopes of aluminum and iron , which are said to have heated up the core of the moon considerably shortly after it was formed several billion years ago. Later, longer-lived radioactive elements and the enormous tidal forces of Saturn are said to have kept the core warm and fluid. This is supported by the discovery of molecules from the fountains, which can only arise at high temperatures (up to 577 ° C). This model (commonly referred to as a “hot start”) and measurements by Cassini also point to liquid water and a wide variety of organic compounds under the surface of the moon, which could also harbor life as a result.


On May 8, it was announced that the jet streams on Saturn are being propelled by large storms in the atmosphere. Initially, the exact opposite was suspected, namely that the jet streams would create the storms. Long-term observations over several hours, however, showed that storms give off impulse energy to the winds at their outer limit. This also explains why the alternating pattern of west and east blowing jet streams can remain stable for a long time.
On June 14th it was announced that the moons Tethys and Dione are most likely geologically active, contrary to previous knowledge. This finding was made by tracing ionized gases from Saturn's rings. Calculations showed that large quantities of this plasma originate from the two moons, so that these must have a certain form of geological activity, possibly even volcanism, which causes the release of the gases.
During a close flyby (1640 km altitude) of Iapetus , Cassini provided hundreds of high-resolution images of its surface. Of particular interest was the 20 km high mountain ring that encompasses a large part of the lunar equator. This ring has existed since the formation of the moon, when Iapetus was still rotating very quickly and rock piled up due to the high centrifugal forces at the equator. However, due to the rapid decay of the radioactive isotopes aluminum-26 and iron-60, the temperature of the core and the crust decreased rapidly, causing the mountain ring to solidify, even before the tidal forces of Saturn reduced the speed of rotation to such an extent that it flattened at higher temperatures would. Thanks to the absence of geological processes and erosion, the ring has largely been preserved to this day, several billion years after its formation.
On October 10, it was announced that the ice particles ejected by Enceladus, as previously suspected, came from geysers in warm crevices on its surface. These are known as tiger stripes because they resemble the pattern of tiger skin in pictures . These strips are the hottest places on Enceladus, with a temperature of up to 90 K (surface temperature is around 75–80 K), so that ice and gases are heated enough to escape into the atmosphere and later into space.
The assumption that there are a large number of small moons (so-called "moonlets") near Saturn's rings was confirmed by a report on October 24th. The first were found in the A-ring due to their propeller-like structure. This is ring material that has been concentrated in front of and behind them by the gravity of the small moons. These "propeller blades" are approx. 15 km long. How the moons themselves came into being has not yet been clarified with certainty; one suspects collisions with other celestial bodies and breaking due to Saturn's strong gravity .
On December 12, it was announced that Saturn's rings are likely to be much older than previously thought. Previous observations by the Hubble Space Telescope and the Voyager probes indicated that they were formed about 100 million years ago, while measurements with the instruments of Cassini indicate that the rings are about 4.5 billion years old. One could also observe a form of recycling in the rings: existing small moons are broken down further and further and thus provide material for the rings, where it then clumps together again and new moons are formed.
Mission history 2008
On March 6, it was announced that the moon Rhea will be the first of its kind to have at least one ring of its own. The ring that was found consisted of a multitude of fragments and was several thousand miles in diameter. Another ring of dust could be up to 5900 km from the center of the moon. The find confirms mathematical models according to which a ring would be possible. The Magnetospheric Imaging Instrument provided the most direct indication during a close flyby in 2005. When passing an altitude mark, the amount of the impacting electrons dropped rapidly and clearly, so that matter had to be present to shield the instrument. When the same effect reappeared on the other side of Rhea at the same distance, suspicions quickly fell on the existence of a ring around the moon, since Uranus' rings had already been found in a similar way. The source of the fragments and the dust is assumed to be a collision with a large comet or asteroid, as happened to many moons in the Saturn system. The ring theory has been disproved since August 2010, as none could be found in photos.

On March 20, it was announced that there may be a water / ammonia ocean under the crust of Titan . This is seen as the cause of a slight change in the rotation of the moon. This change was detected by the radar remeasurement of about 50 unique landmarks that had moved up to 30 km from their expected position compared to previous measurements. According to the responsible scientists, such a strong movement can occur when Titan's rock crust is uncoupled from its core. An ocean at a depth of about 100 km below the crust is said to cause this decoupling. In addition, it should be rich in organic compounds, which makes it particularly interesting for astrobiologists.
On June 6, it was announced that small moons (so-called "moonlets") are colliding with the toroid within Saturn's F-Ring, which can explain its frequent changes within a short period of time. According to the current state of science, it is the only place in the solar system where collisions take place on a daily basis. The recordings on which this knowledge is based were taken in 2006 and 2007.
On July 30th, NASA confirmed that at least one of the lakes discovered on Titan is filled with liquid hydrocarbons. This makes the moon the first place in the solar system after Earth where liquids have been detected. In the course of more than 40 fly-bys, it was also found that there is no global ocean, as was often assumed before the mission, but a multitude of lakes that are distributed over the entire surface. The discovery also verifies the assumption of a closed methane cycle on Titan, which is very similar to the water cycle on Earth.

On October 13, it was announced that another major storm was found at Saturn's North Pole. The cloud formations can only be seen against the background of the inner warmth of Saturn, which is why only instruments with infrared detectors can be used for observation. The storm rotates at a speed of 530 km / h and is surrounded by a hexagon-shaped structure that does not seem to move despite this high speed. Further images of the South Pole, however, suggest that massive thunderstorms in the lower layers of the atmosphere are driving the local storms.
According to a November 12 publication, a form of aurora, unique in the solar system, was discovered at Saturn's north pole. It radiates in the infrared spectrum and covers a very large area without showing a structure made up of several individual aurora rings (corona). Furthermore, according to the previous models, this Aurora should not exist. It is located in the area from 82 ° north to the pole and is in a blind area of the Hubble telescope for infrared observations. In contrast to Saturn's main aurora, which radiates in the ultraviolet spectrum, its size is not constant. It changes at high speed and can even disappear completely for a short time. These surprising observations show that Saturn's magnetic field is not yet fully understood and has some special, undiscovered properties.
Further information on Enceladus' geological activity was published on December 15. The latest high-resolution images show that the icy surface is changing, especially at the South Pole, where the ice geysers are located, supplying and maintaining Saturn's E-Ring with new material. The ice masses behave somewhat like the tectonic plates on Earth, being pushed in all directions from the South Pole. This phenomenon, which also creates the so-called Tiger Stripes, is comparable to the Mid-Atlantic Ridge . The energy source for these movements has not yet been determined with certainty, but the patterns generated suggest a mechanism of heat and convection similar to that on earth. The image evaluation team was also able to determine that the ice geysers are not stable over time. It is believed that they are clogged by condensed water and then covered by falling ice. As a result of the closure, pressure then builds up, which is discharged in the formation of new geysers.
Mission history 2009

On January 29th, NASA confirmed that at least some of the dark areas at Titan's South Pole are actually hydrocarbon-filled lakes. This was derived from the changes over the past few years. The observed areas changed their albedo value several times, which is attributed to the fact that these are lakes that are filled by rain and then evaporate again. It was also found that this evaporation effect cannot adequately supply the atmosphere with methane, so there must be other sources. Taking into account previous observations, it is now assumed that there are underground methane reservoirs. In the meantime, the entire surface of the moon has also been recorded by the ISS instrument, which makes it much easier to find other lakes by comparing images.
On June 24th it was announced that the element sodium had been found in the E-ring of Saturn using the Cosmic Dust Analyzer developed in Germany . Since the ring material (primarily water ice) comes from geysers on Enceladus, some conclusions could be drawn about its inner workings. Nowadays (as of 2010) it is assumed that at least caverns with liquid water must exist under its surface. This is the only way to explain the relatively large amount of sodium detected, as this would not be possible through direct sublimation. It must have been released from the rock of the moon by slowly washing it out with liquid water. Furthermore, carbonates (including soda ) were also detected in the ring material, which supports the hypothesis of a global ocean below Enceladus surface, as this was predicted by corresponding models. The slightly basic pH value of the solution also provides favorable conditions for the formation of precursors in liquid water. Another research team on the mission points out, however, that direct measurements of the emitted material by Enceladus have not yet found any salts. This indicates that the sodium does not escape through the periodically erupting geysers, but through slower, smaller and stable outlets.
Research was released on July 22nd supporting the theory of liquid water beneath the surface of Enceladus. Specifically, during the flyby on October 8, 2008, the INMS instrument clearly detected ammonium in the moon's ice / water jets. Among other things, ammonium acts as a strong anti-freeze agent , so that water mixed with it remains liquid at temperatures down to 176 K. Since temperatures of 180 K and more were measured on the "tiger stripes", liquid water below the surface has become more likely again.
Due to the progressive degradation of the eight primary attitude control engines , they were switched off and the secondary engines activated. The process took an entire week in mid-March, which meant that scientific observations were only possible to a limited extent.

On September 21, it was announced that, contrary to earlier assumptions, the rings of Saturn are not flat, but rather have a clearly three-dimensional profile. This knowledge was gained during an extensive observation program around August 11th, when the rings were illuminated by the sun at an angle of 0 ° (i.e. exactly from the side) during the equinox . In this way, previously identified irregularities could also be measured with regard to their height. In the main rings, the height of which had previously been estimated at around 10 m, mountain-like formations were discovered that were up to 4 km high. Even more even and longer formations were discovered, which rise like walls up to 3 km above the ring plane. Due to the practically non-existent solar radiation, the temperature of the A-ring fell to 43 K, a new record low, so that further conclusions about the materials and thermodynamics are possible.

According to the JPL, the most interesting discovery of 2009 was the special modulation of the radio signals emitted by Saturn in the kilometer range (up to 300 kHz). When the period of rotation of the planet was extrapolated from the radio radiation of the magnetosphere over the past few years, it was found that the results were far from those from other observations: every ten minutes there would have been a deviation of 30 seconds. In addition, this deviation changed constantly and was also dependent on the latitude. From this it is concluded that the magnetic field of Saturn, which generates the kilometer radiation, is not “connected” to the interior of the planet and is therefore decoupled from the rotation. In addition, the observable modulation periods in the north are shorter than those in the southern hemisphere. The cause is suspected to be the conductivity of the southern hemisphere, which is influenced by solar radiation.
In the course of the year, two different types of clouds could be identified that are associated with the thunderstorms on Saturn. On the one hand, there are relatively bright ammonia clouds, and on the other, unusually dark clouds that strongly absorb light in the visible and infrared spectrum. The presence of ammonia ice had already been suspected, but only the bright clouds of the thunderstorms could confirm this. According to analyzes, the dark clouds contain a larger amount of carbon, which is formed from methane by the heat of the lightning bolts by means of pyrolysis .
Mission history 2010

A high-resolution map of the temperature distribution of Mimas produced by the CIRS instrument in March led to a surprising discovery. The pattern of temperature distribution on the moon is very similar to Pac-Man , a character from the video game of the same name from 1980. It was actually expected that the temperature would vary in smooth transitions and would reach its maximum in the early afternoon. Instead, the Pac-Man-like region peaked early in the morning (92 K, versus 77 K on most of the rest of the surface). The Herschel crater is also significantly warmer at 81 K and can be seen as a point in Pac-Man's mouth. This temperature difference can be explained by the crater rims, which are up to 5 km high. The walls keep the heat in the crater longer. The cause of the "Pac-Man temperature distribution" remains completely unexplained. Some planetologists suspect that material differences on the surface could be responsible. In the cold regions, old, dense ice would quickly dissipate the heat into the interior of the moon, while a young, powder-like layer in some regions could reduce thermal conductivity through insulation. The reasons for this unequal distribution include residues from meteorites and the gravitational influence of Saturn.
More detailed results on Titan's inner workings were published on March 11th. A large number of gravitational measurements led to the conclusion that there is a mixture of rock and ice at depths greater than 500 km. This means that the interior of the moon has never become particularly warm, as this would have led to the formation of clearly defined areas over time, similar to the earth's crust . Titan's surface is therefore only homogeneous down to a depth of approx. 500 km, as this area consists almost exclusively of pure ice. These discoveries do not confirm the assumption of an ocean below the lunar surface, but they still remain plausible.

On April 14th, NASA released the first video of lightning strikes on another planet (Saturn). These recordings were not possible until then, as the planet was too bright even on the night side, as the rings reflected large amounts of light. However, due to the current position of the planet in relation to the sun, this reflection is significantly reduced so that lightning can now also be detected optically. During the measurements it was found that the lightning bolts are at least as strong as the largest of their kind on Earth. The storms in which they occur are relatively rare (usually only one at a time on the entire surface), but they can last for several months.
On November 2nd, for reasons that were initially unexplained, Cassini automatically switched itself to so-called "safe mode" (for the sixth time since the start, for the second time in the Saturn system), whereby all scientific instruments were switched off and only the orbit control and the communication system were active stayed. This implied that there had been a serious fault in the probe's hardware or software. After a few weeks the error was discovered in the "command and data subsystem". One bit had changed its value ( single event upset ), so that an important command could not be written to the register of the associated processor. The Cassini safety system correctly recognized this as a critical error and immediately switched itself to "safe mode". After restarting the systems, the scientific systems were fully operational again on November 24th. On November 30, the probe performed a flyby of Enceladus as planned.
During the expansion mission “Solstice” since October 10, 2010, Saturn is to be circled a total of 155 times and flown past Titan and Enceladus 54 times and 11 times, respectively.

On December 14th, NASA announced that several potential cryovolcanoes had been found on Titan . On a newly created 3D map of the mountain "Sotra Facula" one recognized clear parallels to volcanoes on earth such as Etna in Italy. Up until now, many formations could be interpreted as consequences of erosion or tectonics, but Sotra Facula's two peaks over 1 km high can best be explained by cryovolcanism. This has not yet been confirmed by direct observations, so the mountain will be observed more closely in the future.
According to a report from December 14th, the changeable radio waves emitted by Saturn in the kilometer range could now be explained, which had caused confusion in the previous year . Huge clouds of hot plasma were found that periodically form and move around the planet. This movement has a significant impact on the planet's magnetic field, which in turn changes radio emissions. According to the responsible scientists, the plasma eruptions can be traced back to a collapse of the so-called "magneto-tail". This is the part of Saturn's magnetosphere facing away from the Sun , where it is stretched by the solar wind . There is strong evidence that this contains cold plasma from the moon Enceladus, which is influenced by centrifugal forces. As a result, the field is stretched more and more until it finally collapses and hot plasma is released in the internal magnetic field.
Mission progress 2011

Throughout the year, Cassini regularly observed the storm in the northern hemisphere, the first signs of which were recorded in late 2010. The storm now clearly spans the entire planet. It has a north-south extension of 15,000 km and an area of around 5 billion km 2 . Storm observation is now a regular part of the schedule, with earth-based telescopes such as the VLT of the Paranal Observatory being used for the investigation.
In March, methane rains were detected in the lowlands for the first time on the moon Titan. This was made possible by observing a large cloud formation, as the ground had become significantly darker after it had passed. This change, which extends over 500,000 km 2 , can best be explained by methane precipitation over these areas. In general, the climate is comparable to the tropical regions of the world, where there are significant differences in the amount of precipitation depending on the season.
On June 22nd, the JPL announced that it had found clear evidence of a deep salt lake or ocean on Enceladus. During a low flight through the geyser fountains of the moon, the CDA instrument measured surprisingly high concentrations of sodium and potassium . Since these elements would have been removed from the water through the process of ice formation and subsequent evaporation, it must have come into contact with rock in liquid form. This implies a larger water reservoir under the surface of the moon, estimates speak of depths of up to 80 km. Long-term observations of the UVIS instrument support this assumption. According to the ESA project manager, the possibility of a saltwater ocean also increases the chances of life on icy worlds.
At the end of March, two papers on the anomalies in the C and D rings of Saturn were published in the journal Science . These attribute the wave-like bulges in the rings to a collision with comet remains in the second half of 1983. This is based, among other things, on similarities with the ring faults of Jupiter as a result of the collision with Shoemaker-Levy 9 in the summer of 1994.
In April, the JPL published the first material on a recently discovered electromagnetic link between Saturn and its moon Enceladus. This was found after extensive investigation of Cassini's data from 2008 and explains the ring-shaped ultraviolet aurora at Saturn's north pole. It is created by the impact of electrons that come from the water plasma above Enceladus and are conducted from there to the North Pole by the associated magnetic field.
Mission history 2012

On March 2, the JPL announced that Cassini had, with the help of the INMS, detected ionized molecular oxygen in the vicinity of Dione for the first time. Thus the moon has an extremely thin atmosphere with only one oxygen molecule per 11 cm³ of space volume, which corresponds to the earth's atmospheric pressure at an altitude of about 480 km. Water ice is assumed to be the source, from which the molecules are either released by cosmic rays or solar photons.
On March 31st, two papers on a new species of plasma were published near Enceladus. By evaluating data from a close flyby in 2008, so-called “dust plasma” could be detected, which had previously only been predicted theoretically. It arises from interactions between the ejected materials from the "tiger stripes" at the south pole of the moon with the ions trapped in Saturn's magnetic field. The Enceladus particles are just the right size to exchange electrons with the existing plasma, which significantly changes and influences the properties of the mixture. This is in contrast to the typical “dust-in-plasma” combination, in which the two substances are spatially close, but hardly interact with each other because the size or chemical structure does not match. The dust plasma at Enceladus is the only opportunity besides the upper earth atmosphere to study this in a natural environment and is therefore of particular interest for plasma research.
On July 27, the JPL published an investigation into the internal structure of the moon Titan. A highly accurate measurement of the deformation of its surface suggests that there is a global ocean of water below the surface. If the moon were made entirely of rock, the surface would only rise and fall by about 1 m during a 16-day orbit around Saturn due to its enormous gravitational forces. However, by evaluating the acceleration and position data from Cassini during close-by fly-bys, lifts of up to 10 m could be determined. According to the scientists involved, this can only be explained by an underground ocean, which most likely consists of water. This would give the upper crust of the moon the necessary freedom of movement to deform as observed.

In June, Cassini was able to discover the first signs of the change of seasons on Titan. This can be seen from clearly visible eddies at the South Pole. In contrast to the earth, however, these do not only occur near the surface, but extend into the stratosphere of the moon. In this way, large quantities of aerosols are also transported into the upper atmosphere, as a result of which an independent layer of haze has formed over it.
On October 28, the JPL released data on the aftermath of the previous year's great storm , which has now largely subsided. An enormous temperature increase of 83 K was measured in the stratosphere of Saturn, which corresponds to a difference between the winter Alaska and the Mojave desert in summer. In addition, large amounts of ethene were discovered, the source of which is still unknown. These results are surprising for planetologists , as the planet's stratosphere is actually considered to be very stable and calm. The measurements were primarily made with the CIRS instrument, which also covers wavelength ranges that terrestrial telescopes cannot evaluate due to absorption by the earth's atmosphere ( atmospheric window ).
On November 26th, the JPL announced that another “ Pac-Man ” thermal signature had been found with the help of the CIRS instrument . Such a pattern, first detected on Mimas , can also be found on the moon Tethys . This finding supports the assumption that high-energy electrons change the properties of the surface significantly. These mainly affect the equatorial regions facing the direction of flight, where they transform the generally loose surface into solid ice. As a result, these areas heat up less strongly during the sunshine and cool down more slowly at night than the less severely affected part of the surface. This ensures temperature differences of up to 15 K between the individual regions on Tethys.
Mission history 2013
.jpg)
On July 19, Cassini made a picture of the earth with Saturn and its rings in the foreground. Due to the great distance (1.5 billion km), the earth can only be perceived as a small bluish dot and is reminiscent of the pale blue dot image taken by Voyager 1 . The picture was only possible because of the position of Saturn to the sun, since its extreme brightness was shielded by the planet.

Further findings regarding the fountains on Enceladus were published at the end of the month. These are controlled by the gravitational effects of Saturn. If the moon is close to it, the fountains are not very active, while they are much more active at greater distances. It is believed that this happens through the closing or opening of the "tiger stripes" due to the gravitational forces of Saturn. In addition, the behavior of the moon also provides further evidence of an ocean of liquid water beneath the surface of the moon.
Results were published on September 30th showing the existence of propylene in the atmosphere of Titan. This is an organic compound that is also used in the manufacture of commercial plastic . It is the first evidence of the substance outside the earth and fills a gap in the suspected carbon chain of the moon. The discovery had dragged on for a long time because of the weak and inconspicuous signature of propylene. Ultimately, however, a detailed analysis of the CRIS data provided the necessary evidence.
At the end of 2013, the land masses and, above all, the hydrocarbon lakes could be examined and mapped more precisely with the help of radar. It was also possible to make use of a new analysis technology that makes it possible to receive radar signals from the bottom of the lakes. Here, depths of over 85 m were measured at at least one point. In general, it was also found that practically all lakes are concentrated in an area of 900 by 1800 km in size, where the geological conditions are particularly favorable for their formation. Around 97 percent of the total precipitation falls within this area.
Mission history 2014
By analyzing the data on Enceladus that Cassini had collected over the years, it was announced on April 3rd that the existence of an underground ocean that had already been predicted many times could be confirmed. During the total of 19 fly-bys, the moon's gravitational field was precisely measured using the Doppler effect observed in the probe's radio signal. In combination with the observed deviations in the trajectories after three particularly close pass-bys, it was possible to determine that a region of the South Pole is more dense than was supposed from the images of the surface. An ocean of liquid water is believed to be the most likely cause. Whether this also feeds the intensively investigated geysers was still unclear at the time, but is considered likely.
On June 23, the results of a study co-financed by the ESA were published, which show that the basic building blocks of titanium originate from before the solar system, i.e. before the sun was born. This refutes the widespread view that the elements were formed during the formation of Saturn. This was determined by measuring the isotope ratio of nitrogen -14 and -15, from which the age of the atomic nuclei can be derived.
Further studies of the ocean data on Enceladus were released on July 2nd. Its salt content is said to be possibly at the level of the Dead Sea . This is inferred based on the assumed density of the ocean. This is so high that a high concentration of salts from sulfur , potassium and sodium is assumed. In addition, the very rigid ice sheet of Enceladus suggests a slow freezing of the ocean. As a result, it can also be assumed that all methane emissions at the few breakthroughs take place in a locally limited manner. However, this can hardly be determined exactly with the instruments of Cassini, for this a further mission with specialized instruments would be necessary.

On October 1st, the discovery of a large cloud at the South Pole of Titan was announced. This consists of highly toxic hydrogen cyanide and measures several hundred kilometers in diameter. According to the models used up to then, this should not be possible, as a temperature of around −50 ° C was predicted for the affected area, which would be significantly too warm for this connection to form. Measurements with the CIRS instrument, however, confirmed significantly lower temperatures of below −150 ° C. As a result, Titan's southern hemisphere cools down significantly more than previously assumed during the coming autumn.
Studies of the orbit of the moon Mimas suggests that Mimas may also harbor an ocean below its surface, according to a publication dated October 16. At this point in time, however, it was not possible to say whether this was still liquid or already frozen. The density anomaly was discovered when its exact orbit was calculated from the photos of the moon with Saturn. The orbital disturbances discovered were twice as large as they were predicted for a "dry" moon, and thus allow the conclusion of a significantly different internal structure. If it were a liquid water ocean, it would be at a depth of about 30 km.
In a publication dated December 18, the data from the 2000 flyby of Jupiter's moon Europa were analyzed again. In doing so, the data from the UVIS instrument was used primarily to examine the moon's atmosphere more closely. It turned out that this is much thinner than previously assumed. Because of the geysers in Europe, it was assumed that it would release large amounts of water, oxygen and plasma into the vicinity of the Jupiter system. The measurements showed, however, that Europe's atmosphere was already 100 times thinner than expected and emitted 60 times less oxygen into space than expected. The gases and plasmas found in the vicinity of Europe's orbit during previous investigations probably come mainly from the much more active moon Io .
Mission history 2015

On March 11, it was announced that initial evidence of hydrothermal activity on Enceladus was now available. With the help of the Cosmic Dust Analyzer , microscopic rock particles have been found in the entire Saturn system since the arrival of Cassini. After four years of intensive research and experiments, it has been concluded that the particles, which are only a few nanometers in size, come from the moon's ocean. It is believed that they arise when hot water from hydrothermal springs rises from the bottom and the minerals dissolved in it come into contact with colder water near the surface. This process is known from Earth and requires outlet temperatures of over 90 ° C. The nature of the moon's methane emissions also suggests hydrothermal sources. The formation of clathrates is possible due to the high pressure at the bottom of the ocean . These crystal structures made of water ice could capture the methane escaping from the springs and transport it safely to the geysers, which could explain at least part of the methane they contain.
An article was published on April 13th that provides a possible reason for the great storm on Saturn in 2011. It is part of a 30-year cycle caused by the behavior of water-rich clouds. If these rain down inside the planet and the upper atmosphere cools down through heat radiation into space, they can rise to the cloud surface. In doing so, they disturb the usual convection and thus generate the storms observed. It is now assumed that Saturn has considerably more water than Jupiter, since no such cycle could be observed in the latter.

A collaborative study by NASA and ESA in June led to new insights into the many small lakes on Titan. It is known that these are filled with hydrocarbons , but how the depressions came about was unclear until then. It is now assumed that this is due to a process that already leads to the formation of caves and sinkholes on earth in karst regions . On Titan, however, erosion is not caused by rain from water, but by precipitation from liquid hydrocarbons. Due to the chemical composition and the low temperatures (around −180 ° C), however, the process takes around 50 times longer than on Earth. For this reason, the majority of the depressions and lakes can also be found in the polar regions, as there is more precipitation here than in the dry equatorial region.
During the flyby of the New Horizons probe to Pluto , Cassini supported the mission with a parallel observation of the planet from the Saturn system. Due to the great distance, this only appears as a small point, but with the help of Cassini and other probes (e.g. Hubble or Spitzer ) measurements can be made from other angles and over a longer period of time, so that the data from New Horizons can be better integrated Context can be embedded.
A study was published in September suggesting that one of Saturn's rings is made of water ice. During the equinox in August 2009, they were lit exactly from the side, which is why they cooled down temporarily until sunlight fell on the rings again. Temperature measurements by Cassini showed that the outermost region of the A-ring was considerably warmer than predicted by the models. After several new model calculations, the conclusion was reached that this area of the ring consists of ice lumps with a diameter of approx. 1 m. Its origin is not yet known, but remains of an earlier moon are suspected, which was recently destroyed by a massive collision.
Further studies of the moon Enceladus in the same month confirmed the existence of a global underground ocean. Here, the high-resolution images collected over the years were analyzed again in order to be able to precisely measure displacements of the surface. A weak tumbling motion, also known as libration , was found. Model calculations showed that the observed extent would be too great if the surface were firmly connected to the interior of the planet. However, assuming a global and liquid ocean, the values can be explained.
Mission history 2016
In May it was announced that the latest investigations into the fountains on Enceladus had refuted previous assumptions about their behavior. It was originally assumed that the moon would release considerably more water into space at a great distance from Saturn due to the tidal forces. Instead, the amount only increased by 20%. This is currently attributed to a complex inner structure of the moon which, under the influence of gravity, can not only open but also close channels.
More detailed investigations of the lakes of Titans led to the realization in April that the great lakes on Titan are filled with pure methane. Before the Cassini mission, it was assumed that the lakes were filled with it because of the large amount of ethane in the atmosphere. Years of observation with radar and infrared instruments made it possible for the first time to examine the sea floor on an extraterrestrial object. This is up to 160 meters deep and is covered by a thick layer of organic compounds. In addition, the coasts are very porous and saturated with hydrocarbons.

On March 24, 2016, the probe identified the highest point on the moon Titan at an altitude of 3,337 meters. On March 30, 2016, Cassini-Huygens reduced the inclination of the orbit in order to fly past moons more often. From the polar region of Saturn, 22 high-resolution images of the rings were taken on November 30th.
On August 9, it was announced that a 2013 radar survey confirmed the presence of very steep canyons on Titan’s surface. These have a slope of up to 40 ° and are up to half a kilometer deep. In all likelihood, the canyons were formed as a result of intense liquid erosion. This in turn indicates a large atmospheric turnover of methane, which also collects on the bottom.
On December 9th, the first recordings of the previous overflight of the North Pole of Saturn were published, which was only made possible by the orbit adjustments for the very last section of the Cassini mission. What can be seen is a pronounced and sharply delimited hexagonal vortex that rotates around the North Pole.
Mission progress 2017
On April 13, 2017, the scientists announced the discovery of hydrogen on the moon Enceladus . It is assumed that hydrothermal springs are on the celestial body. On April 26, 2017, Cassini-Huygens' last section of the mission began. During the planned 22 orbits of Saturn, new areas on the planet should be constantly explored before the probe burned up in a controlled manner in its atmosphere. On April 26, 2017, Cassini-Huygens was the first space probe to cross the gap between the planet Saturn and its innermost rings. Several high-resolution images of the innermost ring system of Saturn were made. On May 24, 2017, the probe observed the change of the seasons in the northern and southern hemisphere of Saturn.
The Grand Finale 2017


The Cassini-Huygens mission ended on September 15, 2017. A further extension was no longer possible due to a lack of fuel. At the end of the mission, Cassini burned up in a controlled manner inside Saturn. This was to prevent microorganisms from Earth adhering to the probe from contaminating the moons Titan or Enceladus . The last phase was prepared by a series of course changes towards the end of 2016, which brought the probe onto a course over the polar regions that was both close and steeply past the F-ring. From this perspective, the hexagonal flow of the polar region and the rings could be observed. The grand finale began with a close flyby of Titan on April 21st. As of April 26, there were 22 orbits through the gap between the rings and the surface of Saturn. The last passes led through the upper layers of the gas planet, where measurements of ring particles and, for the first time, direct measurements of the gas layers were made. Cassini should collect as much data as possible about the rings and the gas layers. The last rounds were risky, because the probe could have been damaged by ring material or by friction with the gases or it could have started to spin, so they were placed at the end of the mission. The course followed free fall, required only minimal stabilization and was chosen in such a way that failure of systems or lack of fuel could in no case lead to contact with one of the moons. Cassini also used the orbits for investigations with the RSS to learn more about the gravitational field, the outer gases and the rings of Saturn. The mass of the rings can be calculated from the trajectory and the measurements of the deep space network. During the last orbit, Cassini experienced one final minimal course change by Titan, so that she subsequently entered Saturn. During the last phase on September 15, 2017, the probe did not save any more data and did not take any more pictures, but instead directed the antenna towards Earth and sent the data obtained directly to Earth until the end of the mission, before it burned up in Saturn. The antennas of the European ESTRACK network and NASA's own DSN were used to collectively receive the radio signals from Cassini in order to achieve the best scientific benefit.
References
literature
- CT Russell: The Cassini-Huygens Mission: Overview, Objectives and Huygens Instrumentarium . Springer-Verlag GmbH, 2003, ISBN 1-4020-1098-2 .
- David M. Harland: Mission to Saturn: Cassini and the Huygens Probe . Springer, Berlin 2003, ISBN 1-85233-656-0 .
- Michele Dougherty, Larry Esposito, Tom Krimigis: Saturn from Cassini-Huygens . Springer Netherlands, 2009, ISBN 1-4020-9216-4 .
- Robert Brown, Jean Pierre Lebreton, Hunter Waite: Titan from Cassini-Huygens . Springer Netherlands, 2009, ISBN 1-4020-9214-8 .
- Jean-Pierre Lebreton, Olivier Witasse, Claudio Sollazzo, Thierry Blancquaert, Patrice Couzin, Anne-Marie Schipper, Jeremy B. Jones, Dennis L. Matson, Leonid I. Gurvits, David H. Atkinson, Bobby Kazeminejad & Miguel Perez-Ayucar: An overview of the descent and landing of the Huygens probe on Titan. nature, Vol 438 | 8 December 2005, doi: 10.1038 / nature04347 PDF
Broadcast reports
- Karl Urban : Rings, Moons, Adventure - Cassini dies on Saturn , Deutschlandfunk - “ Science in focus ” from September 10, 2017
Web links
- Information on the distance of Cassini-Huygens from the sun and the direction. The table shows the year and day of the year as the date. NASA website for data retrieval .
- NASA website on Cassini
- ESA website on the mission, especially Huygens
- Several articles on the mission by Bernd Leitenberger
- NASA homepage on Cassini-Huygens
- More than 100 German-language special pages on Cassini-Huygens at Raumfahrer.net
- Space-time podcast on Cassini-Huygens
- Spektrum .de: The ten most important discoveries by Cassini September 12, 2017
Individual evidence
- ↑ JPL - The Grand Finale Toolkit. Retrieved January 27, 2018.
- ↑ JPL: Cassini Equinox Mission.
- ↑ JPL: Saturn Tour Dates: 2010. ( Memento of the original from October 22, 2016 in the Internet Archive ) Info: The archive link was inserted automatically and has not yet been checked. Please check the original and archive link according to the instructions and then remove this notice.
- ↑ Emily Lakdawalla: Cassini's awesomeness fully funded through mission's dramatic end in 2017. The Planetary Society , September 4, 2014, accessed August 2, 2015 .
- ^ A b Tilmann Althaus: Cassini-Huygens - The exploration of the Saturn system . In: Stars and Space . Spectrum of Science Publishing Company, October 1997, p. 838-847 ( online [PDF]). Cassini-Huygens - The exploration of the Saturn system ( Memento of the original from May 8, 2007 in the Internet Archive ) Info: The archive link has been inserted automatically and has not yet been checked. Please check the original and archive link according to the instructions and then remove this notice.
- ↑ California Institute of Technology & National Aeronautics and Space administration: Jet propulsion laboratory 1983 annual report. NASA, 1983, accessed January 16, 2020 .
- ↑ a b c d e Cassini-Huygens Saturn Arrival. (PDF; 409 kB) Press Kit June 2004. NASA, June 2004, pp. 11–12 , accessed on March 9, 2011 (English).
- ↑ a b c d e Dennis L. Matson, Linda J. Spilker, Jean-Pierre Lebretin: The Cassini / Huygens mission to the saturnian system. (PDF; 1.1 MB) (No longer available online.) Jet Propulsion Laboratory, Research and Scientific Support Department (ESA / ESTEC), July 24, 2002, pp. 6, 16-20 , archived from the original on June 20, 2010 ; accessed on March 8, 2011 . Info: The archive link was inserted automatically and has not yet been checked. Please check the original and archive link according to the instructions and then remove this notice.
- ↑ a b Charley Kohlhase: Return to Saturn. (PDF; 499 kB) In: The Planetary Report. April 2004, pp. 1–2 , accessed on March 9, 2011 (English).
- ^ Huygens Mission And Project Overview. (pdf) December 2000, accessed April 11, 2018 .
- ^ NASA - Quick Facts. Retrieved December 6, 2009.
- ↑ Mission on the ring planet extended - Cassini space probe orbits Saturn until at least mid-2010. At: dlr.de. May 20, 2008, accessed January 14, 2010.
- ↑ astronews - NASA extends Saturn mission until 2017. February 4, 2010, accessed on December 13, 2010.
- ↑ STOP CASSINI: The Plutonium Probe. Retrieved March 16, 2011 .
- ↑ a b The Top Ten Reasons Why The Cassini Mission With Its 72.3 Pounds Of Deadly Plutonium Must Be Postponed. Retrieved March 26, 2011 .
- ↑ a b c d e f Cassini Program Environmental Impact Statement Supporting Study. (PDF; 1.4 MB) Volume 2: Alternate Mission and Power Study. JPL, July 1994, pp. 57-63 , accessed May 3, 2018 (English).
- ↑ Final Environmental Impact Assessment for the Cassini Mission, Chapter 4. (PDF; 462 kB) NASA, 1995, pp. 36, 48 , accessed on April 22, 2018 (English).
- ^ A b Victoria Pidgeon Friedense: Protest Space: A Study Of Technology Choice, Perception Of Risk, And Space Exploration. (PDF; 38 kB) (No longer available online.) October 11, 1999, p. 30 , archived from the original on March 6, 2002 ; accessed on March 26, 2011 (English). Info: The archive link was inserted automatically and has not yet been checked. Please check the original and archive link according to the instructions and then remove this notice.
- ^ Dispute over the plutonium drive of the Saturn probe Cassini. At: zeit.de. 39/1997.
- ^ Cassini Saturn Probe Undergoes Preflight Testing. At: space.com. January 6, 2014, accessed April 22, 2018.
- ↑ a b The radioisotope elements on board space probes. At: Bernd-Leitenberger.de. Retrieved August 29, 2009.
- ^ A b c d Wayne A. Wong: Advanced Radioisotope Power Conversion Technology Research and Development. (PDF; 600 kB) NASA, December 2004, p. 6 , accessed on December 4, 2012 (English).
- ↑ Todd J. Barber, Insider's Cassini: Power, Propulsion, and Andrew Ging. August 22, 2010. Retrieved April 22, 2018.
- ^ Cassini-Huygens - News - Features - The Story of Saturn. Jet Propulsion Laboratory - California Institute of Technology, January 13, 2004, archived from the original on May 28, 2010 ; Retrieved January 3, 2013 .
- ↑ a b JPL: Cassini Orbiter Engineering Subsystems. Retrieved April 21, 2018.
- ↑ a b c d e f g h Cassini and her mission: The space probe and mission to Saturn. At: Bernd-Leitenberger.de. Retrieved August 31, 2009.
- ^ Computers in space travel, part 2. At: Bernd-Leitenberger.de. Retrieved August 31, 2009.
- ↑ a b c d e f K. F. Strauss, GJ Stockton: Cassini Solid State Recorder. NASA, August 4, 1996, accessed December 4, 2012 .
- ↑ a b c Communications ( Memento from June 6, 2010 in the Internet Archive )
- ^ A b William A. Imbriale, Joseph H. Yuen: Spaceborne Antennas for Planetary Exploration . Wiley-Interscience, 2006, ISBN 0-470-05150-7 , pp. 272-317 .
- ↑ University of Michigan: Maps View - Cassini / Huygens Mission Overview. Retrieved September 1, 2009.
- ↑ ESA: Engineering - Communication. Retrieved September 1, 2009.
- ↑ a b JPL: Huygens Mission to Titan. ( Memento of July 27, 2010 in the Internet Archive ) Retrieved September 1, 2009.
- ↑ a b c d e f g h i j k l m n o University of Colorado: The Cassini Ultraviolet Imaging Spectrograph Investigation. (PDF; 854 kB), accessed on September 27, 2009.
- ↑ NASA: UVIS. ( Memento of December 30, 2009 in the Internet Archive ) Retrieved September 27, 2009.
- ↑ a b c d e f g h i j k l m n o p q Cassini's optical instruments. At: Bernd-Leitenberger.de. Retrieved September 26, 2009.
- ↑ a b c d e f g h i j NASA: ISS Engineering Technical Write-up. ( Page no longer available , search in web archives ) Info: The link was automatically marked as defective. Please check the link according to the instructions and then remove this notice. Retrieved September 19, 2009.
- ↑ NASA: VIMS Engineering Technical Write-up. ( Memento of June 10, 2010 in the Internet Archive ) Retrieved September 27, 2009.
- ↑ a b c d e f g h i j k The Visual And Infrared Mapping Spectrometer For Cassini. ( Memento from January 31, 2012 in the Internet Archive ) (PDF; 161 kB), accessed on September 27, 2009.
- ↑ a b c d CIRS Engineering Technical Write-up , accessed April 12, 2018.
- ^ NASA: RADAR Engineering Technical Write-up. , accessed April 12, 2018.
- ↑ a b c d e f g h i j k l Space Review March 2008: Radar. The Cassini Titan Radar Mapper.
- ↑ a b c d e f g h i j k l m n Cassini's particles and wave experiments. At: Bernd-Leitenberger.de. Retrieved September 28, 2009.
- ↑ a b c d e JPL: RSS Engineering Technical Write-up. ( Memento of May 27, 2010 in the Internet Archive ) Retrieved December 27, 2009.
- ^ A b c d Space Review: The Cassini Radio And Plasma Wave Investigation. September 2002.
- ^ A b c Imperial College London: The Data Processing Unit (DPU). Retrieved October 2, 2009.
- ↑ NASA: MAG Engineering Technical Write-up. , accessed April 12, 2018.
- ^ Imperial College London: The Vector / Scalar Helium Magnetometer (V / SHM). Retrieved October 2, 2009.
- ^ Imperial College London: The Fluxgate Magnetometer (FGM). Retrieved October 2, 2009.
- ↑ a b c d e Instruments. CAPS: Cassini Plasma Spectrometer. Retrieved February 11, 2010.
- ↑ JPL: MIMI Instrumentation. Accessed December 23.
- ↑ a b c JPL: Low Energy Magnetospheric Measurement System. Retrieved December 23, 2009.
- ↑ a b c JPL: Charge Energy Mass Spectrometer. Retrieved December 23, 2009.
- ↑ a b JPL: Ion and Neutral Camera. Retrieved September 2, 2011.
- ↑ JPL: INMS Engineering Technical Write-up. Retrieved April 11, 2018.
- ↑ FU Berlin - Huygens probe. ( Memento from August 12, 2012 in the Internet Archive ). Retrieved September 2, 2009.
- ^ ESA: Huygens. Retrieved December 7, 2013.
- ↑ a b c d e ESA: Engineering - Mechanical & Thermal Subsystems. Retrieved September 2, 2009.
- ↑ a b c d e f g h i j k l m n o p q r s t u v w x y z aa ab Huygens. At: Bernd-Leitenberger.de. Retrieved September 2, 2009.
- ^ ESA: Engineering - Electrical Power Subsystem. Retrieved September 2, 2009.
- ↑ a b c ESA: Engineering - Command & Data Management Subsystem.
- ↑ a b ESA: Engineering - Heat Shield. Retrieved September 2, 2009.
- ↑ a b c ESA: DISR: Descent Imager / Spectral Radiometer. Retrieved December 20, 2009.
- ^ ESA: ACP: Aerosol Collector and Pyrolyser. Retrieved December 16, 2009.
- ^ ESA: Instruments in Brief. Retrieved December 8, 2009.
- ↑ a b ESA: GCMS: Gas Chromatograph and Mass Spectrometer. Retrieved December 8, 2009.
- ↑ a b ESA: DWE: Doppler Wind Experiment. Retrieved December 21, 2009.
- ↑ a b c d ESA: HASI: Huygens Atmosphere Structure Instrument. Retrieved December 21, 2009.
- ↑ M. Fulchignoni et al .: The Huygens Atmospheric Structure Instrument (HASI). (PDF) Retrieved August 21, 2013 .
- ↑ a b c d e ESA: SSP: Surface Science Package. Retrieved December 21, 2009.
- ↑ a b c d e f g h i j k Cassini and her mission: The space probe and mission to Saturn. At: Bernd-Leitenberger.de. Retrieved February 7, 2010.
- ↑ a b c d e Huygens Communications Link Inquiry Board Report. ( Memento of November 26, 2011 in the Internet Archive ). December 20, 2000 (PDF; 85 kB).
- ↑ JPL: Saturn-Bound Spacecraft Tests Einstein's Theory. ( Memento from September 20, 2008 in the Internet Archive ). October 2, 2003.
- ↑ Empirical Foundations of Relativistic Gravity . arxiv : gr-qc / 0504116 .
- ↑ JPL: Cassini Spacecraft Arrives at Saturn. June 30, 2004, accessed April 11, 2018.
- ↑ a b JPL: Cassini's Flyby of Phoebe Shows a Moon with a Battered Past. June 11, 2010, accessed April 11, 2018.
- ↑ a b c The Cassini Mission 2004. At: Bernd-Leitenberger.de. Retrieved February 27, 2010.
- ↑ JPL: Cassini Exposes Puzzles About Ingredients in Saturn's Rings. ( Memento of the original from July 26, 2010 in the Internet Archive ) Info: The archive link was inserted automatically and has not yet been checked. Please check the original and archive link according to the instructions and then remove this notice. July 2, 2004, accessed February 27, 2010.
- ↑ JPL: Out from the Shadows: Two New Saturnian Moons. ( Memento of the original from March 18, 2012 in the Internet Archive ) Info: The archive link was inserted automatically and has not yet been checked. Please check the original and archive link according to the instructions and then remove this notice. August 16, 2004, accessed February 28, 2010.
- ↑ JPL: Cassini Peeks Below Cloud Shroud Around Titan. ( Memento of the original from June 13, 2010 in the Internet Archive ) Info: The archive link was automatically inserted and not yet checked. Please check the original and archive link according to the instructions and then remove this notice. October 27, 2004, accessed February 28, 2010.
- ↑ JPL: Cassini's Radar Shows Titan's Young Active Surface. ( Memento of the original from July 24, 2010 in the Internet Archive ) Info: The archive link was inserted automatically and has not yet been checked. Please check the original and archive link according to the instructions and then remove this notice. October 29, 2009, accessed February 28, 2010.
- ^ ESA: Huygens sets off with correct spin and speed. January 11, 2005, accessed February 28, 2010.
- ↑ a b c d e f g h i The Huygens Mission. At: Bernd-Leitenberger.de. Retrieved February 28, 2010.
- ^ ESA: Huygens descent timeline. Retrieved March 1, 2010.
- ↑ a b c d Europe Arrives at the New Frontier - The Huygens Landing on Titan. (PDF; 405 kB), February 2005, accessed on September 23, 2010.
- ↑ a b JPL: Saturn's Moons Titan and Enceladus Seen by Cassini. ( Memento of the original from June 14, 2010 in the Internet Archive ) Info: The archive link was inserted automatically and has not yet been checked. Please check the original and archive link according to the instructions and then remove this notice. February 18, 2005, accessed September 23, 2010.
- ↑ JPL: Cassini Finds an Atmosphere on Saturn's Moon Enceladus. ( Memento of May 1, 2013 in the Internet Archive ) March 16, 2005, accessed on March 12, 2010.
- ↑ JPL: Cassini Finds New Saturn Moon that Makes Waves. ( Memento of the original from February 9, 2011 in the Internet Archive ) Info: The archive link was inserted automatically and has not yet been checked. Please check the original and archive link according to the instructions and then remove this notice. May 10, 2005, accessed March 12, 2010.
- ↑ JPL: Spongy-Looking Hyperion Tumbles into View. ( Memento of the original from June 14, 2010 in the Internet Archive ) Info: The archive link was inserted automatically and has not yet been checked. Please check the original and archive link according to the instructions and then remove this notice. July 11, 2005, accessed September 20, 2010.
- ↑ JPL: Cassini Finds an Active, Watery World at Saturn's Enceladus. ( Memento of the original from July 3, 2010 in the Internet Archive ) Info: The archive link was inserted automatically and has not yet been checked. Please check the original and archive link according to the instructions and then remove this notice. July 29, 2005, accessed September 20, 2010.
- ↑ JPL: Cassini's Doubleheader Flyby's Score Home Run. ( Memento of the original from June 15, 2010 in the Internet Archive ) Info: The archive link was inserted automatically and has not yet been checked. Please check the original and archive link according to the instructions and then remove this notice. September 29, 2005, accessed October 20, 2010.
- ^ University of Arizona: Scientists Solve the Mystery of Methane in Titan's Atmosphere. March 1, 2006, accessed April 11, 2018.
- ↑ JPL: New Cassini Image At Saturn Shows 'A' Ring Contains More Debris Than Once Believed. ( Memento of the original from June 16, 2010 in the Internet Archive ) Info: The archive link was inserted automatically and has not yet been checked. Please check the original and archive link according to the instructions and then remove this notice. April 6, 2006, accessed September 21, 2010.
- ↑ JPL: Cassini Finds 'Missing Link' Moonlet Evidence in Saturn's Rings. ( Memento of the original from June 16, 2010 in the Internet Archive ) Info: The archive link was inserted automatically and has not yet been checked. Please check the original and archive link according to the instructions and then remove this notice. March 29, 2006, accessed September 21, 2010.
- ^ University of Arizona: Titan's Seas Are Sand. May 4, 2006, accessed April 11, 2018.
- ↑ JPL: Cassini Finds Lakes on Titan's Arctic Region. July 27, 2006, accessed April 11, 2018.
- ↑ JPL: Scientists Discover New Ring and Other Features at Saturn. ( Memento of the original from July 27, 2010 in the Internet Archive ) Info: The archive link was inserted automatically and has not yet been checked. Please check the original and archive link according to the instructions and then remove this notice. September 19, 2006, accessed September 21, 2010.
- ↑ JPL: Saturn's Rings Show Evidence of a Modern-day Collision. October 11, 2006, accessed April 11, 2018.
- ↑ JPL: NASA Sees into the Eye of a Monster Storm on Saturn. ( Memento of the original from June 9, 2010 in the Internet Archive ) Info: The archive link was inserted automatically and has not yet been checked. Please check the original and archive link according to the instructions and then remove this notice. November 9, 2006, accessed September 22, 2010.
- ↑ JPL: Massive Mountain Range Imaged on Saturn's Moon Titan. ( Memento of the original from July 23, 2010 in the Internet Archive ) Info: The archive link was inserted automatically and has not yet been checked. Please check the original and archive link according to the instructions and then remove this notice. December 12, 2006, accessed September 22, 2010.
- ↑ JPL: A Hot Start Might Explain Geysers on Enceladus. ( Memento of the original from December 5, 2014 in the Internet Archive ) Info: The archive link was inserted automatically and has not yet been checked. Please check the original and archive link according to the instructions and then remove this notice. March 12, 2007, accessed October 2, 2010.
- ↑ JPL: Cassini Finds that Storms Power Saturn's Jet Streams. ( Memento of the original from June 9, 2010 in the Internet Archive ) Info: The archive link was inserted automatically and has not yet been checked. Please check the original and archive link according to the instructions and then remove this notice. May 8, 2007, accessed October 2, 2010.
- ↑ ESA / JPL / SWRI / STFC: Cassini Finds Saturn Moons Are Active. ( Memento of the original from 23 August 2010 in the Internet Archive ) Info: The archive link was automatically inserted and not yet checked. Please check the original and archive link according to the instructions and then remove this notice. June 14, 2007, accessed October 5, 2010.
- ↑ JPL: Saturn's Moon Iapetus is the Yin-and-Yang of the Solar System. ( Memento of the original from 23 August 2010 in the Internet Archive ) Info: The archive link was automatically inserted and not yet checked. Please check the original and archive link according to the instructions and then remove this notice. September 12, 2007, accessed October 5, 2010.
- ↑ JPL: Saturn's Old Moon Iapetus Retains its Youthful Figure. ( Memento of the original from June 11, 2010 in the Internet Archive ) Info: The archive link was inserted automatically and has not yet been checked. Please check the original and archive link according to the instructions and then remove this notice. July 17, 2007, accessed October 5, 2010.
- ^ Space Science Institute: Cassini Pinpoints Hot Sources of Jets on Enceladus. ( Memento of the original from June 12, 2010 in the Internet Archive ) Info: The archive link was inserted automatically and has not yet been checked. Please check the original and archive link according to the instructions and then remove this notice. October 10, 2007, accessed October 6, 2010.
- ^ University of Colorado at Boulder: First Known Belt of Moonlets in Saturn's Rings. ( Memento of the original from June 16, 2010 in the Internet Archive ) Info: The archive link was inserted automatically and has not yet been checked. Please check the original and archive link according to the instructions and then remove this notice. October 24, 2007, accessed October 6, 2010.
- ↑ JPL / University of Colorado at Boulder: Saturn's Rings May Be Old Timers. December 12, 2007, accessed October 6, 2010.
- ↑ JPL: Saturn's Moon Rhea Also May Have Rings. ( Memento of the original from December 8, 2010 in the Internet Archive ) Info: The archive link was inserted automatically and has not yet been checked. Please check the original and archive link according to the instructions and then remove this notice. March 6, 2008, accessed November 12, 2010.
-
^ Tilmann Althaus: No rings around Saturn's moon Rhea. At: Astronomie-Heute.de. August 2, 2010. The source is given there:
Lauren Gold: No rings around Saturn's Rhea, astronomers find. At: News.Cornell.edu. July 29, 2010. Both accessed November 28, 2010. - ↑ JPL: Strong inference of a liquid water layer in Titan's interior. ( Memento of the original from June 23, 2010 in the Internet Archive ) Info: The archive link was inserted automatically and has not yet been checked. Please check the original and archive link according to the instructions and then remove this notice. March 20, 2008, accessed November 12, 2010.
- ^ The Science and Technology Facilities Council: Cassini Sees Collisions of Moonlets on Saturn's Ring. ( Memento of the original from June 14, 2010 in the Internet Archive ) Info: The archive link was inserted automatically and has not yet been checked. Please check the original and archive link according to the instructions and then remove this notice. June 6, 2008, accessed November 12, 2010.
- ↑ JPL: Cassini Spacecraft Finds Ocean May Exist Beneath Titan's Crust. ( Memento of the original from June 23, 2010 in the Internet Archive ) Info: The archive link was inserted automatically and has not yet been checked. Please check the original and archive link according to the instructions and then remove this notice. July 30, 2008, accessed November 12, 2010.
- ↑ JPL: Giant Cyclones at Saturn's Poles Create a Swirl of Mystery. ( Memento of the original from June 24, 2010 in the Internet Archive ) Info: The archive link was inserted automatically and has not yet been checked. Please check the original and archive link according to the instructions and then remove this notice. October 13, 2008, accessed November 12, 2010.
- ↑ JPL: Cassini Finds Mysterious New Aurora on Saturn. November 12, 2008, accessed April 11, 2018.
- ↑ JPL: Saturn's Dynamic Moon Enceladus Shows More Signs of Activity. ( Memento of the original from June 20, 2010 in the Internet Archive ) Info: The archive link was inserted automatically and has not yet been checked. Please check the original and archive link according to the instructions and then remove this notice. December 15, 2008, accessed November 12, 2010.
- ↑ JPL: Cassini Finds Hydrocarbon Rains May Fill Titan Lakes. January 29, 2009. Retrieved April 11, 2018.
- ↑ JPL: Salt Finding From NASA's Cassini Hints at Ocean Within Saturn Moon. ( Memento of the original from September 12, 2015 in the Internet Archive ) Info: The archive link was inserted automatically and has not yet been checked. Please check the original and archive link according to the instructions and then remove this notice. June 24, 2009, accessed December 11, 2010.
- ↑ JPL: Saturnian Moon Shows Evidence of Ammonia. ( Memento of the original from June 2, 2010 in the Internet Archive ) Info: The archive link was inserted automatically and has not yet been checked. Please check the original and archive link according to the instructions and then remove this notice. July 22, 2009, accessed December 11, 2010.
- ↑ Raumfahrer.net: CASSINI - switch to redundant drive. February 3, 2010, accessed December 13, 2010.
- ↑ JPL: Cassini Reveals New Ring Quirks, Shadows During Saturn Equinox. ( Memento of the original from June 2, 2010 in the Internet Archive ) Info: The archive link was inserted automatically and has not yet been checked. Please check the original and archive link according to the instructions and then remove this notice. September 21, 2009, accessed December 11, 2010.
- ↑ JPL: Modulation Periods of Saturn Kilometeric Radiation in the Northern and Southern Hemispheres of Saturn. ( Memento of the original from December 3, 2010 in the Internet Archive ) Info: The archive link was inserted automatically and has not yet been checked. Please check the original and archive link according to the instructions and then remove this notice. End of 2009, accessed December 11, 2010.
- ↑ JPL: Thunderstorms on Saturn and Carbon Soot. ( Memento of the original from December 3, 2010 in the Internet Archive ) Info: The archive link was inserted automatically and has not yet been checked. Please check the original and archive link according to the instructions and then remove this notice. 2009, accessed December 11, 2010.
- ↑ JPL: 1980s Video Icon Glows on Saturn Moon. ( Memento of the original from April 2, 2010 in the Internet Archive ) Info: The archive link was inserted automatically and has not yet been checked. Please check the original and archive link according to the instructions and then remove this notice. March 29, 2010, accessed December 19, 2010.
- ↑ JPL: Cassini Data Show Ice and Rock Mixture Inside Titan. ( Memento of the original from March 14, 2010 in the Internet Archive ) Info: The archive link was inserted automatically and has not yet been checked. Please check the original and archive link according to the instructions and then remove this notice. March 11, 2010, accessed December 18, 2010.
- ↑ JPL: Flash: NASA's Cassini Sees Lightning on Saturn. ( Memento of the original from September 12, 2015 in the Internet Archive ) Info: The archive link was inserted automatically and has not yet been checked. Please check the original and archive link according to the instructions and then remove this notice. April 14, 2010, accessed December 18, 2010.
- ↑ JPL: Status Report: Engineers Assessing Cassini Spacecraft. ( Memento of the original from December 11, 2010 in the Internet Archive ) Info: The archive link was automatically inserted and not yet checked. Please check the original and archive link according to the instructions and then remove this notice. November 4, 2010, accessed December 11, 2010.
- ↑ JPL: Status Update: Cassini to Resume Nominal Operations. November 9, 2010, accessed April 11, 2018.
- ↑ JPL: Status Report: Cassini Back to Normal, Ready for Enceladus. November 23, 2010, accessed April 11, 2018.
- ↑ JPL: Cassini-Huygens Solstice Mission. (PDF; 149 kB), accessed on February 13, 2011.
- ↑ JPL: Cassini Spots Potential Ice Volcano on Saturn Moon. December 14, 2010, accessed December 18, 2010.
- ↑ JPL: Hot Plasma Explosions Inflate Saturn's Magnetic Field. December 14, 2010, accessed December 18, 2010.
- ↑ JPL: Cassini Chronicles the Life and Times of Saturn's Giant Storm. ( Memento of the original from September 6, 2015 in the Internet Archive ) Info: The archive link was inserted automatically and has not yet been checked. Please check the original and archive link according to the instructions and then remove this notice. November 17, 2011, accessed May 7, 2012.
- ↑ JPL: Cassini and Telescope See Violent Saturn Storm. May 19, 2011, accessed April 11, 2018.
- ↑ JPL: Cassini Sees Seasonal Rains Transform Titan's Surface. March 17, 2011, accessed May 7, 2012.
- ↑ JPL: Cassini Captures Ocean-like Spray at Saturn Moon. ( Memento of the original from March 17, 2012 in the Internet Archive ) Info: The archive link was inserted automatically and has not yet been checked. Please check the original and archive link according to the instructions and then remove this notice. June 22, 2011, Retrieved May 7, 2012
- ↑ JPL: Forensic Sleuthing Ties Ring Ripples to Impacts. ( Memento of the original from August 25, 2012 in the Internet Archive ) Info: The archive link was inserted automatically and has not yet been checked. Please check the original and archive link according to the instructions and then remove this notice. March 31, 2011, accessed May 15, 2012.
- ↑ JPL: Cassini Sees Saturn Electric Link with Enceladus. April 20, 2011, accessed May 15, 2012.
- ↑ JPL: Cassini Detects Hint of Fresh Air at Dione. ( Memento of the original from October 11, 2013 in the Internet Archive ) Info: The archive link was inserted automatically and has not yet been checked. Please check the original and archive link according to the instructions and then remove this notice. March 2, 2012, accessed August 18, 2013.
- ↑ JPL: Enceladus Plume is a new Kind of Plasma Laboratory. ( Memento of the original from March 12, 2013 in the Internet Archive ) Info: The archive link was inserted automatically and has not yet been checked. Please check the original and archive link according to the instructions and then remove this notice. March 31, 2012, accessed August 18, 2013.
- ↑ JPL: Cassini Finds Likely Subsurface Ocean on Saturn Moon. ( Memento of the original from July 24, 2013 in the Internet Archive ) Info: The archive link was inserted automatically and has not yet been checked. Please check the original and archive link according to the instructions and then remove this notice. June 28, 2012, accessed August 18, 2013.
- ↑ JPL: The Titanian Seasons Turn, Turn, Turn. ( Memento of the original from October 29, 2013 in the Internet Archive ) Info: The archive link was inserted automatically and has not yet been checked. Please check the original and archive link according to the instructions and then remove this notice. July 10, 2012, accessed August 18, 2013.
- ↑ JPL: NASA's Cassini Sees Burp at Saturn After Large Storm. ( Memento of the original from January 7, 2014 in the Internet Archive ) Info: The archive link was inserted automatically and has not yet been checked. Please check the original and archive link according to the instructions and then remove this notice. October 25, 2012, accessed August 18, 2013.
- ↑ JPL: Cassini Finds a Video Gamers' Paradise at Saturn. ( Memento of the original from November 29, 2012 in the Internet Archive ) Info: The archive link was automatically inserted and not yet checked. Please check the original and archive link according to the instructions and then remove this notice. November 26, 2012, accessed August 18, 2013.
- ↑ JPL: NASA Releases Images of Earth Taken by Distant Spacecraft. ( Memento of the original from September 4, 2014 in the Internet Archive ) Info: The archive link was inserted automatically and has not yet been checked. Please check the original and archive link according to the instructions and then remove this notice. July 22, 2013. Retrieved September 29, 2014.
- ↑ JPL: NASA's Cassini Spacecraft Reveals Forces Controlling Saturn Moon Jets. ( Memento of the original from October 24, 2014 in the Internet Archive ) Info: The archive link was automatically inserted and not yet checked. Please check the original and archive link according to the instructions and then remove this notice. July 31, 2013, accessed September 29, 2014.
- ↑ JPL: J NASA’s Cassini Spacecraft Finds Ingredient of Household Plastic in Space. ( Memento of the original from August 20, 2014 in the Internet Archive ) Info: The archive link was inserted automatically and has not yet been checked. Please check the original and archive link according to the instructions and then remove this notice. September 30, 2013, accessed September 29, 2014.
- ↑ JPL: Cassini Gets New Views of Titan's Land of Lakes. ( Memento of the original from September 18, 2014 in the Internet Archive ) Info: The archive link was inserted automatically and has not yet been checked. Please check the original and archive link according to the instructions and then remove this notice. October 23, 2013, accessed September 29, 2014.
- ↑ JPL: NASA Space Assets Detect Ocean inside Saturn Moon. ( Memento of the original from April 10, 2016 in the Internet Archive ) Info: The archive link was inserted automatically and has not yet been checked. Please check the original and archive link according to the instructions and then remove this notice. April 3, 2014, accessed April 15, 2016.
- ↑ JPL: Titan's Building Blocks Might Pre-date Saturn. ( Memento of the original from April 15, 2016 in the Internet Archive ) Info: The archive link was inserted automatically and has not yet been checked. Please check the original and archive link according to the instructions and then remove this notice. June 23, 2014, accessed April 15, 2016.
- ↑ JPL: Ocean on Saturn Moon Could be as Salty as the Dead Sea. ( Memento of the original from April 15, 2016 in the Internet Archive ) Info: The archive link was inserted automatically and has not yet been checked. Please check the original and archive link according to the instructions and then remove this notice. July 2, 2014, accessed April 15, 2016.
- ↑ JPL: Swirling Cloud at Titan's Pole is Cold and Toxic. ( Memento of the original from April 15, 2016 in the Internet Archive ) Info: The archive link was inserted automatically and has not yet been checked. Please check the original and archive link according to the instructions and then remove this notice. October 1, 2014, accessed April 15, 2016.
- ↑ JPL: Saturn Moon May Hide a 'Fossil' Core or an Ocean. October 16, 2014, accessed April 11, 2018.
- ↑ JPL: Signs of Europa Plumes Remain Elusive in Search of Cassini Data. ( Memento of the original from April 15, 2016 in the Internet Archive ) Info: The archive link was inserted automatically and has not yet been checked. Please check the original and archive link according to the instructions and then remove this notice. December 18, 2014, accessed April 15, 2016.
- ↑ JPL: Spacecraft Data Suggest Saturn Moon's Ocean May Harbor Hydrothermal Activity. March 11, 2015, accessed June 5, 2016.
- ↑ JPL: NASA-funded Study Explains Saturn's Epic Tantrums. April 13, 2015, accessed June 5, 2016.
- ↑ JPL: The Mysterious 'Lakes' on Saturn's Moon Titan. June 19, 2015, accessed June 5, 2016.
- ↑ JPL: J NASA Missions Have Their Eyes Peeled on Pluto. July 9, 2015, accessed May 20, 2016.
- ↑ JPL: At Saturn, One of These Rings is not like the Others. September 2, 2015, accessed May 20, 2016.
- ↑ JPL: Cassini Finds Global Ocean in Saturn's Moon Enceladus. September 15, 2015, accessed May 20, 2016.
- ↑ JPL: Enceladus Jets: Surprises in Starlight. May 5, 2016. Retrieved August 29, 2017.
- ^ Cassini Explores a Methane Sea on Titan. April 26, 2016, accessed March 10, 2017.
- ↑ JPL: Cassini Spies Titan's Tallest Peaks. March 24, 2016. Retrieved April 27, 2017.
- ^ JPL: Returning to the Realm of Icy Moons. March 30, 2016. Retrieved April 27, 2017.
- ↑ JPL: F Ring Orbits. November 30, 2016. Retrieved April 27, 2017.
- ↑ JPL: Cassini Finds Flooded Canyons on Titan. August 9, 2016. Retrieved August 29, 2017.
- ↑ JPL: Cassini Beams Back First Images from New Orbit. December 9, 2016. Retrieved August 29, 2017.
- ^ Energy for life. April 13, 2017. Retrieved April 27, 2017.
- ^ The Grand Finale. Retrieved April 27, 2017.
- ^ First Ring Dive. April 26, 2017. Retrieved September 5, 2017.
- ↑ Solstice Arrvies at Saturn. May 24, 2017. Retrieved September 5, 2017.
- ^ Cassini: Mission to Saturn: Overview . In: Cassini: Mission to Saturn . ( nasa.gov [accessed April 27, 2017]).
- ↑ NASA Saturn Mission Prepares for 'Ring-Grazing Orbits' . In: Cassini: Mission to Saturn . ( nasa.gov [accessed April 27, 2017]).
- ↑ Ring-Grazing Orbits . In: Cassini: Mission to Saturn . ( nasa.gov [accessed April 27, 2017]).
- ↑ Cassini Completes Final - and Fateful - Titan Flyby . In: Cassini: Mission to Saturn . ( nasa.gov [accessed April 27, 2017]).
- ^ NASA Spacecraft Dives Between Saturn and Its Rings . In: Cassini: Mission to Saturn . ( nasa.gov [accessed April 27, 2017]).
- ^ Catching Cassini's Call . In: Cassini: Mission to Saturn . ( nasa.gov [accessed April 27, 2017]).
- ^ ESA: Catching Cassini's call . In: European Space Agency . ( esa.int [accessed August 29, 2017]).

Missions launched: Pioneer 10 (1972–2003) | Pioneer 11 (1973-1995) | Voyager 1 (1977-) | Voyager 2 (1977-) | Galileo (1989-2003) | Ulysses (1990-2009) | Cassini-Huygens (1997-2017) | New Horizons (2006–) | Juno (2011–)
Scheduled Missions: Lucy (2021) | JUICE (2022) | Europa Clipper (2023-2025) | Dragonfly (2026) | Exploration of the heliopause (from 2024)

COS-B (1975) • GEOS 1 and 2 (1977, 1978) • OTS-1 and -2 (1977, 1978) • ISEE 2 (1977) • Meteosat (1977-1997) • IUE (1978) • Marecs A and B (1981, 1984) • Exosat (1983) • ECS (1983-1988) • Giotto (1985) • Olympus (1989) • Hipparcos (1989) • Hubble (1990) • Ulysses (1990-2009) • ERS 1 and 2 (1991, 1995) EURECA (1992) ISO (1995) SOHO (1995) Huygens (1997) XMM-Newton (1999) Cluster (2000) Artemis (2001) Proba-1 (2001) Envisat (2002) MSG-1, -2, -3, -4 (2002, 2005, 2012, 2015) Integral (2002) Mars Express (2003) Smart-1 (2003) Double Star (2003) · Rosetta (2004) · CryoSat (2005) · SSETI Express (2005) · Venus Express (2005) · Galileo (2005– 2020 ) · MetOp-A, -B and -C (2006, 2012, 2018) · Corot (2006 ) GOCE (2009) Herschel (2009) Planck (2009) Proba-2 (2009) SMOS (2009) CryoSat-2 (2010) HYLAS (2010) Alphasat I-XL (2013) Swarm (2013) Gaia (2013) Proba V (2013) Sentinel 1A / 1B (2014, 2016) Sentinel 2A / 2B (2015, 2017) LISA Pathfinder (2015) Sentinel 3A / 3B (2016, 2018) ExoMars Trace Gas Orbiter (2016) Schiaparelli (2016) Sentinel-5P (2017) ADM-Aeolus (2018) BepiColombo (2018) Cheops (2019) Solar Orbiter ( 2020)
Planned starts: JWST (2021) · MTG-I1 to -I4, -S1, -S2 (2021-2032) · Biomass (2022) · EarthCARE (2022) · Euclid (2022) · ExoMars Rover (2022) · Juice (2022 ) MetOp-SG (2022) Altius (2023) Hera (2023) Smile (2023) Flex (2024) Forum (2026) Plato (2026) Ariel (2028) Comet Interceptor (2028)