
Renewable energy


As renewable energy (also very important: Renewable energy ) or renewable energies are energy sources which have in the human time horizon for sustainable energy supply are practically inexhaustible available or renew relatively quickly. This sets them apart from fossil energy sources that are finite or only regenerate over a period of millions of years. Renewable energy sources are, in addition to the efficient use of energy, as the most important pillar of a sustainable energy policy ( English sustainable energy ) and the energy revolution . These include bioenergy ( biomass potential ), geothermal energy , hydropower , ocean energy , solar energy and wind energy . By far the most important source of energy is the sun .
The term “renewable energies” is not to be understood in the sense of physics , because according to the law of conservation of energy, energy can neither be destroyed nor created, but only converted into different forms. Secondary energy sources obtained from renewable energies (electricity, heat, fuel) are often imprecisely referred to as renewable energies. The term renewable heat is also used as a term for thermal energy obtained from geothermal, solar thermal or bioenergy and for the indirect use of solar energy through solar architecture . Electricity from renewable energy sources is also known as green electricity and green electricity .
In 2017, renewable energies covered 18.1% of global final energy consumption . Traditional biomass, used for cooking and heating in developing countries, had the largest share at 7.5%, modern biomass and solar and geothermal energy (4.2%), followed by hydropower (3.6%), other modern renewable energies as above all wind power and photovoltaics (together 2%) and biofuels (1%). The expansion of renewable energies is being promoted in many countries around the world. The share of global final energy consumption is increasing only slowly and growth averaged 0.8% per year from 2006 to 2016.
In the electricity sector , the share in 2018 was 26.2% worldwide, with hydropower clearly having the largest share at 15.8%. The share of renewable energies in the consumption of primary energy , in which renewable energies tend to be underrepresented due to the calculation method used, was 13.7% in 2016. In at least 144 countries worldwide there are expansion targets for renewable energies, in 138 countries there are support measures for their dissemination, including 95 developing and emerging countries. The People's Republic of China has set itself particularly ambitious goals , where the share of renewable energies is to be increased by 50% from 2013 to 2017. At the same time, investments in renewable energies in 2013 exceeded investments in conventional power plants for the first time. The share of renewable energies in China fell continuously from 1999 (20.2%) to 2011 (7.5%). The proportion there has been increasing again since 2011 and was 9% in 2016.
Renewable energy sources


The basis for the renewable energies are the three energy sources nuclear fusion of the sun , tidal force due to the planetary movement and geothermal energy from the earth's interior. By far the most productive form is solar energy, the annual energy supply on earth is 3,900,000,000 PJ ( Petajoule ). Geothermal energy provides 996,000 PJ while gravity provides 94,000 PJ.
Solar energy (radiation energy)
The sun emits large amounts of energy that reach the earth as solar radiation ( electromagnetic wave ). The power radiated from the sun to the earth is approximately 174 PW ( Petawatt ). About 30% of the radiation is reflected, so that about 122 PW reach the earth (earth's shell and surface). That's about 1,070 EWH (Exawattstunden) in the year and currently about the 7,500 times the world's annual energy needs .
Solar energy can be used directly or indirectly in a variety of ways. The direct use takes place with photovoltaic systems as well as solar heat . In addition, the solar energy absorbed by the atmosphere and the earth's surface "supplies" mechanical, kinetic and potential energy . Potential energy arises when water is transported to higher altitudes through atmospheric processes. The solar energy also generates winds in the atmosphere through meteorological processes. These winds (= moving air masses) contain kinetic energy ( wind energy ); they generate waves ( wave energy ) on the seas . Plants absorb the radiation in the course of photosynthesis and fix it in biomass , which can be used for energy conversion. The use of ambient heat by means of heat pumps with near-surface geothermal collectors or air-to-air heat pumps also counts as solar energy.
In principle, in addition to direct use, the sun's energy can also be used indirectly in the form of bioenergy, wind energy and hydropower. Possible forms of use are:
- solar power
-
Bioenergy (from biomass in various forms, see article biogenic fuel and biofuel )
- Wood
- Vegetable oil
- Biodiesel
- Bioethanol and cellulosic ethanol
- Biogas
- BtL fuels
- Biohydrogen
- Muscular strength ( walking , cycling , hand trolley , Göpel , treadmill , draft animals )
-
Hydropower
- Dams and dams
- Run-of-river power stations , water mills , power buoys
- Wave energy of the sea
- Current energy of the sea
- Ocean heat
- Osmosis power plant (different salt content of fresh and salt water)
- Gnepfe ( hammer mills )
- Bucket wheels , water art , hydraulic ram
- Wind energy
Geothermal energy (geothermal energy)

The heat stored in the earth's interior comes on the one hand from residual heat from the time the earth was formed . On the other hand, nuclear decay processes of primordial radionuclides and the friction between the solid earth's crust and the liquid earth's core caused by tidal forces continuously generate additional heat. It can be used for heating purposes (especially near-surface geothermal energy ) or to generate electricity (mostly deep geothermal energy ) .
In Germany, Austria and Switzerland there are mainly low-enthalpy deposits . In these deposits, however, the heat from the deeper layers does not flow to the same extent as it is extracted by a geothermal system, so that the area of the extraction point cools and extraction is only possible over a limited period of a few decades, after which a regeneration of the heat reservoir is necessary. Systems close to the surface can, however, be filled with thermal energy from cooling processes in summer by reversing the direction of transport of the energy. Geothermal projects require careful exploration and analysis of the geological conditions, as interventions in the layer structure can have serious consequences.
Interaction of the earth with the sun and moon
The attraction ( gravity ) of the sun and moon (and other celestial bodies) causes the tides in and on the rotating earth , whereby the rotational speed of the earth is gradually slowed down by this energy conversion. The currents induced by this can be used as mechanical energy in tidal power plants and ocean current power plants. These forces of attraction also lead to deformations of the earth's body and thus to friction in the solid earth and in the liquid core of the earth , which adds further heat to the earth's interior. The frictional power is around 2.5 TW ( terawatts ), the economically usable potential is estimated at around 9% of this power. In this context, mechanical energy also arises through interaction with the weather , the energy of which is used indirectly by hydro and wind power plants.
Potentials
Global potential

The solar energy radiated onto the earth corresponds to more than ten thousand times the current human energy requirement . Geothermal energy and tidal power make significantly smaller but high contributions compared to human needs. From a purely physical point of view, this means that there is a multiple of the energy available that will be needed in the foreseeable future, even if the theoretical potential mentioned here may be less. a. reduced by technical and ecological concerns. The necessary technologies and the concepts for realizing a sustainable energy supply are also considered to be available.
The International Energy Agency (IEA) assumes that one fifth of primary energy consumption worldwide and one third of electricity will be covered by renewable energies by 2040. According to the IPCC , under optimistic assumptions, 77% of global energy consumption could come from renewable energies by 2050.
Scientists at Stanford and Davis Universities have calculated in a plan for an emission-free world by 2030 that the global switch to wind, water and solar energy would cost around 100,000 billion US dollars, with geothermal and tidal power plants under hydropower and wave power plants under wind energy are listed. This calculation includes costs for storage power plants and measures for intelligent electricity consumption , but not the infrastructure for distributing the electricity. The costs of sticking to fossil-nuclear energies would be significantly higher, as calculations by the Energy Watch Group have shown. According to this, between 5500 and 7750 billion dollars were spent worldwide on fossil and nuclear energies in 2008; a 20% increase in energy prices would push spending to nearly $ 10,000 billion a year.
Potential in Germany
Every year, around a hundred times the German primary energy consumption is radiated into Germany by means of sunlight . In addition, the potential of geothermal energy and wind energy must be calculated, with wind energy on land alone having a usable potential of around 2400 TWh / a (terawatt hour per year), around four times that of German electricity generation. In principle, Germany's complete, self-sufficient supply of renewable energies with domestic sources is possible, even if most 100% scenarios provide for an import from neighboring countries, as this increases the security of supply and reduces the necessary storage requirements as a result of compensatory effects.
In 2008, the Federal Ministry for the Environment, Nature Conservation, Building and Nuclear Safety (BMUB) assumed in its lead study that renewable energies in Germany would account for 30% of the electricity supply by 2020. This should completely replace the loss of nuclear energy capacities originally planned up to this point in time (nuclear phase-out) . In 2012, a significantly stronger expansion was assumed. According to the industry forecast of the renewable energy industry, renewable energies in Germany could already cover almost half of the total German electricity demand in 2020 with 48%. According to the decision of the black and red federal government in 2014, the share of green electricity should be increased to 40–45% by 2020 and to 55 to 60% by 2035. In 2016, 29.2% of electricity consumption in Germany was covered by renewable energy sources. The targets from 2017 are to provide 40–45% of the energy demand from renewable energies by 2025 and to shut down the last nuclear power plants by 2022.
According to the potential atlas presented by the Renewable Energy Agency in January 2010, the technical potential in Germany for the use of regenerative energies is still largely untapped. The potential atlas calculates the land consumption from today to 2020 that will be required for renewable energies in their further expansion. According to this, for example, onshore wind energy could cover a fifth of Germany's electricity demand by 2020. For this they need about 0.75% of the country's area. Bioenergy will therefore make up 15% of the total electricity, heat and fuel supply in 2020, for which an area of 3.7 million hectares (today: 1.6 million hectares) is necessary. A competition with food production (land use competition) is not to be feared because of the EU-wide grain surpluses. The potential of solar energy is also still largely untapped. So far, only 2.5% of the suitable building areas have been used for electricity or heat from the sun.
In 2010, an expert opinion by the German Advisory Council on the Environment came to the conclusion that Germany could cover its electricity supply entirely from renewable energies in 2050. According to Olav Hohmeyer , main author of the report, a full supply of electricity from renewable energies will be possible as early as 2030 if the conventional power plants are switched off early and the network and storage infrastructure are adapted. The study contains a number of scenarios according to which even a purely national full supply with renewable energies is possible. However, it is easier and cheaper to exchange electricity with neighboring countries and regions. For example, Norway can temporarily absorb surplus electricity from wind energy and then provide electricity from hydropower when there is little wind in Germany.
The Fraunhofer Institute for Solar Energy Systems (ISE) also came to the conclusion that the German energy supply (electricity and heat sector) with a full supply of renewable energies is technically possible by 2050 and does not have a financial impact. For this to be successful, however, a few more steps would have to be set, especially in the heating sector. The heating requirement for buildings must be reduced to around 50 percent of the value from 2010 through energetic building renovation.
Expansion of renewable energies
Worldwide location
| Area [unit] | 2003 | 2013 | 2017 |
|---|---|---|---|
| Electricity sector [ GW ] | |||
| Hydropower | 715 | 1,000 | 1114 |
| EEs total without hydropower | 85 | 560 | 1081 |
| of which bioenergy | <36 | 88 | 122 |
| Geothermal power plants | 8.9 | 12 | 12.8 |
| Photovoltaics | 2.6 | 139 | 402 |
| Solar thermal power plants | 0.4 | 3.4 | 4.9 |
| Wind energy | 48 | 318 | 539 |
| Heating sector [GW th ] | |||
| Solar thermal (hot water) | 98 | 326 | 472 |
| Transport sector [million m³ / a] | |||
| Bioethanol | 28.5 | 87.2 | 106 |
| Biodiesel | 2.4 | 26.3 | 31 |

In many countries there is currently a strong expansion of renewable energies. In addition to the classic areas of hydropower and bioenergy , this particularly affects the areas of wind energy and solar energy, which were still insignificant in the 20th century .
The two institutions IEA and IRENA hold a prominent position in international reporting on the role and potential of renewable energies . While the founding of the IEA in 1973 was a reaction to the oil crisis, the founding conference of IRENA did not take place in Bonn until the beginning of 2009, although its history begins with the Brandt report published in 1980 . In addition to these publications, the government forum REN21 regularly publishes status reports on the global expansion of renewable energies. The annual “Global Status Report” is considered a standard work for the renewable energy sector.
According to this report, at the beginning of 2014 at least 138 countries had political targets for the expansion of renewable energies or similar regulations, 95 of which were emerging or developing countries . In 2005 there were 55 states. While wind energy is currently used in at least 83 countries around the world, photovoltaic systems are installed in over 100 countries. Certain renewable energies have been competitive in some regions since 2012 at the latest and can produce electricity there more cheaply than fossil-fuel systems.
Overall, the share of renewable energies in the global final energy demand in 2012 was 19%. Traditional biomass use accounted for almost half of this, 9% , while modern renewable energies provided 10%. 78.4% of the final energy was covered by fossil fuels, another 2.6% came from nuclear energy .
In the electricity sector , the share of renewable energies worldwide is estimated at 22.1% in 2013, while 77.9% of electrical energy was produced by fossil fuels and nuclear energy. The most important regenerative energy source was therefore hydropower, which covered 16.4% of the world's electricity demand. Wind energy provided 2.9% of the electricity, biomass 1.8% and photovoltaics 0.7%, other renewables achieved 0.4%. In absolute numbers, renewable electricity generation was around 5,070 TWh .
Overall, the installed capacity of renewable energies at the end of 2013 was around 1,550 gigawatts, eight percent more than in the previous year. In 2004 it was 800 GW. While the output of hydropower plants increased from 715 GW to 1000 GW in the period mentioned, the output of other renewable energies rose from 85 to 560 GW, with wind energy having the largest share of this increase with an installed capacity of 318 GW. Photovoltaics also grew very strongly, increasing from 2.6 to 139 GW. Biomass rose from below 36 GW to 88 GW, while geothermal and solar thermal power plants remained comparatively insignificant with 12 and 3.4 GW respectively.
In 2013, too, the expansion of regenerative power plant capacity was mainly limited to hydropower, wind energy and photovoltaics. One third of the expansion was due to hydropower (40 GW), another third to photovoltaics (39 GW), which for the first time recorded a higher capacity increase than wind power (35 GW). The countries with the highest installed power generation capacities are China, the United States, Brazil, Canada, and Germany. For the first time in 2013, the newly installed capacity of renewable energy systems in China exceeded that of nuclear power plants and fossil-fuel power plants. In 2013, the newly installed capacity of renewables in the EU again exceeded that of conventional power plants.
The electricity production costs of renewable energies such as onshore wind power and in particular photovoltaics have fallen sharply in the last two decades (see below). Since 2009, the cost of wind power has fallen by around a third and that of photovoltaics by 80%. In the meantime, wind turbines and solar projects can be implemented in various countries under favorable conditions without financial aid. As a result, the number of investments in renewable energies increased significantly. The prices for renewable energies have fallen faster and more sharply than expected in recent years, especially for photovoltaics. Renewable energies accounted for 56 percent of the new global electricity generation capacity in 2013. Around half of the investments came from emerging and developing countries. In 2014, for the first time, China built more capacity in the renewable energy sector than in the coal sector. In India, wind power capacities have increased tenfold in the past ten years, driven by sharply lower costs.
Investments in renewable energies have been increasing at an increasing pace for years. In 2015, US $ 329.3 billion was invested in renewable energies worldwide. In spite of lower oil and gas prices and also lower costs for renewable energies, investments increased by 4% compared to the previous year. In addition, 30 percent more wind and solar power was installed than in 2014. 65% of all global investments in the energy industry went into renewable energies. Only in Europe did investments last collapse again in 2015. Global new investments in renewable energies already exceeded investments in the conventional sector in 2014. In the electricity sector alone, twice as much was invested in solar, wind and hydropower last year (around US $ 265 billion) as in new coal and gas-fired power plants combined (around US $ 130 billion). At the same time, with 7.7 million jobs, they contributed more to global employment than conventional energies. Germany was in 5th place in terms of investments (2014). China and Japan invested mainly in solar systems, Europe in offshore wind parks . In 2013, a total of 1.6 trillion dollars was invested in the energy sector worldwide, of which more than 1 trillion was for fossil fuels and power plants and 250 billion for renewable energies. Over the entire period 2000-2013, around 57% of investments worldwide were made in the renewable energy sector, while 40% went to fossil-fuel power plants and 3% to nuclear power plants. According to the Allianz Climate & Energy Monitor 2016 , the G20 countries need investments of around 710 billion US dollars annually until 2035 in order to meet the UN climate goals set in Paris . The most attractive countries for investors are Germany, Great Britain, France and China.
Around 147 gigawatts (GW) of renewable energies were newly installed in 2015 - the largest increase within a year to date - and cover a total of 19 percent of the world's energy demand. The largest increases in capacity were recorded for wind energy (63 GW), photovoltaics (50 GW) and hydropower (28 GW).
Global government subsidies for renewable energy in 2012 were around $ 100 billion. For comparison: In the same period, fossil fuels were promoted directly with 544 billion dollars and indirectly with the non-pricing of environmental and health damage, according to the International Energy Agency (IEA).
The following graphic provides an overview of the top 10 investors in renewable energies worldwide:
Investments in Renewable Energy by State :

Note: Rest of the EU-27 includes Belgium, Bulgaria, Denmark, Estonia, Finland, France, Greece, Ireland, Latvia, Lithuania, Luxembourg, Malta, the Netherlands, Austria, Poland, Portugal, Romania, Sweden, Slovakia, Slovenia, Spain , the Czech Republic, Hungary and Cyprus.
The study " Energy [r] evolution " by Greenpeace International, the Global Wind Energy Council (GWEC) and SolarPower Europe, which was developed together with the German Aerospace Center (DLR), assumes that it is technically possible and is financially attractive and can create millions of new jobs to convert the global energy supply completely to renewables by 2050. The modeling study published in April 2019 by the Energy Watch Group and the group led by Christian Breyer at the Technical University of Lappeenranta outlines a 1.5 ° C scenario with a cost-effective, cross-sectoral, global 100% renewable energy system based on a high variety of technologies, which without negative CO 2 emission technologies. The areas of electricity, heat, transport and seawater desalination up to 2050 are considered.
Renewable energies are growing in many developing countries. In Sierra Leone, for example, around a quarter of the electricity generated will come from renewable energies by the end of 2016. West Africa's largest solar park with a capacity of 6 MW is to be built near the capital Freetown . Solar energy also plays an increasingly important role in street lighting, for example in Koindu , in a state with decades of undersupply.
Situation in the European Union


| country | 2004 | 2018 | 2020 EU target |
|---|---|---|---|
|
|
8.5 | 18.0 | 20th |
|
|
1.9 | 9.4 | 13 |
|
|
20.5 | 16 | |
|
|
14.5 | 36.1 | 30th |
|
|
5.8 | 16.5 | 18th |
|
|
18.4 | 30.0 | 25th |
|
|
29.2 | 41.2 | 38 |
|
|
9.4 | 16.6 | 23 |
|
|
6.9 | 18.0 | 18th |
|
|
2.4 | 11.1 | 16 |
|
|
6.3 | 17.8 | 17th |
|
|
23.5 | 28.0 | 20th |
|
|
32.8 | 40.3 | 40 |
|
|
17.2 | 24.4 | 23 |
|
|
0.9 | 9.1 | 11 |
|
|
0.1 | 8.0 | 10 |
|
|
2.1 | 7.4 | 14th |
|
|
23.3 | 33.4 | 34 |
|
|
6.9 | 11.3 | 15th |
|
|
19.2 | 30.3 | 31 |
|
|
17.0 | 23.9 | 24 |
|
|
38.7 | 54.6 | 49 |
|
|
6.4 | 11.9 | 14th |
|
|
16.1 | 21.1 | 25th |
|
|
8.3 | 17.4 | 20th |
|
|
5.9 | 15.2 | 13 |
|
|
4.4 | 12.5 | 13 |
|
|
1.2 | 11.0 | 15th |
|
|
3.1 | 13.9 | 13 |
In 2013, the share of renewable energies in gross final energy consumption in the EU-28 countries was 15.0%. Since 2004, the first year for which Europe-wide data are available, the proportion has been increasing in all EU countries. The highest share was achieved in Sweden with 52% , followed by Latvia (37.1%), Finland (36.8%) and Austria (32.6%). Sweden, Denmark , Austria, Bulgaria and Italy showed the greatest growth . In the period from 1999 to 2009, the share of renewable energies in gross domestic energy consumption in the EU-27 countries had already risen from 5% to 9.0%. On March 9, 2007, the European Union made a binding commitment to reduce greenhouse gas emissions by a fifth compared to 1990 levels by 2020 and to increase the share of renewable energies to an average of 20% by 2020. In January 2008 the European Commission passed binding requirements for the individual member states. The Directive 2009/28 / EC (the successor of the Directive 2001/77 / EC ) requires Member States to set national indicative targets for the share of renewable energies in electricity consumption, with the countries of the conveyor systems individually expressly free hand is left with respect. The national target value by 2020 according to EU Directive 2009/28 / EC is therefore 18% for Germany and 34% for Austria of the final energy consumption through renewable energies.
In January 2014, the EU Commission set a target of 27 percent for the share of renewable energies in gross final energy consumption in the EU in 2030. According to forecasts by the oil company BP , renewable energies will increase by 136% between 2013 and 2035, making them the fastest growing energy source in Europe (followed by natural gas with an increase of 15%).
Across Europe, electricity production from renewable energies now exceeds both electricity production from nuclear energy and electricity generation from coal (as of 2017).
Forecasts
Looking back, the prognoses and scenarios made over the last few decades have systematically underestimated the potential of renewable energies, often very severely. In addition to critics of the energy transition, supporters often underestimated the growth of renewable energies.
The forecasts of the European Union (EU) and the International Energy Agency (IEA) deviate particularly strongly from the actual development. The values assumed for 2020 in the EU's “Primes” study presented in 1994 were already significantly exceeded in 2008. In its World Energy Outlook 2002, the IEA expected an increase in wind energy production capacities to 100 GW in 2020. In 2008, a few years after the forecast was published, the actual installed capacity exceeded this value by more than 20% and at the end of 2014 was already 369 GW. A study published in 2015 by the Energy Watch Group and the Lappeenranta University of Technology found that the IEA regularly underestimated the growth of photovoltaics and wind energy between 1994 and 2014. The projections for photovoltaics given by the IEA in 2010 for 2024 were therefore already achieved in January 2015 (180 GW), which exceeds the IEA forecast for 2015 by a factor of three. Similarly, the IEA has regularly overestimated the importance of coal, oil and nuclear power. Despite a decline in nuclear power, the IEA continues to expect annual growth of around 10 GW in the coming decade.
The greatest differences between the prognosis and the reality of the expansion of renewable energies in Germany result from the Prognos AG studies commissioned by the Federal Ministry of Economics and Technology (BMWi) . For example, the real use of renewable energies in 2000 was almost three times as high as the forecast from 1998. The electricity production expected for 2020 was already achieved by renewable energies in 2007. According to the Prognos study from 1984, wind energy, photovoltaics, biogas, geothermal energy would have , Solar thermal and biofuels made no significant contribution to the energy supply in 2000. The values for electricity from bioenergy and photovoltaics and for heat from renewable energies predicted in the Prognos study of 2005 for 2030 were already achieved in 2007, just two years after the study was published. The forecast amount of biofuel for 2020 was also exceeded in 2007.
In Germany, the expansion target by 2020, to which Germany has committed itself to the EU, is expected to be exceeded, according to the Federal Environment Ministry. Instead of 18% of the final energy consumption, 19.6% would then be generated from renewable sources. In the electricity sector, the ministry expects renewable energies to contribute 38.6%.
Globally, the International Organization for Renewable Energies (IRENA) expects the share of renewable energies to double by 2030. The financial analyst Bloomberg New Energy Finance sees a so-called tipping point for wind and solar energy: The prices for wind and solar power are in the last Years and in January 2014 were already below the prices of conventional electricity generation in some areas or parts of the world. Prices would continue to fall. The power grids have been greatly expanded worldwide so that they can now also receive and distribute electricity from renewable energies. Renewable energies have also ensured that electricity prices have come under great pressure worldwide. Renewable energies are also enthusiastically received by consumers. This system change should already be apparent to many people in 2014.
In January 2014, Deutsche Bank forecast strong growth in photovoltaics. Grid parity has been achieved in at least 19 markets worldwide. The prices for photovoltaics would continue to fall. Business models beyond feed-in tariffs would increasingly prevail. The further growth is due to the fact that photovoltaics are becoming more and more competitive.
Change in the energy system

The change from conventional energy supply to renewable energies is changing the structure of the energy industry massively. Electricity generation in large power plants (nuclear power, lignite and hard coal power plants) stagnates or decreases; generation in systems with a few kilowatts (e.g. photovoltaics) to a few megawatts has increased. In addition, within a short period of time (since around 2012) a very influential divestment movement has emerged in the public debate , which tries to achieve the switch to climate-neutral energy sources by selling stakes in fossil energy companies and thus by fundamentally breaking the conventional energy system.
Another important aspect of the decentralized energy supply is the shortening of the transport routes or the avoidance of transports (of fuels such as heating oil, natural gas, coal). Various infrastructures such as oil and gas pipelines are either not necessary or to a lesser extent. This applies in particular to the use of biomass, which can be provided on site or locally. In addition, small power plants facilitate so-called combined heat and power (CHP), in which the generation of electricity is combined with the use of waste heat, for example for heating purposes, thus increasing overall efficiency . In large power plants, however, the waste heat is often not used. The decentralized energy supply also strengthens the regional economy by creating jobs in the installation, operation and maintenance of the systems.
A major advantage of the decentralized energy transition is that it can be implemented more quickly. Because the plants are smaller and therefore do not require any major investments, their proponents believe that a faster expansion of renewable energies is possible than with an energy transition based on large structures. At the same time, there would be more competition on the energy market from the many different players. Since major projects, on the other hand , would have to be built primarily by well-funded companies such as the established energy groups, which, due to the competitive situation with existing power plants, had no interest in a rapid expansion of renewable energies, no rapid conversion of the energy supply was to be expected from this side.
However, not every region has the potential for self-sufficiency with energy. On the other hand, in some regions the production, for example of electricity with wind turbines in northern Germany, temporarily or often outweighs the local demand, so that the electricity networks have to be expanded to the consumers.
Concepts for a completely self-sufficient energy supply are particularly criticized . Particular emphasis is placed on the security of supply through extensive networks through which oversupply and shortages in different regions can be balanced out. For example, a surplus of solar power would be supplied from the Mediterranean countries in summer, while wind power from northern and western Europe could be used in winter. Many proponents of a decentralized energy supply, such as Canzler and Knie, assume that self-consumption and decentralized solutions will play an important role in the future, but that self-sufficiency will only rarely be achieved.

The conversion of the energy supply to sustainability does not necessarily mean exclusively decentralized supply. Some concepts, such as offshore wind farms and solar farm power plants , also rely on centralized generation and large-scale distribution for renewable energies. One example of such a major project was the DESERTEC project planned from 2009 to 2014 . Studies by the German Aerospace Center (DLR) have shown that with less than 0.3% of the available desert areas in North Africa and the Middle East, solar thermal power plants generate enough electricity and drinking water for the increasing demand in these countries and Europe can be. In the countries bordering the Mediterranean alone, four times the world power generation at the end of the 1990s could be produced on 500,000 km², which corresponds to 6% of the area of these countries. The use of the trade winds in southern Morocco is intended to complement solar power generation. The plan according to which Africa's deserts should make a considerable contribution to Europe's electricity supply is only being pursued on a smaller scale by Desertec.
Further projects are currently being planned that can contribute to climate protection. Examples of this are Gobitec , where solar and wind power from Mongolia is to be supplied to the densely populated and industrially highly developed areas of eastern China, Korea and Japan, and the proposal by the Australian National University in Canberra, Southeast Asia to supply solar power from northern Australia. Concepts for the establishment of a global power grid are also being evaluated, with the aim of smoothing out the fluctuating generation of renewable energies as well as the different demand for electricity and thus minimizing the necessary storage requirements. With electricity transmission using HVDC technology and a voltage of 800 kV, losses of less than 14% occur over transport distances of 5,000 km. The investment costs for the power lines themselves are forecast at 0.5 to 1 ct / kWh.
Today it is assumed that the future energy supply will probably consist of a mixture of decentralized and centralized concepts. It is considered certain that the conversion of the energy supply cannot be carried out exclusively through local small systems or through large structures, but a mix of both variants is required.
Sector coupling
Linking the various areas of energy supply (electricity, heat and transport) opens up further design options for energy generation and supply.
Instead of slowing down the expansion of renewable energies, an accelerated expansion is necessary in order to be able to provide additional amounts of electricity for the transport and heating sectors, although sector coupling is not to be equated with 100% electrification. For example, heat storage and a timely intelligent consumption of renewable heat energies (solar thermal, geothermal, bioenergy) can contribute to the temporal adjustment of the electricity demand to the fluctuating generation.
For the electricity and heat supply sectors, the Fraunhofer Institute for Solar Energy Systems ISE calculated in 2012 in a scenario for around the year 2050 that the total costs for the construction, maintenance and financing of an electricity system based on 100% renewable energies and heat supply in Germany are not higher than the costs of today's supply.
Reasons for switching to renewable energies
Climate protection
.jpg)
When using fossil fuels for energy purposes, large amounts of carbon dioxide (CO 2 ) are emitted. The man-made greenhouse effect is mainly caused by the increase in the consumption of fossil fuels. Since renewable energies generally emit significantly lower amounts of greenhouse gases , many countries around the world are driving the expansion of renewable energies with ambitious goals. With the expansion of renewable energies and the fossil fuel saved as a result, the carbon dioxide emissions caused by human economic activity should be reduced. Thus, the medium is carbon dioxide equivalent of wind turbines per kilowatt hour with 9.4 g of CO 2 in water power plants in 11.6 g of CO 2 , in photovoltaic systems with 29.2 g of CO 2 , in solar thermal power plants with 30.9 g of CO 2 and in geothermal power plants wherein 33.6 g CO 2 , while combined cycle gas power plants emit approx. 350 to 400 g CO 2 and hard coal power plants around 750 to 1050 g CO 2 per kWh.
The release of greenhouse gases occurs mainly during production and, to a lesser extent, during the transport of the systems, since with today's energy mix, energy from fossil fuels is still used for this purpose, and the operation itself is emission-free. However, these emissions are amortized several times over their lifetime , so that a clear net saving in greenhouse gases has to be accounted for. In 2019, renewable energies in Germany saved 203 million tons of CO 2 , so that the amount of CO 2 equivalents released was reduced to 805 million tons.
A special case is bioenergy, the use of which in biomass thermal power stations , biogas plants or as biofuel in combustion engines releases CO 2 . However, this was previously bound during the growth of the plants used in the course of photosynthesis , which is why bioenergy is in principle climate neutral. In net terms , the actual CO 2 emissions are limited to the use of fossil energy for agricultural and forestry machinery ( diesel fuel ), mineral fertilizer production and other things . However, the emissions of the strong greenhouse gases nitrous oxide and methane , which can be released with certain types of cultivation and use of biomass and which in this case worsen the overall balance of bioenergy, must also be considered.
A life cycle assessment can determine whether the hoped-for ecological advantages apply in individual cases. In the case of bioenergy , for example, there must also be negative effects such as land consumption, the burning of primeval forest for cultivation areas for soybeans or oil palms (and specifically the associated reduction in biodiversity ), energy-intensive production of artificial fertilizers , use of herbicides and pesticides , and the increased cultivation of monocultures such as for example corn , the positive effects are contrasted.
Finiteness of fossil and nuclear fuels
The deposits of fossil fuels are finite. The oil crisis (oil price shock) of 1973 gave a first foretaste of this limitation , whereby pioneers for alternative energy sources like Amory Lovins received surprising attention. Because the fossil energy system is based on the consumption of limited stocks of energy resources, it cannot last, as the energy resources will be used up after a certain period of time. The range of fossil fuels was estimated in 2009 to be 41 years for crude oil , 62 years for natural gas and 124 years for hard coal . In 2018, the US Energy Information Administration assumed that conventional oil production had already reached the "plateau" of global oil production maximum ( peak oil ) in 2005 and that this is still going on today (2019). In contrast, it is estimated that the production maximum for unconventional oil production, such as hydraulic fracturing , will be reached between 2050 and 2100.
According to a production analysis by the ecologically oriented Energy Watch Group , it is likely that global oil production will decline by around 40 percent by 2030 compared to 2012. European gas production has been in decline since 2000. After the funding maximum, it is expected that the delivery volume will decrease with a simultaneous increase in global energy demand . This is reflected in rising prices. According to a report by the Schleswig-Holstein state government on the development of energy prices, for example, between 1998 and 2012 heating oil prices rose by around 290% and natural gas prices by 110%. Electricity prices increased by 50% over the same period.
Uranium and other nuclear fuels are also limited, which is why nuclear energy is not an alternative to fossil fuels due to its limited resources. It is assumed that if the consumption of today's nuclear power plants remains the same, the uranium reserves will be sufficient until around 2070. Because of this limitation of fossil and nuclear resources, alternatives are necessary in the medium term. These resources are conserved by using renewable energy sources. An early expansion of renewable energies extends the transition phase and could thus avoid an economic downward spiral and distribution conflicts. Since the chemical industry is heavily dependent on the raw material crude oil, the conservation of resources ensures the supply of raw materials in the long term.
From an environmental-historical point of view, the industrial era that began with the Industrial Revolution represents an unstable system that is not sustainable in the physical-energetic sense. Phases of exponential (material) growth, as they have occurred since the beginning of industrialization, are basically only possible temporarily because the world has physical limits; permanent growth is therefore physically impossible. The fossil-based economic system is therefore currently in a "pioneering situation" of relative energy surplus, which will in turn be replaced by the energy shortage after this exceptional situation has expired. The English economic historian Edward Anthony Wrigley also points to this historically short exceptional situation, who sees the continued dependence on fossil fuels against the background of the finite nature of fossil fuels and the global warming caused by their combustion as a “path to catastrophe”.
Economic evaluation
Import dependency
The expansion of renewable energies is also justified with a reduced dependency on imports and thus increased security of supply, which is also accompanied by an increase in domestic added value. Political dependencies on individual states (e.g. Russia ), unstable regions (e.g. the Middle East ) or individual corporations or cartels with great power ( Gazprom , OPEC ) should also be achieved through higher energy autonomy through renewable energies and the associated the associated diversification of the resource base. According to the World Trade Organization (WTO), fuel imports worldwide amounted to 3,150 billion US dollars in 2014. This is particularly reflected in the trade balances of emerging and developing countries. In 2014 India spent around a quarter of its import spending on fossil fuels. In Pakistan the share was 30 percent, in China 14 percent and in Germany 9 percent.
Economic growth and value creation
A study by the United Nations led by Caio Koch-Weser, former Vice President of the World Bank , came to the conclusion in 2014 that the rapid expansion of renewable energies and other climate protection measures make economic sense and stimulate economic growth. For Germany, the German Institute for Economic Research (DIW) has shown that the expansion of renewable energies leads to stronger economic growth and rising consumption. According to this, the gross domestic product in 2030 will be around 3% above the level that would be achieved without the expansion of renewable energies. Private consumption should be 3.5% and private fixed investments even 6.7% above the level that would result if there were no expansion of renewable energies. However, these calculations are based on the assumption that the switch to renewable energies will not lead to a deterioration in international competitiveness due to rising energy prices. In another scenario, in which impaired international competitiveness was assumed, GDP in 2030 is 1.0% above the zero scenario, although the study does not provide any information on the assumed extent of the impairment of competition under which this result is obtained . The DIW has examined the economic net balance with a model that also depicts the macroeconomic interactions and international interdependencies. The basis for calculating the assumed expansion figures was the 2009 lead scenario of the Federal Ministry for the Environment, which forecasts a share of renewable energies in German final energy consumption of 32% in 2030.
A study by the Society for Economic Structural Research (gws) and the Institute for Energy and Environmental Research Heidelberg provides similar results : more renewables and more energy efficiency result in higher economic performance , additional investments and jobs and, in the long term, lower energy costs. Since other countries will also convert their energy systems in the future, export opportunities will open up for German companies.
In a study for Siemens in 2015, the University of Nuremberg estimated the avoided costs of renewable energies due to lower electricity exchange prices and other economic effects at 11 billion euros. Other studies concentrate on the value creation through renewable energies and estimate this for the year 2012 at 17 billion euros (direct) plus 9.5 billion euros (indirectly via suppliers and intermediate services). Two thirds of the added value benefit cities and municipalities and contribute to the development of structurally weak areas. As reported by the Federal Statistical Office, more than 45 billion euros in sales were generated in Germany in 2011 with goods and services relevant to climate protection. This corresponds to just under two percent of the total gross domestic product (GDP). In Saxony-Anhalt four percent of GDP was generated through climate protection-related sales, in Bavaria 3.5 percent. The solar energy sector had the largest share of total sales with sales of 14.3 billion euros, but the wind (8.3 billion euros) and bioenergy sectors (2.2 billion euros) also contributed to GDP. According to analyzes by the International Finance Corporation, which is part of the World Bank, and the management consultancy AT Kearney, there is an investment potential of around 640 billion dollars for climate protection technologies in Eastern Europe, Central Asia, the Middle East and North Africa by 2020. The largest item is wind energy, at $ 52 billion.
In addition to the home market, the increasing demand for renewable energy systems from abroad is also generating growth in German industry. For example, the export quota of the German wind energy industry in 2011 was around 66%.
labour market
Around 9.4 million people were employed in the renewable energies sector worldwide in 2015 (approx. 1.3 million more than in 2016 and approx. 2.9 million more than in 2013). 24.4 million jobs are expected by 2030. About 40% of these jobs were in China, Brazil, Germany, the United States and India. The most important subsector was the photovoltaic industry.
According to surveys by the federal government, around 371,400 people were employed in Germany in 2013 through the expansion of renewable energies. This is a significant decrease compared to 2012 of over seven percent. The most important industry was wind energy with 138,000 employees, which recorded an increase in employees of over 13 percent in 2013. While bioenergy, the second most important employer with around 126,000 employees, remained roughly at the level of the previous year, there was a sharp decline in the solar energy sector, especially in photovoltaics, compared to the previous year: there were a similar number of 114,000 in 2012 due to the boom in the industry People were employed as in the wind and bioenergy industries, the number of employees fell within one year to 68,500 employees. However, more people were still employed there than in 2011 (49,200). This decline is primarily due to the slowdown in the expansion of photovoltaics in Germany, which resulted in job cuts in both production and the installation of the systems.
Although the share of renewable energies in energy demand is only around 12%, significantly more people are now employed in the renewable energies sector across Germany than in the conventional energy sector. In 2003 the total number of jobs in the conventional energy industry was 260,000; a number that the regenerative industry almost reached in 2007 with around 250,000 jobs. In 2013, around 31,000 people were employed in coal mining across Germany, of which around half of the jobs will be lost by the then expiring hard coal subsidy. In 2014 around 123,000 jobs were attributable to the export of renewable energies, which corresponds to 44% of those employed in systems and components.
Democratization of the energy supply

The switch to renewable energies should also promote the democratization of the energy supply. One possibility of increasing social participation in the energy supply is to found community energy cooperatives , as is the case in some countries around the world. In recent years, community energy cooperatives have been set up in a number of countries, notably Canada , the United States , the United Kingdom , Denmark and Germany . Typically, citizens' energy cooperatives worldwide follow the seven principles that were adopted by the International Co-operative Alliance in 1995 : Voluntary and open membership, democratic membership control, economic participation of members, autonomy and independence, training, advanced training and information, cooperation with other cooperatives and provision for the community .
In 2013 there were 718 energy cooperatives established in Germany since 2008, which together had around 145,000 members, mostly private individuals. These can usually participate with contributions from 500 euros. Together, these cooperatives have so far invested around 1.35 billion euros in renewable energies. As a result of the 2014 amendment to the EEG, however, a sharp decline in new investments is expected due to worsened investment conditions, especially for community projects.
Citizen engagement in energy supply has a long tradition in Germany. As early as the end of the 19th century, several energy cooperatives were founded in rural areas to produce electrical energy or to build and operate a distribution network. The background to this was that larger energy companies usually had no economic interest in setting up a power grid in sparsely populated regions, as this would not have paid off there due to the low power consumption.
Contribution to peacekeeping
In a study commissioned by the Federal Ministry for the Environment, Nature Conservation, Building and Nuclear Safety (BMUB) in 2007, the Wuppertal Institute for Climate, Environment, Energy and Adelphi Consult assume that renewable energies support the development towards peace . The Federal Ministry for Economic Cooperation and Development (BMZ) also takes this view .
Ecological evaluation
The different technologies for using every form of energy, including renewable energies, always have an impact on the biosphere , i.e. also on people and the ecosystem that enables them to live . In addition to direct emissions, carbon footprint and resource consumption of the plant (goods life cycle), production, operation, disposal must be considered, etc. for an integrated approach also assembly and disassembly. These effects have to be understood, quantified and compared with the alternatives. Only then do the benefits and harm in the energy and entropy balance , for biodiversity and social consequences become clear. Nature conservation associations advocate the greater expansion of renewable energies.
Basically, it can be said that renewable energies have a better environmental balance compared to conventional forms of energy use. This is expressed not least in the significantly lower external costs of renewable energies, which in the energy sector are primarily caused by environmental, health and climatic damage (see below). Renewable energies are therefore often referred to as clean energy . In the case of non-renewable energies, on the other hand, the combustion of fossil fuels in particular is highly polluting both locally and globally due to the resulting combustion residues and greenhouse gases . By converting the energy supply to a regenerative energy system, the environmental pollution caused by the energy sector can be reduced.
solar power
Photovoltaics
According to a study by Peng et al., The energetic amortization period of photovoltaic systems is currently (as of 2013). globally between 0.75 and 3.5 years, depending on the location and photovoltaic technology used. The mean value fluctuates in the range from approx. 1.5 to 2.5 years. This means that during this period the photovoltaic system has again brought in the energy that was consumed during its entire life cycle. The manufacture of the systems, their transport, construction, operation and dismantling or recycling are therefore taken into account . The calculated CO 2 emissions from photovoltaic systems are between 10.5 and 50 g CO 2 / kWh, depending on the technology and location , with averages in the range 35 to 45 g CO 2 / kWh. The study assumed 30 years for modules based on crystalline silicon cells and 20-25 years for thin-film modules, and 15 years for the inverter. The operation of energy storage systems or backup power plants that may be necessary from a system-wide perspective is not taken into account.
Around five kilograms of silicon are required per kilowatt of installed capacity (monocrystalline and polycrystalline cells). In addition, as with all electronic components, there are sometimes toxic heavy metals . With silicon and CIGS technologies, however, these substances largely remain in the factory. The finished solar module itself does not contain any toxic or dangerous substances and is a recyclable material. Modules based on cadmium telluride contain toxic heavy metals, but are also recyclable.
Solar panels
Metals such as copper and aluminum are used in solar thermal solar collectors . The energetic amortization period of a solar thermal system is 12 to 24 months, i.e. In other words, during this time the collectors supplied the same amount of energy to the heating system that had to be used for production etc. of the system. The service life of the collectors is at least 30 years.
Hydropower
The construction of dams and dams is a massive encroachment on the environment. The dammed up water floods land that could previously be used for other purposes. If people lived there, they have to move away. In many reservoir projects there were changes in the ecosystem, as the seasonal water level fluctuations of the rivers and the transport of silt by the rivers were interfered with. Lake Nasser (Nile / Egypt) is a particularly well-known example .
In regions with a lack of water, there are conflicts of use between those lying above and those lying below . For example, Tajikistan dams the Syr Darya (and tributaries) in summer to generate electricity in winter. Kazakhstan , located downstream, needs the water for its agriculture in summer. Another example is the Southeast Anatolia project (22 dams, 19 hydropower plants and irrigation systems along the two rivers Euphrates and Tigris ), see Southeast Anatolia Project # Problems with the neighboring countries .
Even hydroelectric power stations interfere "their" river. However, most European rivers are dammed for inland navigation and for other purposes anyway (avoidance of floods and low water, ensuring sufficient cooling water quantities for large power plants, e.g. nuclear power plants and fossil power plants etc.).
Wind energy
Wind parks are viewed critically by landscape protection and nature conservation . At certain locations, there may be a risk to birds or bats (bird and bat rash) . According to NABU , around one thousand birds die every year in Germany when they collide with a wind turbine, which corresponds to around 0.5 birds per system and year. In contrast, there are around five to ten million birds killed by road traffic and power lines. Reliable data series for endangered bird species such as the red kite and the white stork show stable populations since the 1990s, despite the considerable expansion of wind power.
Noise and infrasound development can in principle be stressful; However, in the larger distances prescribed by law, the noise emissions are usually drowned out in the background noise, which is largely determined by traffic and industry as well as the local wind. The "disco effect" caused by the reflection of the sun on the wind turbines is now completely avoided by applying matt colors to the wind blades , but the shadowing of the rotor blades can also be perceived negatively. Time-controlled and sun-controlled shutdown systems are used to minimize the shadows, which limit the shadows to the maximum permissible shadow duration under the Immission Control Act of theoretically 30 hours per year (corresponding to about 8 hours in real terms) and 30 minutes per day.
In certain types of wind turbines, neodymium is used as a building material for the generator. The mining of this rare metal takes place predominantly in China, where methods are used that harm both the environment and the workers. The German wind turbine manufacturers REpower Systems and Enercon emphasize that they do not use neodymium in their wind turbines.
Bioenergy
Bioenergy includes the use of solid, liquid and gaseous biogenic energy sources, especially wood, agricultural products ( energy crops ) and organic waste.
The combustion of biomass can pose a risk to human health if it is carried out on open fires or in ovens without filter systems, as air pollutants such as nitrogen oxides , sulfur dioxide and fine dust are generated. In Germany, the use in stoves, chimneys and other systems is regulated in the ordinance on small and medium-sized combustion systems (1. BImSchV) and prescribes limit values and various measures, such as filter systems. (see also article wood heating )
The space available for growing biomass is limited. At the same time, the space efficiency of biomass is extremely low (less than a tenth of photovoltaics). This leads to tension between food cultivation and nature and landscape protection (e.g. protection of biodiversity ). For example, while the use of agricultural residues and waste is usually considered to be unproblematic, the intensive cultivation of food crops or the reservation of cultivation areas for suitable plants (e.g. maize and sugar cane ) for the production of fuels have come under fire. Palm oil , in particular, has come under fire, as tropical rainforests , which are rich in species and act as carbon stores, are cleared for oil palm plantations and the stored carbon is released again as CO 2 during slash and burn . (see article competition for land or use and competition for food )
The benefits of biofuels are also discussed. For the production of rapeseed oil , for example , large amounts of synthetic fertilizers (mineral fertilizers) and pesticides are used, which pollute people and the environment. So far, it has also been a matter of dispute how big the contribution to climate protection is, since emissions of the very strong greenhouse gas laughing gas (around 300 times stronger greenhouse gas than CO 2 ) caused by nitrogen fertilization , for example, are difficult to quantify. The German Academy of Natural Scientists Leopoldina certifies that biofuels from arable crops have no advantage in terms of CO 2 emissions compared to fossil fuels. With legal requirements (EU Directive 2009/28 / EG (Renewable Energy Directive) and its implementation in German law with the Biofuel Sustainability Ordinance ), the more sustainable production of biofuels is to be ensured.
It is hoped that second-generation biofuels that are still in development , such as cellulosic ethanol and BtL fuels, will achieve better ecological balances, since they can use whole plants and residues and thus deliver higher yields per area than the currently dominant oil plants. However, the manufacturing process is significantly more complex than with the first-generation biofuels .
Biomass is also suitable for producing hydrogen in a hydrogen economy .
Geothermal energy
Negative environmental impacts can also occur with geothermal energy. When underground heat exchangers are stimulated, seismic events can occur, but these are mostly below the perceptible limit (December 2006, Basel, magnitude 3.4). So far, neither personal injury nor structural damage to buildings has been caused worldwide. In Basel, however, minor damage with a total of 3 and 5 million francs (approx. 1.8 to 3.1 million euros) was compensated by insurance companies as a gesture of goodwill. The project has been discontinued. The engineer responsible was initially charged, but then acquitted.
Under certain geological conditions that contain rock layers containing anhydrite , and presumably improper execution of the drilling work in near-surface geothermal projects, significant small-scale uplifts of the earth's surface can occur, as happened in 2007 in Staufen .
Economy and costs
Direct costs
The competitiveness of the individual energy conversion technologies depends to a large extent on the energy production costs, which result from the investment and financing costs incurred during construction as well as the operating costs including maintenance and possibly fuel costs. External costs (see below) are not taken into account when calculating the levelized cost of electricity , since the determination of the levelized cost of energy is a matter of business and not economic costs. While the external costs of conventional power plants are comparatively high, renewable energies are characterized by low external costs. With the exception of biomass use, most renewable energies have rather high investment costs and low operating costs.
LCOE and competitiveness
| Energy source | Electricity generation costs in ct / kWh | ||
|---|---|---|---|
| Data origin: Fraunhofer ISE 2018 | |||
| Brown coal | 4.59-7.98 | ||
| Hard coal | 6.27-9.86 | ||
| Natural gas CCGT | 7.78-9.96 | ||
| Natural gas gas turbine power plant | 11.03-21.94 | ||
| Wind / onshore | 3.99-8.23 | ||
| Wind / offshore | 7.49-13.79 | ||
| Biogas (without heat extraction) | 10.14-14.74 | ||
| Small photovoltaic system roof | 7.23-11.54 | ||
| Large photovoltaic system roof | 4.95-8.46 | ||
| Large photovoltaic power plant open space | 3.71-6.77 | ||
For a long time, renewable energies were considered to be significantly more expensive than conventional energies. Photovoltaics in particular has long been considered the most expensive form of electricity generation using renewable energies; a view that has now become obsolete due to the significant cost reductions in the system components.
As of 2018, both onshore wind power and large-scale photovoltaic systems are similarly or cheaper than lignite or hard coal power plants and combined cycle gas power plants, while small-scale photovoltaic systems and offshore wind farms are even more expensive. It is expected that the cost of most renewable energies, with the exception of biogas, will continue to fall and that fossil and nuclear energy generation will tend to become increasingly expensive. Wind turbines on land in particular therefore play an important role in dampening the rise in electricity prices. The range of electricity production costs of renewable energies is relatively high: the cheapest form of electricity generation is often energy conversion from hydropower , which has therefore been established for a long time. Current new buildings have electricity production costs of 2 to 8.3 ct / kWh, with the lower range only being achieved by large power plants.
In March 2018, the Fraunhofer Institute for Solar Energy Systems published an updated study on the electricity production costs of regenerative and conventional power plants. According to this, the electricity generation costs of small photovoltaic systems in Germany amount to 7.23 to 11.54 ct / kWh and of large roof systems to 4.95 to 8.46 ct / kWh. Free-standing systems come to 3.71 to 6.77 ct / kWh, which makes them cheaper than conventional fossil power plants. In regions with higher solar radiation than in Germany, more favorable values are also achieved. This means that the electricity production costs of PV systems are well below the end customer electricity price, which in Germany averaged 29.23 ct / kWh in 2017, which means that grid parity is achieved. The competitiveness of onshore wind turbines compared to conventional power plants has already been achieved in good locations, according to the expert report. The levelized cost of electricity on land is between 3.99 ct / kWh and 8.23 ct / kWh and thus in the range of lignite power plants and below the levelized cost of electricity of gas power plants. Offshore plants, on the other hand, are significantly more expensive due to higher financing and operating costs despite more full load hours , their electricity production costs in 2018 are 7.49 to 13.79 ct / kWh. Solar thermal power plants with integrated heat storage to steady electricity production can produce electricity for 8.09 to 10.12 ct / kWh in the Earth's sun belt and are currently more expensive than photovoltaic systems. The electricity production costs of biogas plants are between 10.14 and 14.74 ct / kWh. The study assumes that the costs of most renewable energies will continue to fall by 2035, with photovoltaics and offshore wind energy in particular still having great cost-cutting potential. Cost reductions are also expected for onshore wind energy through higher full-load hours and low-wind systems, while only low cost-cutting potential is expected for biogas. In the case of conventional power plants, the authors u. a. anticipated a significant increase in the levelized costs of electricity due to falling capacity utilization by 2035.
A Prognos study commissioned by Agora Energiewende to compare the costs of low-carbon technologies found in early 2014 that electricity from photovoltaic and wind power plants is now up to 50% cheaper than from new nuclear power plants. The decisive factor for this are the high cost reductions for renewable energies of up to 80% since 2009. The analyzes are based on the tariff rates for new nuclear power plants in England and the tariff rates for green electricity in accordance with the Renewable Energy Sources Act in Germany. The generation of electricity from new coal-fired power plants with CO2 capture and storage is accordingly considerably more expensive than investments in renewable energies and at a similar level to nuclear power plants. In addition to the costs of electricity generation, the study also estimated the costs of an electricity generation system in which the weather-dependent feed-in from wind and sun is offset by gas-fired reserve power plants. According to this scenario, a power supply from wind and solar power plants combined with gas power plants is 20% cheaper than a power supply based on nuclear energy.
According to DIW, the costs for renewable energies were often overestimated in the past and fell far faster than expected in the past. For example, in a report published in 2013, the EU Commission assumed that the cost of capital in 2050 would already be undercut in some cases today.
Electricity (state subsidy)
With regard to the promotion of renewable energies in Germany, the Renewable Energy Sources Act (EEG), which came into force in April 2000, plays a special role. This regulates the preferred feed-in of electricity from renewable sources into the power grid and guarantees their producers fixed feed-in tariffs. The costs for this are allocated to the general electricity price via the EEG levy and are thus borne by the electricity consumers. For competitive reasons, however, commercial consumers with an electricity consumption of over 1 GWh / a (as of 2013) are largely exempt from the EEG surcharge with electricity consumption in excess of 1 GWh. These exceptions in particular are the subject of political discussion.
Despite significant reductions in the tariff rates per kilowatt hour, the EEG surcharge has risen sharply in recent years due to the strong expansion of renewable energies, the merit order effect and other distorting special factors. The EEG surcharge has developed inconsistently since 2015. In 2019 it is € 6.405 ct.
Due to numerous distorting effects, the EEG surcharge is not a valid indicator for the costs of renewable energies. Renewable energies in particular lead to falling stock exchange electricity prices ( merit order effect), while the EEG surcharge is measured as the difference between the exchange electricity price and the statutory feed-in tariffs. The lower the electricity price on the exchange, the higher the levy for renewable energies, all other things being equal. The so-called “Energy Transition Cost Index” (EKX), which adjusts the EEG surcharge for the distorting effects (including exceptions for industry) and, in return, other cost factors (such as the promotion of combined heat and power, for example) provides a benchmark for comparison ) without taking into account the costs for the construction and operation of the additionally required networks as well as the storage and / or shadow power plants. According to this, more than 50% of the increase in electricity costs between 2003 and 2012 is due to higher fuel prices and redistributive effects of industrial policy.
According to the former Federal Environment Minister Peter Altmaier , the energy transition could cost up to a trillion euros by 2040 (including heat and transport). However, the Federal Environment Ministry was unable to explain in writing to the Bundestag how this figure was calculated. The Federal Association for Renewable Energy rejected the figure as “dubious”, as it gave the impression that society would not incur any additional costs if the expansion of renewable energies were slowed down. The Ecological-Social Market Economy forum , however, presented an analysis that compares the funding costs for renewable energies, the avoided costs for fossil energies, the cost containment on the electricity exchange and the avoided environmental damage costs. As a result, the energy transition will generate a positive economic balance from 2030. According to the subsidy report of the EU Commission, nuclear and coal-fired power plants receive more subsidies than all renewable energies as a whole.
The International Energy Agency (IEA) judged in its 2013 country report on Germany: “The cost effects of the EEG must be assessed in the context of general developments in the energy sector. The most recent increase in electricity prices is causing problems for households with low incomes in particular, whereas large consumers are less affected by the surcharge and at the same time benefit from the reduction in wholesale tariffs brought about by renewable energies. In addition, fuel poverty is also increasing due to the sharp rise in fossil fuel costs. The costs and benefits of renewable energies must be distributed fairly and transparently. "
warmth


According to a study by the Center for Solar Energy and Hydrogen Research Baden-Württemberg (ZSW), private households can save operating costs by using regenerative heat compared to oil heating . According to this, the 4.3 million German private households that use renewable energies for heat supply saved consumption-related heating costs averaging 595 euros per household in 2009. Despite the relatively low price level of conventional heating oil and natural gas , these households would have incurred additional costs totaling 2.56 billion euros if they had only covered their heating needs with fossil fuels. However, the investment costs in a new heating system are not taken into account in this figure.
For homeowners, replacing old oil or gas heating systems with heating systems based on renewable energies is financially attractive, as calculations by ZDF Wiso and the Renewable Energy Agency show. The Federal Environment Ministry's market incentive program awards grants for heating based on solar, environmental or bioenergy; the Kreditanstalt für Wiederaufbau (KfW) grants low-interest loans. Regenerative heat generators are funded with the Renewable Energies Heat Act .
In addition, there is considerable potential for savings in thermal insulation in most buildings .
Avoidance of external costs
| Energy source | ct / kWh |
|---|---|
| Brown coal | 20.81 |
| Hard coal | 18.79 |
| natural gas | 8.59 |
| oil | 20.06 |
| Hydropower | 0.30 |
| Wind energy | 0.28 |
| Photovoltaics | 1.64 |
| Biomass | 7.71 |
When external costs is impairment, "which a third party through a project, often are added to the general public without the person concerned will be compensated." In the economics of this term was introduced about 100 years ago by Arthur Cecil Pigou . In the energy sector, the first comprehensive investigations were carried out by Olav Hohmeyer around 1990 ; Since then, the consideration of external costs in energy conversion has been a core component of environmental and energy policy considerations. However, their exact quantification still causes problems.
From a theoretical and economic point of view, when evaluating different technologies, all costs and benefits that society incurs from their use must be taken into account . In addition to the direct generation costs, energy generation also incurs external costs, i.e. costs that are not covered by the energy price, but have to be borne by the taxpayer or other parts of society. These include, for example, the costs caused by pollutant and carbon dioxide emissions or the costs resulting from the risks of using nuclear energy. In the energy sector, external costs are mainly caused by environmental, health and climate damage. Basically, the costs of conventional energy supply do not reflect the external costs actually caused by this form of energy use. Although external costs also arise when using renewable energies, these are significantly lower than when using conventional energy sources. This distorts the economic competition between renewable energies and conventional energy sources to the detriment of regenerative energies.
If, as is the aim of liberalization , the market is to find the most economically efficient mode of production, then it is imperative that all factors that distort competition be avoided and that the cost truth be established by internalizing all external factors. If this does not happen, the efficiency advantages of a liberalized market can be negated by negative effects on the environment. Options for producing this true cost are incentive taxes such as B. a CO2 tax or a functioning emissions trading system . These necessary mechanisms set limits to a completely free energy market. So far (April 2014) these external effects have only been internalized to a small extent; full internalization is not foreseeable. So z. For example, the “Annual Report on Energy Consumption in Germany in 2013” by the AG Energiebilanzen concluded that “the incentives intended with emissions trading for emission-reducing behavior at such certificate prices [of approx. 5 euros / tonne] are not to be expected”. Since it is a market failure, internalization usually requires state intervention, whereby both market economy and regulatory measures come into question.
According to the Ecofys study on behalf of EU Energy Commissioner Günther Oettinger, the external costs of energy supply in the EU amount to 150 to 310 billion euros in 2012, including Germany with 42 billion euros, which is largely (45%) the high coal-fired power generation. Coal has external follow-up costs of 140 euros per megawatt hour, natural gas 60 euros, solar energy 20 euros, biomass 25 euros, wind power close to zero.
In 2011, renewable energies in the electricity, fuel and heat sectors avoided external costs of around EUR 8.9 billion, and fuel imports of EUR 2.9 billion were avoided. With around 8 billion euros, the greatest avoidance of external costs took place in the electricity sector.
Business costs
Energy costs for German industry fell steadily from 2010 to 2017. Due to the various tax and tax privileges as well as falling wholesale prices as a result of the merit order effect of renewable energies, the energy-intensive industry in Germany obtains electricity relatively cheaply compared to previous years and compared to other industrialized countries.
In the manufacturing industry in Germany, the energy costs and thus the EEG surcharge only have a small share in the gross production value, compared to material and personnel costs, for example. According to the German Institute for Economic Research , the total electricity costs account for an average of around 3% of a company's turnover, of which the EEG surcharge only makes a small contribution. The costs are higher for electricity-intensive companies, but these are largely exempt from the EEG surcharge and eco-tax (Germany) in order to avoid competitive disadvantages. Energy-intensive industries are also currently benefiting from historically low prices on the electricity exchange.
According to the Federal Network Agency , several hundred companies consumed around 18% of the electricity in 2012, but only paid 0.3% of the EEG surcharge, as many large consumers are exempt from the EEG surcharge. With the entry into force of the EEG amendment in 2012, the exemptions for industry were considerably expanded, which also caused the EEG surcharge to rise as these costs are passed on to the other surcharge payers. This redistribution has met with criticism due to distortions of competition, additional burdens for private consumers and ecologically questionable relief effects. The number of exempted companies then rose to 2098 in 2013. Since this relief also distorts competition, the EU Commission initiated state aid proceedings against Germany in June 2012 . According to estimates, the exemptions amounted to EUR 2.7 billion in 2012, around EUR 5.0 billion in 2013 and around EUR 7.0 billion in 2014.
Due to the merit order effect, electricity prices on the electricity exchange fell due to the introduction of renewable energies financed by the EEG surcharge. Since large industrial consumers are almost completely exempt from the EEG surcharge, but at the same time benefit from the fallen stock exchange electricity prices, the EEG surcharge can hardly be held responsible for any companies moving abroad, according to Erik Gawel .
According to the network operator Tennet TSO , the spot market price in Germany fell by 13% for the following day in 2014; German industry pays the lowest electricity prices in Europe. The electricity prices in over-the-counter trading are also becoming cheaper in Germany. For the years 2015 to 2017, electricity with direct supply contracts costs between 2.68 and 4.28 cents per kilowatt hour, according to the Association of Industrial Energy and Power Industries (VIK).
Price-lowering effect on the electricity exchange
The pricing on the electricity exchange is not based on the electricity production costs, but on the marginal costs of the power plants offering it, i.e. H. at the respective variable costs. Marginal costs are the additional costs that arise from increasing production . For the most part, they result from the fuel costs of a power plant and the costs for emission rights . The concept of marginal cost comes from the business studies and plays in the context of the merit order (English for order of performance / the earnings ) designated use sequence of the power plants for electricity production for renewable energy, a significant role. Determining the exact amount of the marginal costs of a power plant is problematic because the marginal costs depend to a large extent on the degree of utilization of a power plant.
Starting with the lowest marginal costs, power plants with higher marginal costs are switched on on the electricity market until demand is met. In addition, however, the marginal costs also depend on the duration of the imminent connection or disconnection of the operator. For a large part of the base load power plants , however, the order of use is not determined on the spot market , but rather anticipated on the futures market , so that base load power plants continue to feed in comparatively high outputs even on days with high solar and wind power feed-in despite their higher marginal costs. On sunny, windy days, the supply of solar and wind power on the spot market is then not offset by sufficient demand for electricity (because this has already been largely satisfied on the futures market). The oversupply of electricity on the spot market can then lead to negative exchange prices. These almost exclusively affect electricity from renewable energies, but not the electricity from base load power plants previously sold on the futures market.
Since no fuel costs are incurred when generating renewable energies and the maintenance costs hardly increase with an “additional” use of the energy generation system, the marginal costs of renewable energies tend towards zero. Only the combustion or gasification of biomass or storage gas causes fuel costs.
The increasing feed-in of renewable energies in Germany since the amendment of the EEG rolling mechanism in 2009 via the merit order on sunny and windy days has led to a sharp drop in the price of electricity on the exchange - in individual cases (situations with high production of renewable energies at the same time lower electricity demand) even to negative values. This is one of the main reasons that the EEG surcharge has increased significantly in recent years. However, due to the faulty construction of the EEG compensation mechanism, this price-lowering effect does not reach private customers, but paradoxically increases the cost of electricity for private customers, while industry, on the other hand, benefits from the lower procurement costs on the electricity exchange.
According to a study by the Institute for Future Energy Systems, which Uwe Leprich presented in January 2012, photovoltaics alone lowered the average stock market price by up to 10% in 2011 and by up to 40% during the noon hour. On a daily average, this would correspond to a decrease in electricity prices between 0.4 and 0.6 ct / kWh. This would result in a price-reducing effect of between 520 and 840 million euros for 2011. However, this primarily benefits the electricity-intensive industry, as it is partially exempt from the EEG surcharge, but at the same time benefits from the price reduction there by buying electricity on the exchange, while other customers are bound by their electricity contracts. If this effect were corrected, household electricity prices would be reduced by 0.11 to 0.175 ct / kWh.
The price of electricity on the electricity exchange had risen continuously until 2008 and in 2008 reached the maximum of 8.279 cents / kWh. The price of electricity has fallen significantly, among other things due to the increased use of renewable energies.
In a study commissioned by Siemens, scientists from the University of Erlangen found that electricity costs in Germany would be significantly higher without renewable energies. According to the study, German electricity consumers saved a total of 11.2 billion euros in 2013. It is true that the EEG surcharge increases the price of electricity. Renewable energies would, however, also significantly lower the price of electricity on the electricity exchange due to greater competition, so that German electricity consumers would end up being cheaper than without renewable energies.
Integration of renewable energies into the energy system
In the power grid , generation corresponds to consumption at all times, since the grid does not store electrical energy . Local imbalances initially lead to small deviations from the nominal voltage, which not only causes balancing power flows between the sub-networks, but also a falling network frequency, as rotating electrical machines deliver more electricity or consume less electricity than corresponds to the drive or load torque (in power plants or for consumers). Thanks to the active network control network and the provision of control power , the partial networks in phase and the frequency remain constant within narrow limits. In connection with the expansion of renewable energies, the need for control power is a matter of controversy.
In order to enable high proportions of electricity from renewable energies in the supply, various measures can be used individually or in combination. Studies, for example by Fraunhofer IWES on behalf of the BEE (December 2009), show that such a reliable power supply is possible.
These measures include: B. the stabilization of electricity generation from renewable energies, the expansion of the power grids, the creation of intelligent generation and consumption structures, as well as the (expansion) of electricity storage. While some measures, such as the expansion of the electricity grid, make sense even if the proportions of fluctuating generators are comparatively low, other means such as B. the construction of storage power plants in order to avoid unnecessary energy losses and costs is only advisable when the shares are high.
A mix of different renewable energy sources is also necessary , since different renewable energies complement each other. For example, there is a potential of more than 1000 GW for photovoltaics in Germany, which could produce around 1000 TWh of electrical energy per year; significantly more than the current German electricity demand. However, since this would produce large surpluses, especially in the lunchtime hours of sunny days, and enormous storage capacities would have to be built up, such a strong expansion of just one technology does not make sense and the combination with other renewable energies is much more practical. Wind energy and photovoltaics have the greatest potential for power generation in Germany, with biomass following at a considerable distance.
Stabilization of electricity generation


The demand for electricity, the so-called load profile , fluctuates strongly over the course of the day. Since electrical energy can only be stored with great effort and losses, it is provided by the power plant management according to demand. In Germany, the base load has so far mainly been provided by lignite and nuclear power plants, while the medium load is covered by hard coal power plants . The peak load delivered in the past mainly gas and pumped storage power plants , which now particularly the proportion of gas power plants has decreased by the increased supply of renewable energy.
With increasing proportions of electricity from renewable energies, a change in power plant management is necessary. Geothermal power plants, hydropower plants and biomass power plants are capable of base load and can be regulated like conventional power plants, but the generation of electricity from solar energy and wind is subject to strong fluctuations, which must be compensated for by using controllable power plants or storage systems. However, these fluctuations partially correlate with the daily or annual load profile. In this way, electricity from solar energy is provided at the main times of demand. Electricity from wind energy is increasingly generated in the winter half-year and can compensate for the lower yields of solar systems at that time, whereby the combination of these two sources leads to a steady production when considering the seasonal course. When considering shorter periods of time, however, large fluctuations occur that must be compensated for.
In biogas plants , the energy conversion can be postponed for several hours without major losses, and many run-of-river power plants can also reduce their production by a few hours by means of surge operation and thus mainly deliver electricity at high demand hours or during times of low production from wind and solar energy. Photovoltaic and wind energy systems can be throttled or completely switched off and put back into operation within about 30 s (self-test and start-up of a photovoltaic inverter ) to a few minutes (larger wind energy systems). This is even an advantage over large steam power plants and nuclear power plants , which take several hours to reach full capacity when starting up. However, unlike in the case of biogas systems and conventional power plants, switching off photovoltaic or wind energy systems does not save any fuel and therefore does not avoid costs. In order to provide higher outputs, combined cycle power plants are also to be used increasingly , since they can react sufficiently to rapid load changes.
To cushion fluctuating feed-in quantities, hydropower plants and biogas power plants can be operated briefly above their average output, which is limited by the supply of water and biomass. Flexibilized biogas plants are of particular importance, as they can offer an available compensation potential of around 16,000 MW in total. Within a few minutes, this capacity could be reduced in the event of oversupply in the network or increased in the event of increasing demand. For comparison: the capacity of the German lignite power plants is put at around 18,000 MW by the Federal Network Agency. However, due to their technical inertia, these large fossil power plants could only provide a few thousand megawatts for short-term balancing of solar and wind power.
By making the electricity system more flexible, overproduction can be cushioned even when the share of renewable energies increases sharply. This requires a high degree of flexibility in the electricity system and thus a reduction in so-called “must-run” capacities.
In order to be able to plan the use of the other types of energy, it is important that the short- and medium-term forecast of the expected wind power and solar power is as accurate as possible . The power plant management can control the short-term and especially the longer-term controllable power plants better.
Expansion of the power grids


With the expansion of wind farms away from the previous generation centers, the structure of the grid feed-in is shifting. This requires both modernization and expansion of the power grids. This applies in particular to the construction of offshore wind farms, which make it necessary to expand high-voltage lines. By linking regions with high capacities for electricity generation from wind with regions with many hydropower or pumped storage power plants, power peaks can also be stored and generation can be stabilized. With an intelligent interconnection of several renewable energy sources by virtual power plants and the implementation of smart grids , the need for additional high-voltage transmission lines can be reduced. In Germany, the need to expand the grid also results from the need to expand cross-border electricity generation regardless of the energy transition. In 2015 the federal government decided to give priority to underground cables over overhead lines in order to counter acceptance problems among the population.
According to the Federal Network Agency's 2012 network development plan, around 3800 kilometers of new power lines will have to be built by 2022 so that at least 35% renewable energies can be integrated into the network by then. In addition, around 4,000 kilometers of existing routes are to be upgraded. This requires investments of around two billion euros annually, of which 1.2 billion would have been incurred even without the expansion of renewable energies, for example due to the increasing electricity trade in the EU. The new lines are also necessary to avoid shutting down power plants to avoid network overloads. According to the authority, the resulting costs would already be in the three-digit million range. Without network expansion, they could grow to 800 million euros per year by 2022. In addition, according to the distribution network study published by the German Energy Agency (dena) (2012), by 2030, electricity networks ranging in size from 135,000 km to 193,000 km must be expanded and converted over a length of 21,000 to 25,000 km. For this, between 27.5 billion and 42.5 billion euros must be invested. However, the distribution grids currently still have considerable reserves for the expansion of renewable energies. Their capacity can also be further increased through technical innovations. According to the German Institute for Economic Research (DIW), the power grid will not be a bottleneck for the expansion of renewable energies in the foreseeable future.
The Federal Association for Renewable Energy , the branch association of the renewable energy industry, supports the expansion of the power grids and considers the costs to be manageable; Spread over the entire investment period, the estimated costs only amounted to a maximum of 0.5 cents per kilowatt hour of electricity. Further delays in the expansion of the grid would ultimately be much more expensive, as the effort required to stabilize the grid would continue to rise and renewable power plants would increasingly have to be curtailed, according to the association.
Due to regionally insufficient network capacities, the compulsory shutdown of wind farms in Germany increased by almost 300 percent from 2010 to 2011. According to this, the record value of up to 407 gigawatt hours (GWh) of wind power was lost in 2011, compared with 150 GWh in the previous, particularly weak wind year, 2010. In 2012 the regulated work fell to 385 GWh, which corresponds to approx. 0.71% of the total wind power production fed into the grid. Mainly affected were wind turbines with approx. 93.2%. Compensation amounting to EUR 33.1 million was paid for this. From an economic point of view, a slight curtailment of wind turbines makes sense during seldom power peaks, since the costs of network expansion are significantly lower than with a full feed-in in any network situation. For example, Jarass et al.
“This instruction to a certain restriction of the wind-related network expansion actually only expresses the economic self-evident fact that no expensive additional transmission capacity has to be paid by the electricity customers for the very rare short peaks of wind power that produce little energy. The evaluation of the marginal utility curves shows that if the grid is expanded to the economic optimum, significantly less than 1% of the possible wind energy generation has to be 'locked out', but depending on the individual case, considerable grid expansion costs can be saved. "
At the end of December 2012, the u. a. The 380 kV line from Schwerin to Krümmel, known as the wind busbar , as well as the reinforcement of the southern German electricity bridge between Remptendorf in Thuringia and the Bavarian border with high-temperature cables significantly increased the transmission capacity between the eastern and western German power grids. Previously there were only three east-west coupling lines, which meant that the limited transmission capacity between East and West Germany was a bottleneck in the German power grid. In particular, the southern German power line is still considered to be overloaded, which is why the construction of another Thuringian-Bavarian power line became necessary with the Thuringian power bridge . The commissioning of the first circuit took place at the end of 2015 and is considered to be the main reason for the halving of the costs resulting from power grid congestion in the network area of 50Hertz Transmission in 2016 . From 2015 to 2016, the costs for redispatch measures there fell from 207 to 105 million euros, and the costs of curtailment measures for renewable energies fell from 146 to 73 million euros.
Electricity can also be generated in remote regions and transported over long distances to the consumption centers, for example with offshore wind turbines. The transmission does not take place, as usual, as alternating current, but with lower loss via high-voltage direct current transmission (HVDC). With an operating voltage of 800 kV, such lines result in losses of less than 14% over transport distances of 5,000 km. HVDC systems play a major role in China, where the HVDC line Hami-Zhengzhou, the line with the largest transmission capacity to date (8,000 MW, corresponds to the output of approx. 8-10 large coal-fired power plant blocks) has been implemented.
Intelligent power consumption
The establishment of intelligent power networks, so-called smart grids, plays an important role in the restructuring of the electricity supply . With today's information technology it is possible to temporarily switch off or switch off electricity consumers such as cement mills, cooling and heating systems, so-called “ load shedding customers ”, using demand side management . Regulation via a timely electricity price is being considered, similar to so-called low - tariff electricity (night electricity). The price would be reduced if there was an oversupply of electricity, but increased if there was a lack of electricity. Intelligent electricity consumers (e.g. appropriately equipped washing machines, dishwashers, etc.) switch on when the electricity price is low and off when the electricity price is high. In industry, short-term generation peaks could be temporarily stored and used at a later point in time. Fluctuations in renewable electricity generation can thus be used in the heating sector or in industrial plants and thus smoothed out instead of being exported. Such a synchronization of consumption, stimulated by dynamization of selected electricity price elements, can significantly reduce the need for residual peak load and secured power. In private households, heat pumps can also be used to intelligently link the electricity and heat markets. Both systems with and without additional heat storage are possible.
An expert opinion by the Office for Technology Assessment at the German Bundestag came to the conclusion that the grid integration of green electricity can be technically implemented in the coming years with a large number of flexibility measures. To make electricity generation more flexible, a combination of the individual regenerative energies and quickly switchable combined heat and power systems is essential. Virtual combined-cycle power plants based on renewable energies, together with a control of electricity demand, could provide a significant balance between solar and wind power generation. With the use of temperature monitoring and new types of ladder roping on existing high-voltage pylons, bottlenecks on the high-voltage level can be eliminated quickly, sometimes even without building new lines.
Use of virtual power plants
In order to test whether a larger area can be supplied partially or completely with electricity from renewable energies, there are pilot projects that examine the dynamics and possible uses of so-called combined power plants or virtual power plants . Here, systems from the various renewable energy sectors (water, wind, sun, biogas, etc.) are virtually combined to form a power plant and simulated to cover the precise electricity requirements of a large city, for example. Studies by TU Berlin and BTU Cottbus show that such an intelligent networking of decentralized regenerative power plants can make a significant contribution to optimally integrating large amounts of fluctuating electricity into the supply network. The studies also showed that electricity demand and production in a large city like Berlin can be well coordinated with the help of targeted control. This means that both the higher network level can be relieved and the need for conventional reserve capacities can be significantly reduced. In October 2013, the research project “Combined Power Plant 2”, with a field test and regional simulations, came to the conclusion that grid stability can be guaranteed in a completely renewable and secure power supply.
Energy storage
.jpg)
The greater the share of renewable energies, the greater the importance of storage options in order to adjust the fluctuations in energy generation to fluctuations in energy consumption and thus to create security of supply. In the specialist literature, it is assumed that from a renewable energy share of approx. 40%, additional storage facilities are required to a greater extent; the figure 70% is also mentioned in isolated cases. Long-term storage such as For example, power-to-gas technology is only required from a share of 70–80%. Below 40% renewable energies, compensation through thermal power plants and a slight curtailment of generation peaks from renewable energies represent a more efficient way to compensate. Therefore, additional commercial storage in Germany is considered necessary from 2020 at the earliest.
In its special report on 100% renewable power supply by 2050: climate-friendly, safe, affordable from May 2010, the German Federal Government's Advisory Council for Environmental Issues affirmed that the capacities in pumped storage power plants v. a. in Norway and Sweden are by far sufficient to compensate for fluctuating energy supplies - especially from wind turbines. It should be noted, however, that this requires the construction of high-power lines (colloquially known as electricity highways) to a much greater extent than is currently provided for in the network development plan .
The development of economical storage power plants is in part still at an early stage. The storage options include:
- Pumped storage power plants use electricity to store electricity to pump water uphill. If electricity is needed again, the water flows back down and drives a generator. Pumped storage power plants are currently used as large-scale systems due to their relatively low price. Norway in particular has great potential for expansion, which means that it could play an important role in electricity storage in Europe, provided that suitable low-loss power lines ( HVDCs ) are laid to Europe.
- Accumulators : Accumulators and redox flow cells store electricity electrochemically. The prices are falling sharply, which makes these stores more and more interesting. Potential areas of application are in households, e.g. B. in the form of solar batteries , large-scale battery storage power plants come into question. The first systems are already being used to provide system services at short notice.
- Heat storage : Water is heated with the heat of the sun or water is pumped into warm layers under the earth using excess electricity in order to warm it up naturally. This can be used to heat buildings, which can use heat from day at night or heat from summer in winter, or for time-delayed power generation in solar thermal power plants , which are able to generate electricity 24 hours a day To produce solar energy.
- Power-to-gas : Electrolysis , if necessary supplemented by methanation , can be used to generate hydrogen or methane from temporarily excess electricity , which can later be used to generate electricity or heat if required. The RE gas can be stored in existing underground natural gas storage facilities , the capacity of which would already be sufficient for a full regenerative supply. The efficiency of hydrogen storage is higher than that of methanation. With hydrogen storage, overall electrical efficiencies (electrolysis → storage → reconversion) of 49 to 55% can be achieved. With methanation, the overall efficiency when converting back into electricity in a combined cycle power plant is 39%. If combined heat and power is used in gas production and reconversion , overall efficiencies of over 60% are possible.
- Power-to-Heat : Excess electricity is used directly to generate heat for heating systems or hot water, thus replacing fossil fuels. A conversion back into electrical energy only makes sense under certain conditions.
- Thermodynamic storage: In compressed air storage power plants , air is pressed into caverns. If necessary, the air escapes again, whereby the air pressure drives a generator. In adiabatic compressed air storage power plants, the heat released during compression is temporarily stored in heat storage systems and released again during expansion. An increase in efficiency can thus be achieved.
- Flywheel storage : Flywheel storage can also be used for short-term storage and for system services. Flywheels are driven by a motor to absorb energy. The flywheel is braked again via a generator in order to generate electrical energy. The very high number of cycles is advantageous due to very little wear and tear during operation. The disadvantage, however, is the comparatively high self-discharge, which is why flywheels are used to stabilize power grids and to balance renewable energies over a period of one day.
Network stability
According to the Federal Network Agency, the average interruption time in 2014 for each connected end consumer was 12.28 minutes (for comparison: 21 minutes in 2006). "A significant influence of the energy transition and the increasing decentralized generation capacity on the security of supply is still not discernible," said Jochen Homann, President of the Federal Network Agency.
Situation in individual states
Germany
advancement
In Germany, renewable energies are promoted with various measures:
- The first form of the law for the priority of renewable energies (Renewable Energies Act (EEG)), enacted in 2000, was decisive for the electricity sector.
- Since 2009, the law on the promotion of renewable energies in the heating sector (Renewable Energies Heat Act (EEWG)) has also promoted the provision of heat.
- The Biofuel Quota Act has been in force since 2007, replacing the previously existing tax breaks to promote biofuels .
- The EU directive on renewable energies of April 23, 2009 (2009/28 / EC) requires the member states of the European Union to issue state regulations that promote the use of renewable energies in the areas of electricity, heating and cooling as well as transport so that a total share of these energies in total energy consumption within the EU of 20% is achieved by 2020. For Germany, the national expansion target is 18% of final energy consumption; However, according to expansion forecasts, this target will not be achieved.
In particular with the Electricity Feed Act at the beginning of the 1990s and the EEG that emerged from it, small producers were given the opportunity to feed into the electricity networks of the large energy supply companies and receive increased remuneration. This is often seen as an important factor in reducing the former monopolies or the current dominance of the large RUs and in stimulating competition.
After the large energy companies in Germany invested little or nothing in renewable energies for a long time, a gradual change has been taking place since the mid-2000s. In particular, larger projects such as offshore wind farms , which have been increasingly being implemented since around 2010, are financed by the utility companies.
Share of renewable energies


In 2015, the primary energy consumption covered by renewable energies in Germany was 12.5% of total consumption . Final energy consumption is not yet included in the preliminary data, but is usually higher. Renewable energies accounted for 32.6% of total electricity consumption, 13.2% for heating and cooling and 5.3% of total fuel consumption. In power generation, renewable energies are the most important energy source with a work performed of 195.9 TWh. In 2016, the share of electricity consumption rose to 34%, with a simultaneous export surplus with a record value of 50 TWh.
At the same time, renewable energies made up 35% of the total domestic primary energy generation in 2011 (1,452 PJ), making them the second most important form of domestic energy generation just behind lignite with 38.5% and 1595 PJ. For comparison: hard coal with 8.7% and 360 PJ was still fourth behind natural gas and crude oil gas with 9.2% and 383 PJ of the domestic primary energy sources.
The experience report on the Renewable Energy Heat Act shows that in half of all new buildings built between 2009 and 2011, heat generation systems based on renewable energies were used. Among the decentralized (not linked to the heating network) technologies, heat pumps were used most frequently (in 27 percent of new buildings), followed by solar thermal systems (in around 20 percent of new buildings) and systems for the use of solid biomass, e.g. wood pellet heating (in around 5 to 7 percent of the New buildings). In 2011 around 60 percent of the added heat pumps and around a third of the biomass central heating systems were installed in new buildings. In the case of solar thermal systems, currently only around every seventh system is being built on new buildings.
On New Year's 2018 at around 6 a.m., renewable energies met the entire German electricity demand for the first time. At that time, electricity consumption was a relatively low 41 GW due to the holiday. At that time, 85% of this was covered by wind energy, the rest by hydropower and biomass. The conventional power plants, which could not be switched off in time, worked for the export of electricity.
Up-to-date feed-in data (for Germany) for the years from 2011 onwards are freely accessible on the Internet.
In the first quarter of 2020, renewable energies in Germany covered around 52% for the first time in a quarter, more than 50% of the electricity demand. The extraordinary increase compared to the previous year was mainly due to the very windy and sunny weather, and electricity consumption had also decreased by 1%. February 2020 was particularly windy.
Electricity production in Germany in the 8th week of 2020 (wind power record) according to Fraunhofer ISE:
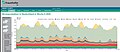
Performance (graphic)

Maximum and minimum benefits

Yield

Yield in numbers


| 1997 | 1998 | 1999 | 2000 | 2001 | 2002 | 2003 | 2004 | 2005 | 2006 | 2007 | 2008 | 2009 | 2010 | 2011 | 2012 | 2013 | 2014 | 2015 | 2016 | 2017 | 2018 | 2019 | ||
|---|---|---|---|---|---|---|---|---|---|---|---|---|---|---|---|---|---|---|---|---|---|---|---|---|
| Share of final energy consumption | 2.8 | 3.2 | 3.4 | 3.7 | 4.0 | 4.4 | 5.8 | 6.3 | 7.2 | 8.1 | 9.7 | 9.1 | 10.1 | 10.9 | 11.8 | 12.8 | 13.2 | 13.6 | 14.7 | 14.9 | 15.9 | 16.5 | 17.5 | |
| of which 1 * | Power generation | 4.1 | 4.5 | 5.2 | 6.2 | 6.6 | 7.7 | 7.6 | 9.3 | 10.2 | 11.6 | 14.2 | 15.1 | 16.3 | 17.0 | 20.4 | 23.7 | 25.2 | 27.4 | 31.5 | 31.6 | 36.0 | 37.8 | 42.1 |
| Heat supply | 3.4 | 3.9 | 4.3 | 4.4 | 4.7 | 4.8 | 7.5 | 7.6 | 8.0 | 8.0 | 9.5 | 8.5 | 10.4 | 11.1 | 11.3 | 11.9 | 12.3 | 12.2 | 13.0 | 13.2 | 13.7 | 14.3 | 14.5 | |
| Fuel consumption | 0.3 | 0.3 | 0.3 | 0.5 | 0.7 | 1.1 | 1.5 | 1.9 | 3.7 | 6.5 | 7.5 | 6.0 | 5.4 | 5.8 | 5.6 | 6.0 | 5.5 | 5.6 | 5.3 | 5.2 | 5.3 | 5.6 | 5.6 | |
| Share of primary energy consumption | 2.4 | 2.6 | 2.8 | 2.9 | 2.9 | 3.2 | 3.8 | 4.5 | 5.3 | 6.3 | 7.9 | 8.0 | 8.9 | 9.9 | 10.8 | 10.3 | 10.8 | 11.3 | 12.4 | 12.5 | 13.2 | 13.8 | 14.8 | |
| 1995 | 2000 | 2004 | 2005 | 2006 | 2007 | 2008 | 2009 | 2010 | 2011 | 2012 | 2013 | 2014 | 2015 | 2016 | 2017 | 2018 | |
|---|---|---|---|---|---|---|---|---|---|---|---|---|---|---|---|---|---|
| Hydropower | 77 | 92 | 72 | 70 | 72 | 76 | 74 | 69 | 75 | 64 | 78 | 83 | 71 | 68 | 74 | 73 | 65 |
| Wind energy | 6th | 35 | 92 | 98 | 111 | 143 | 146 | 139 | 136 | 176 | 182 | 186 | 206 | 285 | 288 | 380 | 402 |
| Photovoltaics | 0.03 | 0.3 | 2.0 | 4.6 | 8.0 | 11.1 | 15.9 | 24 | 42.1 | 69.6 | 95.0 | 111.6 | 129.8 | 139.4 | 137.2 | 141.8 | 166.2 |
| Wood, straw, etc. a. solid substances | 124 | 210 | 311 | 338 | 368 | 388 | 418 | 465 | 532 | 511 | 458 | 525 | 479 | 505 | 510 | 525 | 521 |
| Biodiesel, etc. a. liquid fuels | 2 | 13 | 62 | 110 | 190 | 217 | 195 | 174 | 191 | 168 | 130 | 121 | 125 | 117 | 118 | 118 | 124 |
| Garbage, landfill gas | 45 | 39 | 64 | 88 | 102 | 120 | 102 | 99 | 106 | 110 | 114 | 127 | 131 | 129 | 133 | 138 | 126 |
| Sewage gas including biogas | 14th | 20th | 33 | 43 | 69 | 140 | 165 | 198 | 292 | 321 | 268 | 283 | 308 | 326 | 336 | 339 | 320 |
| Other renewable (1) | 7th | 9 | 15th | 17th | 19th | 22nd | 32 | 35 | 39 | 43 | 60 | 62 | 68 | 74 | 80 | 84 | 91 |
| All in all | 275 | 417 | 650 | 769 | 939 | 1,117 | 1,147 | 1,201 | 1,413 | 1,463 | 1,385 | 1,499 | 1,519 | 1,644 | 1,676 | 1,797 | 1,815 |
| Percentage of primary energy consumption |
1.9 | 2.9 | 4.5 | 5.3 | 6.3 | 7.9 | 8.0 | 8.9 | 9.9 | 10.8 | 10.3 | 10.8 | 11.5 | 12.4 | 12.4 | 13.3 | 13.8 |
(1) Solar, geothermal and heat pumps
|
|||||||||||||||||
| year | Gross electricity consumption |
Total EE | Hydropower | Wind energy | Photovoltaics | Biogas | biogenic fraction of the waste |
Geothermal energy | other (1) | ||||||||||
|---|---|---|---|---|---|---|---|---|---|---|---|---|---|---|---|---|---|---|---|
| on land | at sea | ||||||||||||||||||
| 2019 | 579,800 | 244.293 | 42.1% | 20.192 | 3.5% | 101,270 | 17.5% | 24,705 | 4.3% | 47,517 | 8.2% | 29,203 | 5.0% | 5,783 | 1.0% | 196 | 0.03% | 15,430 | 2.6% |
| 2018 | 594,700 | 224,757 | 37.8% | 17,974 | 2.8% | 90,484 | 15.4% | 19,467 | 3.2% | 46.164 | 7.7% | 28,952 | 4.9% | 6.163 | 1.0% | 178 | 0.03% | 15,660 | 2.6% |
| 2017 | 601,300 | 216,324 | 36.0% | 20,150 | 3.4% | 88,018 | 14.6% | 17,675 | 2.9% | 39,401 | 6.6% | 29,325 | 4.9% | 5,956 | 1.0% | 163 | 0.03% | 15,650 | 2.6% |
| 2016 | 599,900 | 189,671 | 31.6% | 20,546 | 3.4% | 67,650 | 11.3% | 12,274 | 2.0% | 38,098 | 6.4% | 29,271 | 4.9% | 5,930 | 1.0% | 175 | 0.03% | 15,727 | 2.6% |
| 2015 | 600,000 | 188,786 | 31.5% | 18,977 | 3.2% | 72,340 | 12.1% | 8,284 | 1.4% | 38,726 | 6.5% | 28,636 | 4.8% | 5,768 | 1.0% | 133 | 0.02% | 15,922 | 2.7% |
| 2014 | 593,900 | 162,525 | 27.4% | 19,587 | 3.3% | 57.026 | 9.6% | 1,471 | 0.2% | 36,056 | 6.1% | 27,062 | 4.6% | 6,069 | 1.0% | 98 | 0.02% | 15,156 | 2.6% |
| 2013 | 606,500 | 152.338 | 25.1% | 22,998 | 3.8% | 51,819 | 8.5% | 918 | 0.2% | 31,010 | 5.1% | 25,832 | 4.3% | 5,415 | 0.9% | 80 | 0.01% | 14,266 | 2.4% |
| 2012 | 608,700 | 143.043 | 23.5% | 21,755 | 3.6% | 50,948 | 8.4% | 732 | 0.1% | 26,380 | 4.3% | 24,395 | 4.0% | 4,951 | 0.8% | 25th | 0.004% | 13,857 | 2.3% |
| 2011 | 609,500 | 124.037 | 20.4% | 17,671 | 2.9% | 49,280 | 8.1% | 577 | 0.1% | 19,599 | 3.2% | 18,754 | 3.1% | 4,755 | 0.8% | 19th | 0.003% | 13,382 | 2.2% |
| 2010 | 618,300 | 105.181 | 17.0% | 20,953 | 3.4% | 38,371 | 6.2% | 176 | 0.03% | 11,729 | 1.9% | 15,300 | 2.5% | 4,746 | 0.8% | 28 | 0.005% | 13,878 | 2.2% |
| 2009 | 584,300 | 95,939 | 16.4% | 19,031 | 3.3% | 39,382 | 6.7% | 38 | 0.01% | 6,583 | 1.1% | 13,188 | 2.3% | 4,323 | 0.7% | 19th | 0.003% | 13,375 | 2.3% |
| 2008 | 621,500 | 94,280 | 15.2% | 20,443 | 3.3% | 41,385 | 6.7% | 0 | 0.0% | 4,420 | 0.7% | 10,957 | 1.8% | 4,671 | 0.8% | 18th | 0.003% | 12,386 | 2.0% |
| 2007 | 624,800 | 89,368 | 14.3% | 21,170 | 3.4% | 40.507 | 6.5% | 0 | 0.0% | 3,075 | 0.5% | 8,386 | 1.3% | 4,521 | 0.7% | 0.4 | 0.0001% | 11,709 | 1.9% |
| 2006 | 623,300 | 72.509 | 11.6% | 20,031 | 3.2% | 31,324 | 5.0% | 0 | 0.0% | 2,220 | 0.4% | 3,346 | 0.5% | 3,901 | 0.4% | 0.4 | 0.0001% | 11,687 | 1.9% |
| 2005 | 618,500 | 63,400 | 10.3% | 19,638 | 3.2% | 27,774 | 4.5% | 0 | 0.0% | 1,282 | 0.2% | 1,696 | 0.3% | 3,252 | 0.5% | 0.2 | 0.00003% | 9,758 | 1.6% |
| 2004 | 616.100 | 57,957 | 9.4% | 20,745 | 3.4% | 26,019 | 4.2% | 0 | 0.0% | 557 | 0.1% | 1,111 | 0.2% | 2,253 | 0.4% | 0.2 | 0.00003% | 7,272 | 1.2% |
| 2003 | 606,600 | 46,670 | 7.7% | 18,322 | 3.0% | 19,087 | 3.1% | 0 | 0.0% | 313 | 0.1% | 1,518 | 0.3% | 2,238 | 0.4% | 0 | 0.0% | 5,192 | 0.9% |
| 2002 | 592,700 | 45,436 | 7.7% | 23,124 | 3.9% | 16.102 | 2.7% | 0 | 0.0% | 162 | 0.03% | 1,046 | 0.2% | 1,949 | 0.3% | 0 | 0.0% | 3,053 | 0.5% |
| 2001 | 589,000 | 38,742 | 6.6% | 22,733 | 4.0% | 10,719 | 1.8% | 0 | 0.0% | 76 | 0.01% | 745 | 0.1% | 1,859 | 0.3% | 0 | 0.0% | 2,610 | 0.4% |
| 2000 | 578.100 | 36,226 | 6.3% | 21,732 | 3.8% | 9,703 | 1.7% | 0 | 0.0% | 60 | 0.01% | 445 | 0.1% | 1,844 | 0.3% | 0 | 0.0% | 2,442 | 0.4% |
| 1999 | 557.200 | 28,901 | 5.2% | 19,647 | 3.5% | 5,639 | 1.0% | 0 | 0.0% | 30th | 0.01% | 145 | 0.03% | 1,740 | 0.3% | 0 | 0.0% | 1,700 | 0.3% |
| 1998 | 555,300 | 25,086 | 4.5% | 17,216 | 3.1% | 4,579 | 0.8% | 0 | 0.0% | 35 | 0.01% | 118 | 0.02% | 1,618 | 0.3% | 0 | 0.0% | 1,520 | 0.3% |
| 1997 | 547,600 | 22,673 | 4.1% | 17,357 | 3.4% | 3,025 | 0.6% | 0 | 0.0% | 18th | 0.003% | 44 | 0.01% | 1,397 | 0.3% | 0 | 0.0% | 832 | 0.2% |
| 1996 | 550,400 | 26,140 | 4.7% | 21,957 | 4.0% | 2,073 | 0.4% | 0 | 0.0% | 12 | 0.002% | 31 | 0.01% | 1,343 | 0.2% | 0 | 0.0% | 724 | 0.1% |
| 1995 | 541,800 | 25,327 | 4.7% | 21,780 | 4.0% | 1,530 | 0.3% | 0 | 0.0% | 7th | 0.001% | 18th | 0.003% | 1,348 | 0.2% | 0 | 0.0% | 644 | 0.1% |
| 1994 | 531.100 | 22,739 | 4.3% | 19,930 | 3.8% | 927 | 0.2% | 0 | 0.0% | 7th | 0.001% | 6th | 0.001% | 1.306 | 0.2% | 0 | 0.0% | 563 | 0.1% |
| 1993 | 526,600 | 20,128 | 3.8% | 17,878 | 3.4% | 612 | 0.1% | 0 | 0.0% | 3 | 0.001% | 4th | 0.001% | 1,203 | 0.2% | 0 | 0.0% | 428 | 0.1% |
| 1992 | 531,600 | 19,240 | 3.6% | 17,397 | 3.3% | 281 | 0.1% | 0 | 0.0% | 4th | 0.001% | 3 | 0.001% | 1,262 | 0.2% | 0 | 0.0% | 293 | 0.06% |
| 1991 | 538,700 | 16,465 | 3.1% | 14,891 | 2.8% | 102 | 0.02% | 0 | 0.0% | 1 | 0.0002% | 2 | 0.0004% | 1,211 | 0.2% | 0 | 0.0% | 258 | 0.05% |
| 1990 | 549,900 | 18,934 | 3.4% | 17,426 | 3.2% | 72 | 0.01% | 0 | 0.0% | 1 | 0.0002% | 1 | 0.0002% | 1,213 | 0.2% | 0 | 0.0% | 221 | 0.04% |
(1) Sewage gas, landfill gas, biomethane, biogenic solid fuels, sewage sludge, biogenic liquid fuels
|
|||||||||||||||||||
Ownership structure
In Germany there are more than five million plants for renewable electricity and heat generation (status: end of 2014). In relation to the installed capacity, around 40% of renewable energy systems in Germany were owned directly by private individuals in 2010, a further 11% owned by farmers, 14.4% owned by project planners, and 11% owned by Banks and funds, 6.5% owned by the large electricity companies E.ON , RWE , EnBW and Vattenfall (more than three quarters of which are hydropower) and 1.6% owned by regional suppliers. In the photovoltaic and onshore wind energy sectors, private individuals are traditionally the most important investors with 39.3% and 51.5% respectively. This is proven by the market research institute trend: research and the Klaus Novy Institute in a study commissioned by the Federal Environment Ministry. The reasons for the wide distribution in the ownership structure are therefore the good availability and manageability of renewable energy technologies for private individuals and smaller commercial and industrial companies.
The proportion of citizens in renewable energy systems is almost four times the proportion of the four big energy suppliers. Citizens operate 47% of the total output from renewable energies, almost half of the installed bio and solar energy and more than half of the installed wind energy (status: end of 2012), according to a study by the Bremen market research institute trend: research and the Leuphana University of Lüneburg. The big four energy suppliers, on the other hand, own only 12 percent of the plants for generating renewable energy.
According to the market research institute trend: research, more than 80% of all biogas systems and 21% of all solar systems are owned by farmers. They also benefit from the leasing of agricultural land for further plants. The Federal Association of Energy and Water Management (BDEW) therefore estimates that around a third of the EEG surcharge goes to farmers: in 2012 that was six to seven billion euros.
| owner | Share of installed capacity in 2010 |
Share of installed capacity in 2012 |
|---|---|---|
| Private individuals | 39.7% | 35% |
| Project planner | 14.4% | 14% |
| Banks and funds | 11.0% | 13% |
| Farmers | 10.8% | 11% |
| Business | 9.3% | 14% |
| Electricity companies (E.ON, RWE, EnBW, Vattenfall) | 6.5% | 5% |
| Regional producers | 1.6% | 7% |
| Others | 6.7% | 1 % |
acceptance
In Germany there is a broad consensus among the population that renewable energies should play the leading role in a future energy system. A clear majority of the population in Germany is in favor of renewable energies, as surveys regularly show. Approval is particularly high among young people.
Compared to other major projects, approval for the expansion of renewable energies is very high. So determined z. B. A representative survey by Allensbach for the expansion of renewable energies an approval of 85%, which was even higher than the approval of the construction of new hospitals and represented the highest value of the requested infrastructure projects. By contrast, 74% of the population rejected the construction of coal-fired power plants. Most recently, a survey by TNS Emnid in September 2013 confirmed that 93% of Germans consider the expansion of renewable energies to be “important” or “very important”. A survey published by Kantar Emnid on behalf of the Renewable Energy Agency in August 2017 yielded an even higher level of approval . 95% of those surveyed rated the expansion of renewables as important to extremely important. The latest nature awareness study also shows that respondents with high educational qualifications consider the energy transition to be the right one more than average.
In the context of the debate about the reform of the Renewable Energy Sources Act, the Politbarometer determined in 2014 that 57% of Germans would like a faster expansion of renewable energies, 23% were satisfied with the rate of expansion, and 14% would like a slower expansion. In advance, 55% of Germans believed that the reduction in subsidies for new systems aimed at with the 2014 EEG amendment was wrong and 38% right. At the same time, TNS Emnid determined that 92% of Germans consider the increased expansion of renewable energies to be “important” to “extremely important”.
Acceptance of the costs: According to TNS Emnid (2014), 55% of Germans consider the EEG surcharge of 6.24 ct / kWh to be appropriate, 36% to be too high and 4% to be too low. According to Infratest dimap (2012) on behalf of Greenpeace Energy , 80% of German citizens are in favor of the Renewable Energy Sources Act (EEG), but 51% think the EEG surcharge is too high. A majority of citizens also advocate a fairer distribution of the costs of promoting renewable energies and oppose privileges for industrial customers. Almost half of the respondents consider an exemption for small and medium-sized companies to be sensible.
Approval of renewable energy in the neighborhood: In a Forsa survey carried out on behalf of the Renewable Energy Agency in January 2010, approval for renewable energy systems was significantly higher in places where such systems were already in place than in places where they were not was the case. For example, while the German average 55% of people were in favor of wind turbines in their immediate vicinity, this proportion was significantly higher at 74% where such systems were already in place. This correlation was also shown to be much more pronounced in the case of conventional power plants, with their acceptance value on average being almost half as high as in the case of renewable plants. This result was confirmed in principle in a further survey by TNS Infratest on behalf of the Renewable Energy Agency in July 2011, but with slightly lower approval ratings for renewable energy systems.
The higher approval rate where renewable energy systems, v. a. Wind turbines do exist and have now also been observed in a number of scientific studies. Accordingly, approval often increases the closer you get to the facilities; In addition, studies suggest that although support decreases somewhat during the construction phase, approval increases after the systems are commissioned.
Approval by federal state: A representative Forsa survey commissioned by the Renewable Energy Agency on the acceptance of renewable energies confirmed the high level of social approval for regenerative energy generation in each individual state and demonstrated an increasing support for renewable energies. According to this, people in southern Germany in particular want more renewable energy systems in their region, especially wind turbines in their own neighborhood. The majority of those questioned expect their state and local politicians to be more committed to renewable energies. Nationwide, 95% of Germans consider the expansion of renewable energies to be important or very important. 78% would prefer to get their electricity from renewable energy sources (compared to 9% from natural gas, 6% from nuclear power, 3% from coal). Regional surveys, for example in Brandenburg and Hesse, also showed high approval ratings.
France
In July 2015, it was decided in France to provide state financing options for renewable energies. Offshore wind farms and electric cars, for example, are to be funded with a total of 400 million euros. The French government is aiming for 40 percent of electricity to come from renewable sources by 2030 and for energy consumption to halve by 2050.
Austria
Share of renewable energies in total energy consumption
| 2001 | 2002 | 2003 | 2004 | 2005 | 2006 | 2007 | 2008 | 2009 | 2010 | 2011 | 2012 | 2013 | |
|---|---|---|---|---|---|---|---|---|---|---|---|---|---|
| Percentage of total energy consumption |
22.7 | 21.7 | 21.0 | 20.0 | 23.0 | 28.0 | 30.1 | 30.8 | 32.0 | 32.5 | |||
| Source: Austrian Ministry of the Environment | |||||||||||||
After initial stagnation at the beginning of the new millennium, the share of renewable energies in Austrian gross inland consumption increased from 20 to 30.8% between 2005 and 2010. The EU target is 34% for 2020. According to a study presented by Environment Minister Berlakovich in January 2011, Austria could become energy self-sufficient by 2050 if the framework conditions are appropriate and generate all of the energy required in Austria from water, sun, wind and biomass. According to the study, however, the political framework would have to be created today.
Share of renewable energies in electricity generation

After a decline of several years in the area of green electricity systems, the relative green electricity share in Austria has been increasing since 2010. Together with the absolute electricity generation from green electricity systems (from 37 TWh in 1997 to 72.4 TWh in 2012), the relative share of green electricity systems in total electricity consumption rose (from 66% in 1997 to 72.9% in 2012, after reaching a low point of 61% in 2010) would have). The targets set by the EU in Directive 2001/77 / EC for Austria for the share of renewable energies in (gross) electricity consumption of 78.1% for 2010 were thus clearly missed. Austria was therefore threatened with infringement proceedings , which were filed on November 20, 2013.
Due to the steadily increasing energy consumption and the limited capacities (the large rivers are already covered with power plants) the still paramount importance of hydropower is tending to decrease, while that of biomass and wind energy is increasing. In some sample projects, it has been possible to cover the energy consumption required at one location with renewable energies in a decentralized manner. For example, the Austrian municipality of Güssing has been generating significantly more heat and electricity from renewable raw materials than it needs itself since 2005.
| year | Total generation |
Total EE | Hydropower | Wind energy | Biomass and gas |
Photovoltaics | Geothermal energy | |||||
|---|---|---|---|---|---|---|---|---|---|---|---|---|
| 2018 | 67,511 | 47,711 | 70.7% | 37,697 | 55.8% | 5,895 | 8.7% | 3,499 | 5.2% | 620 | 0.9% | 0 |
| 2017 | 70.120 | 49,068 | 70.0% | 40.165 | 57.3% | 6,523 | 9.3% | 2,565 | 3.7% | 574 | 0.8% | 0 |
| 2016 | 67,881 | 53,372 | 78.6% | 42,906 | 63.2% | 5,231 | 7.7% | 4,566 | 6.7% | 669 | 1.0% | 0 |
| 2015 | 64,947 | 51,072 | 78.6% | 40,488 | 62.3% | 4,836 | 7.4% | 5.163 | 7.9% | 585 | 0.9% | 0 |
| 2014 | 65.134 | 54,125 | 83.1% | 44,730 | 68.7% | 3,845 | 5.9% | 5,069 | 7.8% | 480 | 0.7% | 0 |
| 2013 | 68.015 | 53,773 | 79.1% | 45,698 | 67.2% | 3,150 | 4.6% | 4,630 | 6.8% | 295 | 0.4% | 0 |
| 2012 | 72.403 | 54,805 | 75.7% | 47,570 | 65.7% | 2,461 | 3.4% | 4,649 | 6.4% | 124 | 0.2% | 1 |
| 2011 | 65,854 | 44,286 | 67.2% | 37,745 | 57.3% | 1.934 | 2.9% | 4,556 | 6.9% | 49 | 0.1% | 1 |
| 2010 | 71,070 | 48,188 | 67.8% | 41,575 | 58.5% | 2,063 | 2.9% | 4,517 | 6.3% | 31 | 0.0% | 1 |
| 2009 | 68,827 | 43,778 | 63.6% | 39,318 | 57.3% | 1.915 | 2.8% | 2,522 | 3.7% | 21st | 0.0% | 2 |
| 2008 | 66,841 | 45.186 | 67.6% | 40,690 | 60.9% | 1,988 | 3.1% | 2,489 | 3.9% | 17th | 0.0% | 2 |
| 2007 | 64,754 | 43,401 | 67.0% | 39,171 | 60.5% | 2,019 | 3.2% | 2,194 | 3.4% | 15th | 0.0% | 2 |
| 2006 | 63,919 | 42,344 | 66.2% | 37,278 | 58.3% | 1,752 | 2.7% | 3,300 | 5.2% | 12 | 0.0% | 3 |
| 2005 | 66,479 | 42,911 | 64.5% | 39,019 | 58.7% | 1,331 | 2.0% | 2,545 | 3.8% | 13 | 0.0% | 2 |
| 2004 | 64,739 | 42,457 | 65.6% | 39,462 | 61.0% | 926 | 1.4% | 2,053 | 3.2% | 13 | 0.0% | 2 |
| 2003 | 60.219 | 37,467 | 62.2% | 35,292 | 58.6% | 366 | 0.6% | 1,794 | 3.0% | 11 | 0.0% | 3 |
| 2002 | 62,671 | 43,767 | 69.8% | 42,057 | 67.1% | 203 | 0.3% | 1,500 | 2.4% | 3 | 0.0% | 3 |
acceptance
In Austria there is high approval for the expansion of renewable energies. In a survey published in October 2011 by Karmasin Marktforschung on behalf of IG Windkraft , 77% of Austrians were in favor of expanding wind energy, which confirms similar values from previous years. In Lower Austria , where as of 2011 around half of all Austrian wind turbines are located, 13% of those surveyed see positive effects from the existing systems on their personal quality of life, 3% see negative effects. 28% expect an improved quality of life from further expansion, 62% no impact on it, 6% negative impact. Nuclear power plants were rejected by 96% of the respondents, fossil power plants by 45%. Seven out of ten Austrians also spoke out in favor of greater funding for renewable energies.
Switzerland
Share of electricity generation
Hydropower has been used intensively in Switzerland for decades due to its beneficial natural foundations. The Swiss pumped storage power plants import inexpensive electricity to pump water up into the reservoirs and to refine it at high prices. A large part of this electricity comes from non-renewable energy sources. Pumped storage power plants are not declared as renewable energies per se . The cost-covering feed-in tariff (KEV) for all renewable energy sources was introduced in 2009.
| year | Land production |
Hydropower | Wind energy | Wood | Biogas | Photovoltaics | |||||
|---|---|---|---|---|---|---|---|---|---|---|---|
| 2018 | 67,558 | 37,428 | 55.4% | 122 | 0.21% | 290 | 0.43% | 352 | 0.52% | 1,944 | 2.88% |
| 2017 | 61,487 | 36,666 | 59.6% | 133 | 0.22% | 322 | 0.52% | 334 | 0.54% | 1,683 | 2.74% |
| 2016 | 61,616 | 36,326 | 59.0% | 109 | 0.18% | 223 | 0.36% | 320 | 0.52% | 1,333 | 2.16% |
| 2015 | 65,957 | 39,486 | 59.9% | 110 | 0.17% | 184 | 0.29% | 303 | 0.46% | 1,119 | 1.69% |
| 2014 | 69,633 | 39,308 | 56.5% | 101 | 0.15% | 273 | 0.39% | 292 | 0.42% | 842 | 1.21% |
| 2013 | 68,312 | 39,572 | 57.9% | 90 | 0.14% | 278 | 0.41% | 281 | 0.41% | 500 | 0.73% |
| 2012 | 68.019 | 39.906 | 58.7% | 88 | 0.13% | 251 | 0.37% | 262 | 0.39% | 299 | 0.44% |
| 2011 | 62,881 | 33,795 | 53.7% | 70 | 0.11% | 193 | 0.31% | 230 | 0.37% | 168 | 0.27% |
| 2010 | 66,252 | 37,450 | 56.5% | 37 | 0.06% | 137 | 0.21% | 210 | 0.32% | 94 | 0.14% |
| 2009 | 66,494 | 37,136 | 55.8% | 23 | 154 | 191 | 54 | ||||
| 2008 | 66,967 | 37,559 | 56.1% | 19th | 131 | 179 | 37 | ||||
| 2007 | 65,916 | 36,373 | 55.2% | 16 | 92 | 193 | 29 | ||||
| 2006 | 62.141 | 32,557 | 52.4% | 15th | 44 | 155 | 24 | ||||
| 2005 | 57 918 | 32,759 | 56.6% | 8th | 33 | 146 | 21st | ||||
| 2000 | 65,348 | 37,851 | 57.9% | 3 | 14th | 149 | 11 | ||||
| 1990 | 54,074 | 30,675 | 56.8% | 0 | 6th | 80 | 1 | ||||
acceptance
In Switzerland , 78% of the residents of wind farms support the use of wind energy, 6% reject it. Over a third of the opponents (36%) are personally against the use of wind power (for example in a citizens' initiative or with letters of protest), while only 6% of the supporters actively fight for its use. As the population is better involved in the planning phase, approval increases. 76% of the residents do not feel at all or only slightly disturbed by the wind energy, 18% moderate to strong, but without developing symptoms of stress. 6% said they suffered from symptoms of stress. The consent to the use of wind energy was greater among the residents of wind farms than in places with potential locations, but in which no wind power plants have yet been installed. The Energy Strategy 2050 was adopted in a referendum on May 21, 2017 .
United States
In 2013, net electricity generation in the USA was 4,058 TWh, of which 269 TWh came from hydropower and 253 TWh from other renewable sources. Overall, the share of renewable energies in electricity generation was 12.9%. At the same time, the USA was the largest investor among the industrialized nations, with investments totaling 35.8 billion US dollars.
The United States has both state and federal subsidy programs for renewable energy. Significant is u. a. the state-granted Production Tax Credit , as a result of which a wind power capacity of approx. 61 GW was built up by the end of 2013, which means that the USA has the most important wind energy market in the world after China. California is considered a pioneer , where an early wind energy boom set in as early as the 1980s, driven by state ( National Energy Act ) and federal subsidy policies as a result of the oil crises . Even before the first oil crisis in 1973, an energy crisis was perceived and alternatives were discussed. The reasons for this were the incipient exhaustion of Texan oil and gas reserves as well as the environmental problems of the conventional energy industry, to which an increasingly critical public drew attention. A study commissioned by President Richard Nixon in 1973 suggested significant energy savings , the expansion of nuclear energy and the maximum possible use of renewable energies.
The so-called California Solar Initiative exists in the state of California until 2016 under the supervision and administration of the California Public Utilities Commission as an incentive program for the promotion of solar energy . This will provide $ 2.167 billion in the years 2007 to 2016 for this purpose. This is intended to create an additional capacity of 1,940 megawatts of solar power. The supplementary program CSI-Thermal should lead to the new installation of 200,000 solar thermal systems with 250 million dollars between 2010 and 2017 .
China
Since the mid-2000s, China has been investing heavily in the expansion of low-carbon technologies, including renewable energies in particular. The state is currently the world market leader in the manufacture and use of wind turbines, solar cells and smart grid technologies. The country is currently both the largest investor in renewable energies and the largest producer of green electricity. In contrast to most countries in the world, renewable energies in China are seen not only as a goal of reducing greenhouse gas emissions, but as a means of ensuring security of supply. From 2000 to 2013, the share of renewable energies in energy consumption ( which has risen sharply as a result of the high economic growth ) increased from 5.6 to 9.6%; At the same time, investments in renewable energies exceeded investments in conventional power plants for the first time. By 2017, the installed capacity of green electricity systems is to increase by 48% to 550 GW. In 2013 a total of 5,322 TWh of electrical energy was produced. 74% of this came from coal-fired power plants, 17% of the electricity came from hydropower plants, 2.6% from wind power plants and 2.1% from nuclear power plants. The total renewable energies were around 20%.
At the end of 2013, wind turbines with a total of 91.4 GW were installed, putting China clearly ahead of the USA with 61.1 GW and Germany with 34.2 GW and thus owning around 30% of the total wind energy capacity . The expansion in 2013 was 16.1 GW, making China around 45% of the global wind energy market. While the first attempts at a niche function in the 1980s did not come out, China has been the frontrunner in global expansion since 2009. This was accompanied by the development of its own wind industry, which is now also gaining shares in African and South American markets.
The expansion of photovoltaics is now being pushed ahead, after initially only one industry was built up from the end of the 2000s. In 2013, China invested more in renewable energies than in coal for the first time, adding more than 12 GW of photovoltaic capacity - more than any country has ever invested in this sector. China has thus doubled its photovoltaic capacities and is planning to add another 14 GW annually. A total of around 57 GW of regenerative generation capacity was installed in China in 2013 (for comparison: coal: 39.7 GW). The Chinese government is strongly promoting the expansion of photovoltaics. The Chinese National Energy Agency recently increased its expansion targets by 30% and in 2015 installed more photovoltaic power per capita (16.3 W) than Germany's record holder. At the same time, the expansion of the power grid is being driven forward, research on smart grid technologies in particular and their market introduction being supported with pilot projects.
India
In 2015, the Indian government announced that it wanted to achieve 40 percent of installed energy output from non-fossil fuels by 2030. This means a four-fold increase compared to the current level.
See also
- energy transition
- Energy transition by country
- Climate change
- Federal Association for Renewable Energy (BEE)
- The 4th Revolution - Energy Autonomy
- Research association for renewable energies
- Green electricity label eco label
- International Renewable Energy Organization (IRENA)
- Masdar
- Sustainable development
- Renewable raw material
- Gross electricity generation by energy source in Germany
- Tables Electricity: Renewable Energies
-
Åland relies on renewable energies: the green electricity archipelago. In: Deutschlandfunk (DLF) . April 14, 2020.
- MP3 version of the report; 19 minutes. In: dradio.de. April 14, 2020, archived from the original on April 15, 2020 .
literature
Books
- Nicola Armaroli , Vincenzo Balzani : Energy for a Sustainable World - From the Oil Age to a Sun-Powered Future. Wiley-VCH, Weinheim 2011, ISBN 978-3-527-32540-5 .
- Günther Brauner: Energy systems: regenerative and decentralized. Strategies for the energy transition. Wiesbaden 2016, ISBN 978-3-658-12754-1 .
- Elke Bruns, Dörte Ohlhorst, Bernd Wenzel, Johann Köppel: Renewable Energies in Germany - A Biography of Innovation, University Press of the TU Berlin, Berlin 2010, ISBN 978-3-7983-2201-1 ( full text ).
- Thomas Bührke , Roland Wengenmayr : Renewable Energy - Alternative Energy Concepts for the Future. 3. Edition. Wiley-VCH, Weinheim 2012, ISBN 978-3-527-41108-5 .
- Matthias Günther: Energy efficiency through renewable energies. Possibilities, potentials, systems. Wiesbaden 2015, ISBN 978-3-658-06753-3 .
- Martin Kaltschmitt , Wolfgang Streicher, Andreas Wiese (eds.): Renewable energies. System technology, economy, environmental aspects. Springer Vieweg, Berlin / Heidelberg 2013, ISBN 978-3-642-03248-6 .
- Martin Kaltschmitt, Wolfgang Streicher (ed.): Renewable energies in Austria. Basics, system technology, environmental aspects, cost analyzes, potentials, use. Wiesbaden 2009, ISBN 978-3-8348-0839-4 .
- Amory Lovins : Soft Energy Paths: Towards a Durable Peace. 1977, ISBN 0-06-090653-7 . German: Soft energy: the program for the energy and industrial policy conversion of our society. 1978.
- Henrik Lund : Renewable Energy Systems: A Smart Energy Systems Approach to the Choice and Modeling of 100% Renewable Solutions. Academic Press 2014, ISBN 978-0-12-410423-5 .
- David JC MacKay : Sustainable Energy - Without the Hot Air. UIT, Cambridge 2008, ISBN 978-1-906860-01-1 ( withouthotair.com ).
- Volker Quaschning : Renewable energies and climate protection. 4th edition. Hanser, Munich 2018, ISBN 978-3-446-45703-4 .
- Volker Quaschning: Regenerative Energy Systems. 9th edition. Hanser, Munich 2015, ISBN 978-3-446-44267-2 .
- Holger Rogall : 100% supply with renewable energies. Conditions for global, national and local implementation. Marburg 2014, ISBN 978-3-7316-1090-8 .
- Thomas Schabbach , Viktor Wesselak : Energy. The future will be renewable. Springer Vieweg, Berlin / Heidelberg 2012, ISBN 978-3-642-24346-2 .
- Hermann Scheer : The energy ethical imperative. How to implement the complete switch to renewable energies. Kunstmann, Munich 2010, ISBN 978-3-88897-683-4 .
- Viktor Wesselak , Thomas Schabbach , Thomas Link, Joachim Fischer: Handbuch Regenerative Energietechnik. 3rd, updated and expanded edition, Berlin / Heidelberg 2017, ISBN 978-3-662-53072-6 .
Essays and Studies
- Energy Revolution: A sustainable world energy outlook . (PDF; 11.8 MB) German Aerospace Center (DLR) 2012, short version in German (PDF)
- Long-term scenarios and strategies for the expansion of renewable energies in Germany, taking into account developments in Europe and globally . (PDF; 8.5 MB) Study by DLR, Fraunhofer ISE and IfnE for the BMU
- Energy concept 2050. A vision for a sustainable energy concept based on energy efficiency and 100% renewable energies (PDF; 4.4 MB) Study by the Renewable Energies Research Association on the German government's 2010 energy concept
- Fraunhofer Institute for Solar Energy Systems ISE: Electricity generation costs of renewable energies (PDF) As of November 2013.
- Impacts of Green New Deal Energy Plans on Grid Stability, Costs, Jobs, Health, and Climate in 143 Countries Jacobson et al., Cell Press, One Earth, December 2019
- IRENA: Reports and Papers on the Global Status of Renewable Energies and Annual Report 2014–2015: At Glance (PDF)
- Acceptance survey 2013: Renewable energy transition is still very popular with Germans. September 18, 2013 (PDF) Renews Compact; Compilation of various surveys on energy policy
- Compass study market design - guiding ideas for a design of an electricity system with a high proportion of fluctuating renewable energies. Federal Association for Renewable Energy and Greenpeace Energy , 2012
- Renewable energies - an asset for Germany as a business location. (PDF) Agency for Renewable Energies, Berlin 2014
- Study: The new world of electricity. 100% renewable power system scenario (2015)
Political guidelines
- Jean-Claude Juncker : A New Start for Europe: My Agenda for Jobs, Growth, Fairness and Democratic Change . (PDF) In: Political guidelines for the next European Commission . Strasbourg July 2014.
Web links
| Renewable energy |
|---|
- Information portal for renewable energies - information site of the Federal Ministry for Economic Affairs and Energy about renewable energies (Germany)
- Renewable energies - Information from the Federal Office of Energy (Switzerland)
- federally renewable - graphics and information on the implementation of the energy transition in the German federal states
- Municipal Renewable - Information on renewable energies in German municipalities
- Agency for Renewable Energies , u. a. with the brochure Renewable Energies 2020 - Potential Atlas Germany (PDF; 7.2 MB), various themed brochures and graphics
- Political science literature on the topic of renewable energies in the annotated bibliography of political science
- Renewable energy sources to secure the base load in the power supply (PDF) TAB 2013
- Energy Atlas 2018 - data and facts about renewables in Europe . Cooperation project between Heinrich Böll Foundation , Green European Foundation , European Renewable Energies Federation and Le Monde diplomatique , April 2018 (PDF)
Individual evidence
- ↑ a b Volker Quaschning : Regenerative Energy Systems. Technology - calculation - simulation . 8th updated edition. Munich 2013, p. 34.
- ↑ Anette Regelous, Jan-Peter Meyn: Renewable energies - a physical consideration. In: Didactics of Physics , Spring Conference. Retrieved August 23, 2014 . Münster 2011, Institute of Physics, Didactics of Physics, FAU Erlangen-Nürnberg , Erlangen
- ↑ About Us. In: Sustainable Energy For All. United Nations, June 19, 2012.
- ↑ International Organization for Renewable Energies : Definition according to Article III of the statutes of January 26, 2009 ( Federal Law Gazette II p. 634, 635 , bilingual).
- ↑ Martin Kaltschmitt , Wolfgang Streicher, Andreas Wiese (ed.): Renewable energies. System technology, economy, environmental aspects . Berlin / Heidelberg 2006, p. 4.
- ↑ a b Renewables 2019 Global Status Report. (PDF; 14.8 MB) REN21 , pp. 31–32 , accessed on July 10, 2019 (English).
- ↑ Valentin Crastan : Electrical energy supply 2 . Berlin / Heidelberg 2012, p. 192.
- ^ Benjamin Biegel, Lars Henrik Hansen, Jakob Stoustrup, Palle Andersen, Silas Harbo: Value of flexible consumption in the electricity markets . In: Energy . 66, 2014, pp. 354-362, doi: 10.1016 / j.energy.2013.12.041 .
- ↑ Renewables 2019 Global Status Report. Retrieved July 5, 2019 .
- ↑ Viktor Wesselak , Thomas Schabbach , Thomas Link, Joachim Fischer: Handbuch Regenerative Energietechnik , Berlin / Heidelberg 2017, p. 6.
- ↑ a b c Complete edition of the energy data - data collection of the BMWi. (XLS; 2.0 MB) Federal Ministry for Economic Affairs and Energy , January 16, 2019, accessed on April 22, 2019 .
- ↑ a b c d e f g h ( page no longer available , search in web archives: Global Status Report 2014 ) (PDF) Internet site of REN21 . Retrieved August 8, 2014.
- ^ A b c d John A. Mathews, Hao Tan: Manufacture renewables to build energy security . In: Nature . 513, Issue 7517, September 10, 2014, pp. 166–168, doi: 10.1038 / 513166a .
- ↑ Valentin Crastan : Electrical energy supply 2 . Berlin / Heidelberg 2012, p. 12.
- ↑ Data from the German Aerospace Center (DLR) 2005
- ↑ Valentin Crastan : Electrical energy supply 2 . Berlin / Heidelberg 2012, p. 13.
- ↑ Volker Quaschning : Regenerative Energy Systems. Technology - calculation - simulation . 8th updated edition. Munich 2013, p. 53.
- ↑ World Energy Outlook 2014
- ↑ Summary for Policymakers 2011 ( Memento of September 22, 2014 in the Internet Archive ) (PDF) IPCC website . Retrieved September 4, 2014.
- ^ Mark Z. Jacobson, Mark A. DeLucchi: A Plan to Power 100 Percent of the Planet with Renewables . In: Scientific American , November 2009; accessed on September 10, 2014.
- ↑ Werner Zittel, Ludwig-Bölkow-Systemtechnik: Estimation of the annual worldwide expenditure on energy supply, Berlin, March 9th 2010 (PDF; 12 kB)
- ↑ Volker Quaschning : Regenerative Energy Systems. Technology - calculation - simulation . 8th updated edition. Munich 2013, p. 65.
- ↑ Potential of wind energy on land (PDF) Website of the Federal Environment Agency. Retrieved September 4, 2014.
- ↑ a b Volker Quaschning : Regenerative Energy Systems. Technology - calculation - simulation . 8th updated edition. Munich 2013, p. 49.
- ↑ Lead Study 2008 - Further Development of the Renewable Energies Expansion Strategy ( Memento of October 16, 2013 in the Internet Archive ) (PDF; 2.7 MB). Federal Ministry for the Environment, Nature Conservation and Nuclear Safety, October 2008.
- ↑ Energy transition: Share of green electricity rises to a record high . In: Spiegel-Online . July 29, 2014. Retrieved August 10, 2014.
- ↑ Gross electricity generation in Germany destatis.de. Retrieved January 13, 2020.
- ↑ The next phase of the energy transition can begin. Retrieved August 18, 2017 .
- ↑ Renewable Energies Potential Atlas (PDF) Renewable Energies Agency; accessed on September 10, 2014.
- ↑ 100% renewable power supply by 2050: climate-friendly, safe, affordable . ( Memento from 7 July 2012 in the Internet Archive ) (PDF; 3.4 MB) Statement by the Advisory Council on Environmental Issues . Retrieved December 9, 2012.
- ↑ 100% renewable energies in Germany for electricity and heat (PDF) Fraunhofer ISE ; accessed on August 10, 2014.
- ^ REN21 : Annual Reports .
- ↑ Alois Schaffarczyk (Ed.): Introduction to wind energy technology . Munich 2012, p. 83.
- ↑ Alois Schaffarczyk (Ed.): Introduction to wind energy technology . Munich 2012, p. 84.
- ↑ IRENA: Report on the electricity generation costs for renewable energies 2012 (English).
- ↑ Renewable Energy Midterm Market Report 2014. Executive Summary (PDF) Internet site of the International Energy Agency . Retrieved August 31, 2014.
- ↑ IRENA: REthinking Energy 2017 (PDF)
- ^ Germanwatch : Evidence for a turnaround in international climate and energy policy. Bonn 2015, [PDF archived copy ( Memento from March 8, 2016 in the Internet Archive )]
- ↑ IRENA Annual Report 2017 (PDF); see also BNEF reports a new record for renewable energy investments in 2015 ( memento from March 25, 2016 in the Internet Archive ) January 14, 2016.
- ↑ Bloomberg Clean Energy Investment
- ↑ IRENA: 2014–2015: At Glance (PDF)
- ↑ Frankfurt School of Finance & Management, press release ( Memento from April 4, 2015 in the Internet Archive ) (PDF) from March 31, 2015
- ↑ World Energy Investment Outlook 2014 . International Energy Agency; accessed on September 10, 2014.
- ↑ The World Nuclear Industry Status Report 2014, p. 74 (PDF) Retrieved on August 8, 2014.
- ^ Allianz Climate & Energy Monitor
- ↑ REN 21 Global Status Report. Retrieved December 3, 2016 .
- ↑ World Energy Outlook 2013, short version of the German translation (PDF) Internationale Energieagentur; accessed on September 10, 2014.
- ↑ G-20 Clean Energy Factbook: Who's winning the Clean Energy Race? (PDF; 3.0 MB) (No longer available online.) The Pew Charitable Trusts , archived from the original on September 9, 2013 ; accessed on February 18, 2014 (English).
- ↑ Greenpeace International, Global Wind Energy Council (GWEC) and SolarPower Europe (authors & reviewers) as well as the German Aerospace Center (DLR) as "esearch & co-authors" (Overall Modeling): Energy [r] evolution. (PDF) a sustainable world energy outlook 2015 - 100% renewable energy for all. Www.greenpeace.de, September 21, 2015, p. 364 , accessed on December 31, 2015 (English, size: 17,489 KB).
- ↑ Press release of April 12, 2019
- ↑ Voice of Africa: “Solar lighting revolution underway in Sierra Leone” , accessed on November 12, 2014
- ↑ Awareness Times Newspaper: Sierra Leone News of July 24, 2013: "God Bless the Kissi People" ( Memento of November 12, 2014 in the Internet Archive ), accessed on November 12, 2014
- ↑ a b c Share of renewable energies in gross final energy consumption. Eurostat, accessed 26 February 2020 .
- ↑ Share of renewable energies in the European Union almost doubled between 1999 and 2009 ( Memento from February 23, 2015 in the Internet Archive ). German Savings Banks and Giro Association . Retrieved September 16, 2014.
- ↑ Merkel creates a compromise . n-tv , March 9, 2007; accessed on September 10, 2014.
- ↑ Renewable energies in the EU . In: Der Tagesspiegel . January 24, 2008. Last accessed September 10, 2014.
- ↑ BMU database on renewable energies ( Memento from February 5, 2009 in the Internet Archive )
- ↑ EU Commission receives a lot of criticism for climate plans . In: Frankfurter Allgemeine Zeitung . January 22, 2014. Last accessed September 10, 2014.
- ↑ Energy trends and data - EU . (PDF) BP EnergyOutlook 2035.
- ^ The European Power Sector in 2017 - State of Affairs and Review of Current. Agora Energiewende , January 2018, archived from the original on July 29, 2018 ; accessed on May 16, 2020 .
- ↑ Christian Friege, Ralph Kampwirth: Forget the base load! In: Hans-Gerd-Servatius, Uwe Schneidewind , Dirk Rohlfing (eds.): Smart Energy. Change to a sustainable energy system . Berlin / Heidelberg 2012, 159–172, p. 167.
- ↑ EWEA: Response to the European Commission's Green Paper: Towards a European strategy for the security of energy supply. November 2001.
- ^ World Energy Outlook 2002 . International Energy Agency. Paris 2002.
- ↑ Federal Ministry for the Environment, Nature Conservation and Nuclear Safety (BMU): Renewable energies in numbers. National and international development. Berlin 2009.
- ↑ Global Wind Statistics 2014 (PDF) February 10, 2015 (PDF, page 3)
- ^ The projections for the future and quality in the past of the World Energy Outlook for solar PV and other renewable energy technologies. Matthieu Metayer, Christian Breyer, Hans-Josef Fell ( Memento from September 28, 2015 in the Internet Archive ) (PDF)
- ↑ Prognos AG, 1998: Opportunities to promote market incentives for renewable energies at the federal level, taking into account changed economic framework conditions .
- ↑ Prognos AG, 1984: Energy forecast - the development of energy consumption in the Federal Republic of Germany and its coverage up to the year 2000 .
- ↑ Prognos AG, 2005: Energy Report IV. The development of the energy markets up to the year 2030. Reference forecast for the energy industry. Investigation on behalf of the Federal Ministry of Economics and Labor . ( Page no longer available , search in web archives ) (PDF; 2.7 MB).
- ↑ National Renewable Energy Action Plan (PDF; 1.3 MB).
- ↑ International organization for renewable energies: REmap 2030 , see IRENA homepage
- ^ Liebreich: A year of cracking ice: 10 predictions for 2014 . In: Bloomberg New Energy Finance . January 29, 2014. Retrieved April 24, 2014.
- ↑ Deutsche Bank "Deutsche Bank: Second gold rush for photovoltaics begins" January 8, 2014.
- ↑ Julie Ayling, Neil Gunningham: Non-state governance and climate policy: the fossil fuel divestment movement . In: Climate Policy . 2015, doi : 10.1080 / 14693062.2015.1094729 .
- ↑ a b Volker Quaschning : Regenerative Energy Systems. Technology - calculation - simulation . 8th updated edition. Munich 2013, p. 54.
- ^ Weert Canzler , Andreas Knie : Smart networks. How the energy and transport turnaround succeeds . Munich 2013, p. 51 f.
- ↑ Joachim Nitsch , Frithjof Staiß: Perspectives of a solar energy network for Europe and the Mediterranean area . in: Hans-Günther Brauch: Energy Policy. Technical development, political strategies, strategies for action on renewable energies and the rational use of energy . Berlin / Heidelberg 1997, 473-486, p. 473.
- ↑ Reuters: Desertec at the end: The dream of desert electricity has failed . Desertec at the end. In: FAZ.NET . Frankfurter Allgemeine Zeitung, October 14, 2014, ISSN 0174-4909 ( faz.net [accessed June 27, 2020]).
- ↑ Spyros Chatzivasileiadis, Damien Ernst, Göran Andersson: The Global Grid. In: Renewable Energy. 57, 2013, pp. 372-383, doi: 10.1016 / j.renene.2013.01.032 .
- ↑ Volker Quaschning : Regenerative Energy Systems. Technology - calculation - simulation . 8th updated edition. Hanser, Munich 2013, p. 168. 978-3-446-42732-7.
- ↑ Reinhard Mackensen: Challenges and solutions for a regenerative electricity supply in Germany. Kassel University Press, Kassel 2011, ISBN 978-3-86219-187-1 (also dissertation at the University of Kassel 2011).
- ↑ Nina Scheer: Municipal energy supply needs municipal design security. Current amendment to § 46 EnWG must strengthen the municipalities. www.eurosolar.de, 2016, archived from the original on August 10, 2016 ; accessed on June 29, 2016 : "An increasingly reflected area is sector coupling: Linking the areas of electricity, heat and transport opens up further design options for energy generation and supply."
- ↑ Jochen Flasbarth in an interview with SOLARZEITALTER: About the chances of renewable energies after the climate summit in Paris. Interview with Jochen Flasbarth. www.eurosolar.de, 2016, archived from the original on August 10, 2016 ; accessed on March 9, 2016 : “I consider discussions that aim to slow down the expansion of renewables significantly to be fatal. Especially now, when it is becoming increasingly clear that we will foreseeably need additional amounts of electricity in the transport and heating sectors via the opportunities that lie in the sector coupling, that would be a completely wrong signal. "
- ↑ Hans-Martin Henning , Andreas Palzer: 100% renewable energies for electricity and heat in Germany. Fraunhofer Institute for Solar Energy Systems ISE, November 12, 2012, accessed on June 1, 2018 .
- ↑ Volker Quaschning : Regenerative Energy Systems. Technology - calculation - simulation . 8th updated edition. Munich 2013, p. 43.
- ↑ Valentin Crastan : Electrical energy supply 2 . Berlin - Heidelberg 2012, p. 192.
- ↑ Klaus Heuck, Klaus-Dieter Dettmann, Detlef Schulz: Electrical energy supply: generation, transmission and distribution of electrical energy for study and practice . 8th edition. Wiesbaden 2010, p. 30.
- ↑ Francesco Asdrubali, Giorgio Baldinelli, Francesco D'Alessandro, Flavio Scrucca: Life cycle assessment of electricity production from renewable energies: Review and results harmonization . Renewable and Sustainable Energy Reviews 42, (2015), 1113–1122, doi: 10.1016 / j.rser.2014.10.082 .
- ↑ Renewable energies in Germany, data on development in 2019 (PDF) website of the Federal Environment Ministry. Retrieved June 29, 2020.
- ↑ Felix Poetschke: Greenhouse gas emissions fell by 6.3 percent in 2019. In: www.umweltbundesamt.de. Federal Ministry for the Environment, Nature Conservation and Nuclear Safety BMU, March 13, 2020, accessed on July 26, 2020 .
- ↑ Volker Quaschning : Regenerative Energy Systems. Technology - calculation - simulation . 8th updated edition. Munich 2013, p. 358.
- ↑ WWF: Methane and nitrous oxide: The forgotten greenhouse gases (PDF; 1.1 MB) 2007.
- ↑ Bernhard Pötter: One percent hope: In 2014, German carbon dioxide emissions finally fell. That refutes the most dangerous argument against the energy transition. In: www.taz.de. January 2, 2015, accessed January 4, 2015 .
- ↑ a b Rolf Peter Sieferle , Fridolin Krausmann, Heinz Schlandl, Verena Winiwarter : The end of the surface. On the social metabolism of industrialization . Cologne 2006, p. 137.
- ↑ a b Volker Quaschning: Regenerative Energy Systems. Technology - calculation - simulation. 7th updated edition, Munich 2011, p. 23 f.
- ↑ https://www.greenpeace.org/international/story/20026/will-peak-oil-save-earths-climate/
- ↑ https://iea-etsap.org/E-TechDS/PDF/P02-Uncon_oil&gas-GS-gct.pdf
- ↑ World Energy Outlook 2010 (PDF; 895 kB). IEA website . Retrieved July 18, 2012.
- ^ EEC: Fossil and Nuclear Fuels - The Future Supply Situation. March 2013 ( Memento from April 17, 2013 in the Internet Archive ) (PDF; 7.7 MB).
- ↑ Report by the Ministry for Energy Transition, Agriculture, Environment and Rural Areas of the State of Schleswig-Holstein on the development and effects of energy prices ( Memento from February 1, 2014 in the Internet Archive ) (PDF; 2.4 MB). Retrieved November 1, 2012, p. 4.
- ^ Klaus Heuck / Klaus-Dieter Dettmann / Detlef Schulz, electrical energy supply. Generation, transmission and electrical energy for study and practice, 8th revised and updated edition, Wiesbaden 2010, p. 60.
- ↑ Marion Lienhard, Anna Vettori, Rolf Iten: Peak Oil - Opportunity for Sustainable Use of Energy? ( Memento of February 2, 2014 in the Internet Archive ) (PDF; 674 kB) Ed .: INrate, December 2006.
- ^ Rolf Peter Sieferle , Fridolin Krausmann, Heinz Schlandl, Verena Winiwarter : The end of the plane . On the social metabolism of industrialization . Cologne 2006, p. 15f.
- ↑ Rolf Peter Sieferle : Looking back on nature. A story of man and his environment. Munich 1997, p. 159f.
- ↑ In the English-language original: "recipe for disaster"
- ^ Edward Anthony Wrigley : Energy and the English Industrial Revolution . Cambridge University Press 2010, p. 247.
- ↑ Cf. Martin Kaltschmitt , Wolfgang Streicher (Ed.) Regenerative Energies in Österreich . Wiesbaden 2009, SV
- ↑ Cf. for this topic e.g. B. the anthology Reiner Braun, (Ed.): Wars for resources. Challenges for the 21st Century . Munich 2009.
- ↑ AEE: Fossil energies cupping emerging and developing countries; Switching to renewables saves expensive imports
- ^ The New Climate Report
- ↑ Expansion of renewable energies increases economic output in Germany, DIW weekly report 50/2010, p. 10 ff. (PDF; 601 kB).
- ^ Economic effects of the energy transition: Renewable energies and energy efficiency. (PDF) (No longer available online.) Institute for Energy and Environmental Research, formerly the original ; Retrieved May 20, 2014 . ( Page no longer available , search in web archives )
- ↑ FAU. Discussion paper “Germany without renewable energies?”. Electricity costs and security of supply without the feed-in of renewable energies in the years 2011–2013 ( Memento from March 30, 2016 in the Internet Archive ) (PDF)
- ↑ Institute for Ecological Economic Research: Value creation and employment effects through the expansion of renewable energies. 2013 (PDF; 864 kB).
- ↑ Economic added value through the production and export of climate protection technologies, sales related to climate protection , overview broken down by federal state.
- ↑ "Climate Smart Business": $ 640 billion investment potential (PDF) website from AT Kearney . Retrieved September 5, 2014.
- ↑ Well-filled order books in the wind energy industry . In: Deutschlandradio . July 27, 2011. Retrieved July 27, 2011.
- ↑ IRENA: REthinking Energy 2017. Annual Review 2017 (PDF); see. also IRENA: Renewable Energy and Jobs. Annual Review 2016 (PDF)
- ↑ Solar Jobs Surge Takes Clean Energy Employment to 6.5 Million . In: Bloomberg News . May 12, 2014. Retrieved May 21, 2014.
- ↑ Studies by the BMWi on the topic of employment effects in the energy sector. (pdf) Energy data and scenarios. (No longer available online.) Www.bmwi.de, June 4, 2015, archived from the original on May 31, 2018 ; accessed on June 1, 2018 .
- ↑ a b Employment through renewable energies in Germany: Expansion and operation - today and tomorrow, third report on gross employment ( memento from June 17, 2014 in the Internet Archive ) (PDF) website of the Federal Ministry of Economics. Retrieved September 16, 2014.
- ↑ GWS: Job effects of the renewables expansion in the federal states . Study, 2014 ( Memento from October 28, 2014 in the Internet Archive )
- ↑ See Jeremy Rifkin : The Third Industrial Revolution . Frankfurt am Main 2011, p. 56.
- ↑ Germany - Raw Materials Situation 2013 (PDF) Federal Institute for Geosciences and Raw Materials . Retrieved February 6, 2015.
- ^ Eric Viardot: The role of cooperatives in overcoming the barriers to adoption of renewable energy. In: Energy Policy. 63, 2013, pp. 756–764, doi: 10.1016 / j.enpol.2013.08.034 (here p. 757).
- ↑ EEG amendment. Decline in investments in community energy? . In: New Energy . July 8, 2014. Retrieved September 18, 2014.
- ^ Özgür Yildiz: Financing renewable energy infrastructures via financial citizen participation - The case of Germany. In: Renewable Energy. 68, 2014, pp. 677-685, doi: 10.1016 / j.renene.2014.02.038 (here p. 680).
- ^ Wuppertal Institute for Climate, Environment, Energy and Adelphi Consult: The importance of renewable energies in terms of security policy. In: wupperinst.org. November 20, 2007, accessed November 22, 2015 .
- ↑ Federal Ministry for the Environment, Nature Conservation, Building and Nuclear Safety (BMUB): Renewable energies support development towards peace. Study: Energy and security policy are closely linked. In: www.bmub.bund.de. November 19, 2007, accessed November 18, 2015 .
- ↑ Federal Ministry for Economic Cooperation and Development (BMZ): Renewable energies: From gas stoves to hydropower plants. Renewable energies help to secure the peace. In: www.bmz.de. Retrieved November 18, 2015 (2010–2015): “Energy policy is also security policy. In the past, wars were repeatedly fought over access to oil or gas. The dependence on resources can be misused as a political instrument and exacerbate conflicts. Renewable energies, however, are available on site. Nobody can deny access to the sun and wind. Their use therefore also contributes to crisis prevention. "
- ↑ BEE and DNR call for greater expansion of renewable energies, press release, 2016
- ↑ Seyyed Mohsen Mousavi Ehteshami, SH Chan: The role of hydrogen and fuel cells to store renewable energy in the future energy network - potentials and challenges. In: Energy Policy. 73, 2014, pp. 103-109, doi: 10.1016 / j.enpol.2014.04.046 .
- ^ Fulvio Ardente, Marco Beccali, Maurizio Cellura, Valerio Lo Brano: Energy performances and life cycle assessment of an Italian wind farm. In: Renewable and Sustainable Energy Reviews. 12, No. 1, 2008, pp. 200-217, doi: 10.1016 / j.rser.2006.05.013 .
- ^ A b Viktor Wesselak , Thomas Schabbach: Regenerative Energy Technology . Berlin / Heidelberg 2009, p. 25.
- ↑ Valentin Crastan : Electrical energy supply 2. Berlin / Heidelberg 2012, p. 5.
- ↑ Klaus Heuck, Klaus-Dieter Dettmann, Detlef Schulz: Electrical energy supply: generation, transmission and distribution of electrical energy for study and practice . 8th edition. Vieweg + Teubner, Wiesbaden 2010, p. 61.
- ↑ Jinqing Peng, Lin Lu, Hongxing Yang: Review on lifecycle assessment of energy payback and greenhouse gas emission of solar photovoltaic systems in: Renewable and Sustainable Energy Reviews 19 (2013) 255–274, in particular p. 256 u. 269, doi: 10.1016 / j.rser.2012.11.035 .
- ↑ CO2 emissions from power generation. (PDF, 1.6 MB) Ruhr University Bochum (2007), accessed on September 24, 2013 .
- ^ The Shifting Relationship Between Solar and Silicon in Charts. greentechmedia (2014), accessed on February 7, 2014 .
- ↑ Ursula Eicker : Solar technologies for buildings. Basics and practical examples . 2nd completely revised edition, Wiesbaden 2012, p. 94.
- ↑ During the construction of the Three Gorges Dam in China, z. B. more than a million people resettled
- ↑ M. Palic et al. a .: Cables and overhead lines in supraregional supply networks. Ehningen, 1992; Michael Otto Institute in the German Nature Conservation Union: Effects of regenerative energy generation on biological diversity using the example of birds. Facts, knowledge gaps, research requirements, ornithological criteria for the expansion of regenerative forms of energy generation. Bergenhusen 2004.
- ^ Specialist magazine Renewable Energies ( Memento from July 16, 2013 in the Internet Archive ), July 4, 2013.
- ^ BGR: The inaudible noise of wind turbines ( Memento from August 11, 2013 in the Internet Archive ).
- ↑ BUND: No more disco effect ( Memento from June 12, 2011 in the Internet Archive )
- ↑ Alois Schaffarczyk (Ed.): Introduction to Windenergietechnik , Munich 2012, pp. 128–130.
- ↑ Wind turbines and immission control ( Memento from March 10, 2012 in the Internet Archive ) (PDF; 1.3 MB). State Environment Agency NRW. Retrieved April 1, 2012.
- ^ Report of the NDR .
- ↑ Wind industry fears damage to image from negative report on neodymium use in wind turbines . ( Page no longer available , search in web archives ) In: Euwid New Energies . May 9, 2011. Last accessed July 5, 2012.
- ^ National Academy of Sciences Leopoldina (ed.): Bioenergy - possibilities and limits . Halle (Saale), Germany 2013, p. 23 ( leopoldina.org [PDF]).
- ^ National Academy of Sciences Leopoldina (ed.): Bioenergy - possibilities and limits . Halle (Saale), Germany 2013, p. 23 ( leopoldina.org [PDF]).
- ↑ Damage of up to 5 million due to geothermal energy project in Basel NZZ Online on June 24, 2007, last accessed on March 28, 2019.
- ↑ Cf. Viktor Wesselak , Thomas Schabbach: Regenerative Energietechnik . Berlin / Heidelberg 2009, p. 27.
- ↑ a b c Fraunhofer ISE: Study of electricity generation costs for renewable energies March 2018 . Retrieved March 22, 2018.
- ↑ Christian Breyer et al .: Profitable climate change mitigation: The case of greenhouse gas emission reduction benefits enabled by solar photovoltaic systems . In: Renewable and Sustainable Energy Reviews . tape 49 , 2015, p. 610–628 , doi : 10.1016 / j.rser.2015.04.061 .
- ↑ Volker Quaschning : Renewable Energies and Climate Protection , Munich 2013, p. 41.
- ↑ Viktor Wesselak , Thomas Schabbach : Regenerative Energy Technology . Berlin / Heidelberg 2009, p. 24.
- ↑ Cf. Martin Kaltschmitt / Wolfgang Streicher (ed.): Regenerative Energies in Österreich. Basics, system technology, environmental aspects, cost analyzes, potentials, use . Wiesbaden 2009, p. 554.
- ↑ Agora Energiewende: Comparing the Cost of Low-Carbon Technologies: What is the Cheapest Option? An analysis of new wind, solar, nuclear and CCS based on current support schemes in the UK and Germany. Berlin 2014 ( Memento from June 19, 2014 in the Internet Archive )
- ↑ DIW weekly report 29/2013 (PDF; 425 kB). Last accessed on November 27, 2016.
- ↑ Federal Network Agency: EEG surcharge will drop to 6.405 ct / kWh in 2019. Press release October 15, 2018.
- ↑ Brief study on the historical development of the EEG surcharge ( Memento from June 3, 2016 in the Internet Archive ) (PDF) In: Fraunhofer Institute for Solar Energy Systems . Retrieved September 8, 2014.
- ↑ Electricity price developments in the area of tension between the energy transition, energy markets and industrial policy. The Energy Transition Cost Index (EKX), study, 2012 .
- ↑ The energy transition could cost up to a trillion euros . Interview, FAZ, February 19, 2013.
- ↑ Answer to the question to the Federal Government of February 27, 2013 ( Memento of June 3, 2013 in the Internet Archive ).
- ↑ BEE managing director Falk: Altmaier fuels criticism of the energy transition with dubious accounts . Press release, February 20, 2013.
- ↑ Lena Reuster, Swantje Küchler: The costs of the energy transition - How resilient is Altmaiers a trillion ?, 2013
- ↑ EU-COM: Communication - Electricity Market (2013) ( Memento from January 6, 2014 in the Internet Archive ) (PDF)
- ↑ Country report Germany of the IEA ( Memento of September 14, 2013 in the Internet Archive ) (PDF; 724 kB).
- ↑ Study: Households can save hundreds of euros every year with renewable heat (PDF) October 22, 2010, last accessed on March 30, 2012.
- ↑ Video Wiso: Avoid expensive heating costs in the ZDFmediathek , accessed on January 26, 2014.
- ↑ Fossil fuels are the number one cost driver, press release, November 12, 2013
- ↑ Information sheet on renewable energies (PDF) KfW website . Retrieved May 20, 2014.
- ↑ Method Convention 3.0 for the determination of environmental costs, cost rates, p. 18 . Website of the Federal Environment Agency . Retrieved August 26, 2019.
- ↑ Jürgen Giesicke, Emil Mosonyi : Wasserkraftanlagen. Planning, construction and operation . Berlin / Heidelberg 2009, p. 78.
- ^ Lorenz Jarass , Gustav M. Obermair, Wilfried Voigt: Wind energy. Reliable integration into the energy supply. Berlin, Heidelberg 2009, p. 94.
- ↑ a b Volker Quaschning : Regenerative Energy Systems. Technology - calculation - simulation . 8th updated edition. Munich 2013, p. 397.
- ↑ Viktor Wesselak , Thomas Schabbach: Regenerative Energy Technology . Berlin / Heidelberg 2009, p. 26f.
- ↑ External costs of electricity generation from renewable energies compared to electricity generation from fossil fuels (PDF; 345 kB). Fraunhofer Institute for Systems and Innovation Research . Retrieved September 24, 2013.
- ↑ Eleni K. Stigka, John A. Paravantis, Giouli K. Mihalakakou: social acceptance of renewable energy sources: A review of contingent valuation applications. In: Renewable and Sustainable Energy Reviews. 32, 2014, pp. 100-106, doi: 10.1016 / j.rser.2013.12.026 .
- ^ A b Viktor Wesselak , Thomas Schabbach: Regenerative Energy Technology . Berlin / Heidelberg 2009, p. 27.
- ↑ Volker Quaschning : Regenerative Energy Systems. Technology - calculation - simulation . 8th updated edition. Munich 2013, p. 392.
- ↑ Valentin Crastan : Electrical energy supply 2 . Berlin - Heidelberg 2012, p. 87.
- ↑ Valentin Crastan : Electrical energy supply 2 . Berlin / Heidelberg 2012, p. 88.
- ^ AG Energiebilanzen : Energy consumption in Germany in 2013 . P. 41, accessed April 9, 2014.
- ^ Subsidies and costs of EU energy. An interim report (PDF)
- ↑ Volker Quaschning : Regenerative Energy Systems. Technology - calculation - simulation . 8th updated edition. Munich 2013, p. 394.
- ↑ UBA: Estimation of environmental costs in the areas of energy and transport. Recommendations of the Federal Environment Agency. Dessau 2013 ( page no longer available , search in web archives ) (PDF)
- ↑ DIW / Öko-Institut: EKI - The energy cost index for German industry. Report 2017/03
- ↑ Rising power supply costs and rising prices: Who bears the additional burden? Economics Compact, No. 11, 2013 .
- ^ Against the wind: Guest contribution by Claudia Kemfert . DIW, August 6, 2014
- ↑ Federal Network Agency: Evaluation report on the Equalization Mechanism Ordinance (PDF)
- ↑ Significantly more exceptions. 2098 companies save the EEG surcharge . In: Süddeutsche Zeitung . February 11, 2014. Retrieved September 10, 2014.
- ↑ DUH: The energy transition and electricity prices in Germany - Poetry and Truth (PDF; 4.6 MB).
- ^ Lorenz Jarass : Wind energy. Reliable integration into the energy supply . 2nd completely revised edition, Berlin - Heidelberg 2009, p. 103.
- ↑ Renewables must continue to be promoted . In: The time . January 25, 2012. Retrieved January 25, 2012.
- ^ Tennet TSO: Market Review 2014. Electricity market insights. ( Memento from June 2, 2015 in the Internet Archive ) (PDF)
- ↑ VIK price index: VIK price index: industrial electricity prices continue to fall. March 7, 2014
- ↑ Panos Konstantin: Practical book energy industry. Energy conversion, transport and procurement in the liberalized market . Berlin / Heidelberg 2009, p. 181.
- ↑ The RP Energy Lexicon - Marginal Costs. In: www.energie-lexikon.info. Retrieved August 23, 2014 .
- ↑ Law for the Expansion of Renewable Energies - § 5 Definitions: "29." Storage gas "is any gas that is not renewable energy, but is generated exclusively using electricity from renewable energies for the purpose of intermediate storage of electricity from renewable energies," . In: www.gesetze-im-internet.de. Retrieved August 23, 2014 .
- ↑ Brief study on the historical development of the EEG surcharge ( Memento from June 3, 2016 in the Internet Archive ) (PDF) In: Fraunhofer Institute for Solar Energy Systems . Retrieved September 6, 2014.
- ↑ Cf. Volker Quaschning : Renewable Energies and Climate Protection . Munich 2013, p. 118.
- ↑ Price- lowering effects of solar power generation on the electricity market price ( Memento from February 1, 2012 in the Internet Archive ) (PDF; 2 MB). Study by the Institute for Future Energy Systems. Retrieved January 31, 2012.
- ^ Electricity on the stock exchange is cheaper than it has been for years . In: Frankfurter Allgemeine Zeitung . February 5, 2013. Retrieved April 24, 2014.
- ↑ Electricity prices without photovoltaic and wind expansion are significantly higher , pv-magazine.de, accessed on February 5, 2015.
- ↑ Siemens study: Renewables make electricity supply cheaper and safer , iwr.de, accessed on February 5, 2015.
- ↑ Germany without renewable energies? - Electricity costs and security of supply without the feed-in of renewable energies in the years 2011–2013 ( Memento from February 6, 2015 in the Internet Archive ), uni-erlangen.de, accessed on February 5, 2015.
- ↑ Fraunhofer IWS: Dynamic simulation of the power supply in Germany based on the expansion scenario for the renewable energy sector (PDF; 2.3 MB), final report from December 2009.
- ↑ Volker Quaschning : Regenerative Energy Systems. Technology - calculation - simulation . 8th updated edition. Munich 2013, p. 39.
- ↑ Kaspar, F., Borsche, M., Pfeifroth, U., Trentmann, J., Drücke, J., Becker, P .: A climatological assessment of balancing effects and shortfall risks of photovoltaics and wind energy in Germany and Europe , Adv. Sci. Res., 16, 119-128, 2019; DOI: 10.5194 / asr-16-119-2019
- ↑ Cf. Martin Kaltschmitt, Wolfgang Streicher, Andreas Wiese (eds.): Renewable energies. System technology, economy, environmental aspects . Berlin / Heidelberg 2006, pp. 534-537.
- ↑ Federal Network Agency: Monitoring Report 2012. Bonn, November 2012; Office for Energy Economics and Technical Planning (BET): Capacity market. Framework conditions, necessity and cornerstones of a design. Aachen, September 2011.
- ↑ DIW: Renewable Energies: Surpluses are a solvable problem. Weekly report No. 34/2013 (PDF; 507 kB).
- ↑ Spiegel online: Wetten auf den Wind, Report on the Forecasting of Yields from Wind Energy, November 23, 2009, accessed on February 2, 2010.
- ↑ Volker Quaschning : Regenerative Energy Systems. Technology - calculation - simulation . 8th updated edition. Munich 2013, p. 309.
- ↑ Alois Schaffarczyk (Ed.): Introduction to wind energy technology. Munich 2012, pp. 428–432.
- ↑ Robert Gasch , Jochen Twele (Ed.): Wind power plants. Basics, design, planning and operation. Springer, Wiesbaden 2013, p. 485.
- ^ Federal government: underground cables instead of overhead lines. October 7, 2015
- ↑ New networks for new energies. The NEP 2012: Explanations and overview of the results. (PDF; 5.2 MB) Archived from the original on August 9, 2016 ; accessed on January 31, 2018 .
- ↑ Financial Times Deutschland, "Network expansion cheaper than expected" ( Memento from July 10, 2012 in the Internet Archive )
- ↑ DENA: Power distribution networks must be significantly expanded for the energy transition ( Memento from March 14, 2013 in the Internet Archive ), on www.dena.de from December 11, 2012.
- ↑ DIW: Electricity Networks and Climate Protection: New premises for network planning. DIW weekly report No. 6/2015 (PDF)
- ↑ Network development plan shows: The energy transition is feasible . Press release Federal Association for Renewable Energy . Last accessed on July 5, 2012.
- ↑ Frequent forced shutdowns of wind farms . In: Handelsblatt . November 28, 2012. Retrieved February 1, 2013.
- ↑ Wind Energy Report Germany 2013 ( Memento from April 13, 2014 in the Internet Archive ) (PDF) Fraunhofer IWES . Retrieved April 12, 2014.
- ^ Lorenz Jarass , Gustav M. Obermair, Wilfried Voigt: Wind energy. Reliable integration into the energy supply . Berlin / Heidelberg 2009, p. XIX.
- ↑ Wind busbar released . In: n-tv.de . December 18, 2012. Accessed January 31, 2013.
- ↑ Hochspannungstrasse Remptendorf upgraded . In: Thuringian General . December 4, 2012. Accessed January 31, 2013.
- ↑ Frequently asked questions about energy policy ( Memento of March 4, 2016 in the Internet Archive ) (PDF) 50Hertz Transmission GmbH. Retrieved August 16, 2015.
- ↑ 50Hertz halves redispatch costs . In: IWR , March 21, 2017. Retrieved May 22, 2017.
- ↑ Volker Quaschning : Regenerative Energy Systems. Technology - calculation - simulation . 8th updated edition. Munich 2013, p. 168.
- ^ Nicola Armaroli , Vincenzo Balzani , Towards an electricity-powered world . In: Energy and Environmental Science 4, (2011), 3193-3222, p. 3215 doi: 10.1039 / c1ee01249e .
- ^ Charlotte Ellerbrok: Potentials of demand side management using heat pumps with building mass as a thermal storage . In: Energy Procedia. 46, 2014, pp. 214-219, doi: 10.1016 / j.egypro.2014.01.175 .
- ↑ A. Arteconi, NJ Hewitt, F. Polonara: Domestic demand-side management (DSM): Role of heat pumps and thermal energy storage (TES) system . In: Applied Thermal Engineering . 51, 2013, pp. 155–165, doi: 10.1016 / j.applthermaleng.2012.09.023 .
- ↑ TAB report “Renewable Energy Sources for Securing the Base Load in the Power Supply”, 2012 ( Memento of October 30, 2012 in the Internet Archive ).
- ↑ The virtual power plant ( Memento from September 5, 2014 in the Internet Archive ) Fraunhofer IWES. Retrieved September 5, 2014.
- ^ Siemens: Study: Renewable Sources Can Provide Stable Power ( Memento of February 4, 2014 in the Internet Archive ) Press release from Siemens. Retrieved September 5, 2014
- ^ Weert Canzler , Andreas Knie : Smart networks. How the energy and transport turnaround succeeds . Munich 2013, p. 47.
- ↑ Volker Quaschning : Regenerative Energy Systems. Technology - calculation - simulation . 8th updated edition. Munich 2015, p. 393.
- ↑ Stefan Weitemeyer, David Kleinhans, Thomas Vogt, Carsten Agert, Integration of Renewable Energy Sources in future power systems: The role of storage . In: Renewable Energy 75, (2015), 14-20, doi: 10.1016 / j.renene.2014.09.028 .
- ↑ A. Moser, N. Red Ring, W. Wellßow, H. Pluntke: Additional needs for storing 2020 at the earliest . Electrical engineering & information technology 130, (2013) 75–80, p. 79, doi: 10.1007 / s00502-013-0136-2
- ↑ Advisory Council for Environmental Issues (2010): 100% renewable electricity supply by 2050: climate- friendly , safe, affordable. ( Memento of October 18, 2011 in the Internet Archive ) (PDF; 3.4 MB) p. 62.
- ^ Anne Therese Gullberg, Dörte Ohlhorst, Miranda Schreurs, Towards a low carbon energy future e Renewable energy cooperation between Germany and Norway . In: Renewable Energy 68, (2014), 216–222, doi: 10.1016 / j.renene.2014.02.001
- ↑ Volker Quaschning : Regenerative Energy Systems. Technology - calculation - simulation . 8th updated edition. Munich 2013, p. 374.
- ^ Dan Gao, Dongfang Jiang, Pei Liu, Zheng Li, Sangao Hu, Hong Xu: An integrated energy storage system based on hydrogen storage: Process configuration and case studies with wind power . Energy 66 (2014) 332-341 doi: 10.1016 / j.energy.2014.01.095 .
- ↑ Volker Quaschning : Regenerative Energy Systems. Technology - calculation - simulation . 8th updated edition. Munich 2013, p. 373.
- ↑ See Klaus Heuck / Klaus-Dieter Dettmann / Detlef Schulz: Electrical energy supply. Generation, transmission and electrical energy for study and practice . 8th revised and updated edition, Wiesbaden 2010, p. 57.
- ↑ 12 minutes without power SZ, from August 20, 2015
- ↑ The Underrated Law. Zeit online, September 25, 2006.
- ↑ Directive 2009/28 / EC on the promotion of the use of energy from renewable sources and on the amendment and subsequent repeal of Directives 2001/77 / EC and 2003/30 / EC. (PDF) .
- ↑ Germany clearly misses the EU target , SPIEGEL ONLINE, September 20, 2017 ; EU target missed for renewable energies , DIE WELT, 20 September 2017
- ↑ Renewable Energies 2010. ( Memento of March 16, 2012 in the Internet Archive ) (PDF; 1.2 MB) BMU, as of Feb 2013
- ^ Complete edition of the energy data - data collection of the BMWi. (XLSX; 2 MB) Federal Ministry for Economic Affairs and Energy , October 31, 2019, accessed on February 6, 2020 . .
- ↑ Renewable energies in 2015 ( Memento from March 26, 2016 in the Internet Archive ) (PDF) Federal Ministry of Economics. Retrieved March 25, 2016.
- ↑ Power generation 2016: Renewables unchanged, gas-based power generation is increasing, PV Magazin, January 4, 2017 , referring to the annual report of Fraunhofer ISE
- ↑ Mild weather depresses primary energy consumption in 2011. ( Memento from August 8, 2014 in the Internet Archive ) AG Energiebilanzen. Retrieved March 6, 2012.
- ↑ Experience report on the Renewable Energies Heat Act (EEWärmeG experience report) ( Memento from May 20, 2014 in the Internet Archive ) (PDF) Internet site of the Federal Environment Ministry. Retrieved May 20, 2014.
- ↑ On New Year's, Germany was only supplied with green electricity for the first time . In: Süddeutsche Zeitung , January 4, 2018. Accessed January 4, 2018.
- ↑ Energy Charts. Fraunhofer ISE , accessed on November 15, 2016 .
- ↑ EEX Transparency (German). (No longer available online.) European Energy Exchange , archived from the original on November 15, 2016 ; Retrieved on November 15, 2016 (up-to-the-minute information on the feed-in of electricity in Germany (share of PV and wind power and from other "conventional" sources)).
- ↑ Wind-sun record share of green electricity rises to 52 percent . In: Spiegel Online , April 1, 2020. Accessed April 2, 2020.
- ↑ Renewable Energies in Figures - National and International Development in 2014 ( Memento from January 7, 2016 in the Internet Archive ) (PDF) Internet site of the BMWI. Retrieved January 7, 2016.
- ↑ Time series on the development of renewable energies in Germany ( Memento from March 29, 2016 in the Internet Archive ) (PDF) Internet site of the VMWI. Retrieved March 25, 2016.
- ↑ Development of renewable energies in Germany in 2015 ( Memento from October 22, 2016 in the Internet Archive )
- ↑ a b Time series on the development of renewable energies in Germany. (PDF; 909 kB) (No longer available online.) Federal Ministry for Economic Affairs and Energy , February 2019, formerly in the original ; accessed on April 23, 2019 . ( Page no longer available , search in web archives )
- ↑ Existing renewable energy systems in Germany, overview (PDF)
- ↑ a b trend: research: Market players in renewable energy systems in power generation ( Memento from January 8, 2012 in the Internet Archive ) (PDF) August 2011.
- ↑ Definition and market analysis of citizen energy in Germany. 2013 (PDF) trend: research / Leuphane University
- ↑ Farmers earn well from the energy transition . NWZ Online, August 7, 2013.
- ↑ de.statista.com : Renewable energies according to owner groups
- ↑ Hans-Martin Henning, Andreas Palzer: A comprehensive model for the German electricity and heat sector in a future energy system with a dominant contribution from renewable energy technologies - Part I: Methodology . In: Renewable and Sustainable Energy Reviews 30, 2014, pp. 1003-1018, here p. 1003, doi: 10.1016 / j.rser.2013.09.012
- ↑ Allensbach, quoted in according to: Frank Brettschneider : Major projects between protest and acceptance. Legitimation through communication . In: Ders, Wolfgang Schuster (Ed.): Stuttgart 21. A major project between protest and acceptance . Wiesbaden 2013, 31–328, p. 320.
- ↑ a b c Renews Compact: Acceptance survey 2013: Renewable energy transition is still very popular with Germans. September 18, 2013 (PDF) Compilation of various surveys on energy policy.
- ↑ Representative survey: 95 percent of Germans want more renewable energies - report by the Renewable Energies Agency dated August 8, 2017 , accessed on August 8, 2017.
- ↑ Federal Ministry for the Environment, Nature Conservation and Nuclear Safety and Federal Agency for Nature Conservation (ed.): Nature Consciousness 2017 - Population Survey on Nature and Biodiversity. Berlin and Bonn, 2018. Available at: https://www.bmu.de/fileadmin/Daten_BMU/Pools/Broschueren/naturbewusstseinsstudie_2017_de_bf.pdf
- ↑ Majority for faster expansion of renewable energies . ( Memento from April 13, 2014 in the Internet Archive ) In: Politbarometer . April 11, 2014. Retrieved April 12, 2014.
- ↑ a b Agency for Renewable Energies: Acceptance survey 2014: 92 percent of Germans support the expansion of renewable energies
- ↑ Greenpeace Energy: Large majority of Germans want to keep the EEG. October 19, 2012 ( memento of October 23, 2012 in the Internet Archive ).
- ↑ Consumer interests in the energy transition (PDF) Federation of German Consumer Organizations. Retrieved September 19, 2014.
- ↑ German citizens consider the amount of the EEG surcharge to be appropriate in: EUWID New Energies, accessed on August 29, 2011.
- ↑ Fabian David Musall, Onno Kuik: Local acceptance of renewable energy. A case study from southeast Germany . Energy Policy , 39, (2011), 3252-3260, pp. 3252f, doi: 10.1016 / j.enpol.2011.03.017 .
- ↑ State trend Brandenburg August 2011 ( Memento from October 20, 2011 in the Internet Archive ). infratest dimap. Retrieved August 25, 2011.
- ↑ Survey: Great sympathy for renewable energies. The favorite among the Brandenburgers is wind power ( memento from February 8, 2013 in the Internet Archive ). In: Märkische Allgemeine . August 25, 2011. Retrieved August 25, 2011.
- ↑ No more majority for black and yellow . In: FAZ . December 10, 2011. Retrieved December 10, 2011.
- ↑ tagesschau.de ( Memento from July 23, 2015 in the Internet Archive )
- ↑ zeit.de
- ^ Austrian Energy Report 2003 ( Memento from September 26, 2006 in the Internet Archive ) (PDF; 6.4 MB), accessed July 2006.
- ↑ a b Renewable Energy in Figures 2010 ( Memento from August 25, 2012 in the Internet Archive ). Website. Retrieved July 27, 2012.
- ↑ The cost of green electricity is also increasing in Austria. Der Standard, January 3, 2011.
- ↑ Energy self- sufficiency for Austria can be achieved by 2050 . ORF online, January 26, 2011.
- ↑ COM (2009) 192: Communication from the Commission to the Council and the European Parliament - Progress Report "Renewable Energies" - Report from the Commission in accordance with Article 3 of Directive 2001/77 / EC and Article 4 (2) of Directive 2003/30 / EC and on the implementation of the EU Biomass Action Plan (COM (2005) 628)
- ↑ Renewable energy sources: Commission sued Austria for incomplete implementation of EU regulations .
- ↑ About the Güssing model - vision or reality? ( Memento from January 18, 2012 in the Internet Archive ) . European Center for Renewable Energy Güssing
- ↑ Energy statistics e-control ( Memento from September 27, 2007 in the Internet Archive )
- ↑ Operating statistics 2018. Annual production according to components. (No longer available online.) E-Control, June 2019, formerly in the original ; accessed on June 1, 2019 . ( Page no longer available , search in web archives )
- ↑ 2017 operating statistics. Annual production by components. (No longer available online.) E-Control, July 2018, formerly in the original ; accessed on July 21, 2018 . ( Page no longer available , search in web archives )
- ↑ Operating statistics 2016. Annual production according to components. E-Control, February 2018, accessed April 17, 2018 .
- ↑ Operating statistics 2015. Annual production according to components. E-Control, August 2016, accessed on October 25, 2016 .
- ↑ 2014 operating statistics. Annual production by components. E-Control, August 2015, accessed on September 26, 2015 .
- ↑ 2013 operating statistics. Annual production by components. (No longer available online.) E-Control, August 2014, archived from the original on April 18, 2015 ; Retrieved April 18, 2015 .
- ↑ Operating statistics 2012. Annual production according to components. (No longer available online.) E-Control, August 2013, archived from the original on December 3, 2013 ; accessed on January 6, 2014 .
- ↑ Operating statistics 2011. Annual production according to components. (No longer available online.) E-Control, August 2013, archived from the original on December 3, 2013 ; accessed on January 6, 2014 .
- ↑ Operating statistics 2010. Annual production according to components. (No longer available online.) E-Control, June 2012, archived from the original on January 6, 2014 ; accessed on January 6, 2014 .
- ↑ a b e-control: Ökomengen total year 2008, ( page no longer available , search in web archives ) accessed January 1, 2010.
- ↑ e-control: annual series accessed December 30, 2012.
- ↑ An overwhelming majority wants to expand wind power ( memento from January 8, 2012 in the Internet Archive ) IG-Windkraft press release, October 25, 2011. Accessed on October 25, 2011.
- ↑ Swiss Electricity Statistics 2018, Federal Office of Energy SFOE Switzerland ( Memento of May 13, 2010 in the Internet Archive ), published on June 21, 2019
- ↑ Swiss Statistics of Renewable Energies, 2018 edition - advance copy from the Swiss Federal Office of Energy SFOE ( memento of October 23, 2017 in the Internet Archive ), published on June 27, 2019
- ↑ Wind turbines: low impact on residents ( memento of October 29, 2013 in the Internet Archive ). Federal Office for Energy . Retrieved October 28, 2013.
- ↑ Effects of wind turbines on residents in Switzerland: influencing factors and recommendations (PDF; 1.8 MB). Website of the BfE. Retrieved October 28, 2013.
- ↑ Net Generation by Energy Source: Total (All Sectors) . Energy Information Administration . Retrieved September 19, 2014.
- ↑ Global Wind Statistics 2013 (PDF) Global Wind Energy Council. Retrieved March 23, 2014.
- ↑ Cf. Matthias Heymann : The history of the use of wind energy 1890–1990 . Frankfurt am Main 1995, pp. 393-405.
- ^ Matthias Heymann: The history of the use of wind energy 1890-1990 . Frankfurt am Main 1995, p. 346f.
- ^ About the California Solar Initiative (CSI) - Go Solar California
- ^ John A. Mathews, Hao Tan: China leads the way on renewables . Nature 508, April 17, 2014, p. 319, doi: 10.1038 / 508319a
- ↑ Global Wind Energy Statistics 2013 (PDF) Global Wind Energy Council. Retrieved March 19, 2014.
- ↑ Alois Schaffarczyk (Ed.): Introduction to wind energy technology. Munich 2012, p. 87.
- ↑ Alois Schaffarczyk (Ed.): Introduction to wind energy technology. Munich 2012, p. 79.
- ↑ Bloomberg New Energy Finance: CHINA'S 12GW SOLAR MARKET OUTSTRIPPED ALL EXPECTATIONS IN 2013 ( Memento from February 26, 2014 in the Internet Archive )
- ↑ China raises solar installation target for 2015 Reuters, October 8, 2015
- ↑ KlimaKompakt No. 86: India's Climate Plan